Understanding How to Interpret a Balance Sheet Effectively
Written by Upstox Desk
Published on October 28, 2025 | 8 min read
A balance sheet is a type of financial document that indicates the assets, liabilities, and promoter equity of a business at a point in time. It is essential for traders, retail investors, and any interested party to properly analyse and understand a balance sheet for gauging any business's financial well-being.
In this blog, the essentials of balance sheet analysis are discussed within a collection of other useful information and techniques for good decision-making.
What is a Balance Sheet?
One of the three primary financial statements is a balance sheet. The other two are the income statement and the cash flow statement. It presents the accounting equation, which reads:
Assets = Liabilities + Capital
Assets: The resources that a business owns are referred to as assets. These can be in the form of cash, property, inventory, or accounts receivable. It is through its assets that a company runs and expands its operations. They are a symbol of the material and immaterial assets that a company uses to generate earnings and sustain itself.
Liabilities: On the other hand, liabilities involve the amounts a business owes to other parties. Loans, accounts payable and any other debt make up liabilities. Liabilities will indicate how leveraged a company is and are therefore basic in understanding a company's financial burden.
Equity is the reflection of the ownership interest of shareholders in a company. It is calculated as the difference between assets and liabilities. It represents the ownership interest of shareholders and reflects the residual value of a company after all liabilities have been settled. It is an important indicator of financial health because it indicates the net worth of the company and its potential for growth.
The balance sheet will always balance the two sides of the equation: assets on one side, and liabilities plus equity on the other.
How to Conduct a Balance Sheet Analysis
First, look at the assets of the company to fully understand the range of resources available. Then, analyse the liabilities to understand its risks and financial obligations. This will give you a complete view of the overall financial condition of the company.
-
Read the asset form structure:
Normally, assets fit into one of these two categories:
Current Assets: Current assets are sources of funds that may be disposed of to cash within one year. cash, inventory and accounts receivable fall under this category.
Takeaway: Current assets constituting a high proportion represent liquidity and are therefore very important in satisfying the short-term obligations.
Non-Current Resources: The property, plant, equipment and intangible assets that the firm keeps for long periods of time are known as non-current assets. Growth-oriented businesses spend a huge amount of their resources on non-current assets. Such expenses are incurred to grow the business and increase the production capacity.
Takeaway: The expansion-oriented firms are very specific about investing heavily in non-current assets.
-
Liabilities Analysis
Liabilities also fall into two categories:
Current Liabilities: Current liabilities are obligations that a company must settle within a year. This category includes accounts payable and short-term loans, which represent immediate financial commitments that the business needs to manage effectively.
Indicator: Compare current liabilities with current assets to measure liquidity.
Non-Carrying Liabilities: This class of liabilities consists of long-term liabilities, including bonds and long-term loans.
Indicator: A manageable level of long-term debt suggests financial stability.
-
Measure Equity
Equity represents a residual interest in any assets after paying off liabilities. It comprises of:
- Share capital means the funds collected from the shareholders that are very helpful to run the business or in its growth process.
- Additional retained earnings, therefore, are the profits that are not distributed to the shareholders but reinvested into the business.
- Increasing trends of retained earnings indicate a sound financial health of the company as it shows its profitability and proper reinvestment policies adopted.
Balance sheet analysis: Key metrics
-
Current Ratio
The current ratio calculates the company's liquidity and financial health regarding its capability to pay for short-term obligations using its short-term assets.
-
The debt to equity ratio

In this context, total liabilities encompass all debts and liabilities a company may have while total equity encompasses all equity ownership of shareholders. With an increased debt-to-equity ratio, a firm essentially implies that the business uses a greater percentage of debt for its operation. Under this scenario, the firm has an increased financial risk because of the circumstance.
A smaller percentage refers to a rather conservative funding approach whereby there's still a dependence on equity.

This version of the formula is another perspective as it reverses the ratio. In this version of the formula, it states the percent of equity available to reduce the liabilities of the firm in terms of the total of the two variables, namely total equity divided by total liabilities. Here, the greater ratio represents a greater equity strength against liabilities. It might show that the business will be less vulnerable to the financial strain.
-
ROE, Return on equity
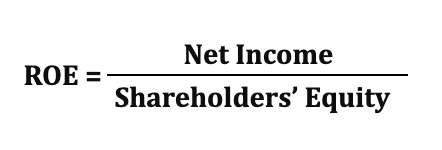
The Return on Equity (ROE) measures a company's profitability, showing how much profit is made for each rupee of shareholders' equity. It demonstrates how effectively management generates profits from equity investments.
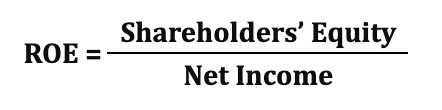
ROE is known as the equity ratio to net income. In calculating the return of earnings of the business, it points out the significance of the equity.
Practical Steps for Analysing a Balance Sheet
-
Begin with liquidity
Liquidity ratios are indicators of a firm's ability to pay its short-term obligations like quick and current ratios.

It is understood as the ratio of quick or liquid assets a firm may use to meet the short-term obligations that do not involve inventories.
It provides critical insight into financial health through revealing how well current assets can pay current creditors without depending on sales of inventories, thereby providing insight into financial health.

The QR compares current obligations to the difference between inventories and current assets for the purpose of evaluating liquidity. This throws a spotlight on easily convertible assets for immediate commitments.
-
Solvency Determination
Analyze the company's debt levels over a long period. The sustainability of the business in terms of handling its debt without going overboard is indicated by a sustainable debt-to-equity ratio.
-
Trend Analysis
Analyze balance sheets from various periods of time to trace changes in equity, buildups of debt, or increases in assets.
-
Comparison with Industry Benchmarks
One of the debt-to-equity ratios is that comparing a firm's total obligations against its shareholders' equity. It measures the share of debt that a firm uses to finance its activities compared to shareholder equity.
Higher debt-to-equity ratios increase the risk, especially in the industries that are least able to handle high leverage.
Some measures such as D/E ratio must be benchmarked relative to peer industries so as to bring out a more vibrant financial analysis. With such comparison, businesses have the avenue of judging the financial plan with industry benchmarks, where the contextual understanding is assured.
Common Mistakes in Ba****lance Sheet Analysis
Ignore Off-Balance-Sheet Items: Operating leases, for example, may not appear on the balance sheet. Follow the footnotes for clarity.
Focusing solely on numbers: The company's market position is no less important, but so is the quality of management.
It completely excludes all the non-operating assets; however, it includes investment and deferred taxes as valued assets.
A Comprehensive Guide t****o Balance Sheet Analysis
-
Year-over-Year (YoY) and Period-to-Period Trends
More insight is provided if the analysis of the balance sheet considers sequentially or year-to-year trends. Some methods indicate the difference in the financial performance over certain periods of time:
- Year-over-year comparison compares the same period in different years. For instance, comparing the sales growth of Q3 2023 to that of Q3 2022 would inform the consistency in the long run or the emergence of new patterns.
- Sequential Analysis: It is an analysis of data over successive periods, for instance, Q2 2023 compared with Q1 2023. This helps determine seasonal effects or transient variations in performance.
-
Calculate and Interpret the Differences
One must compare the following to properly assess a company's financial health:
Growth Rates: Monitor year-over-year or sequential percentage changes in key measures like revenues, expenses, or liabilities.
Important Ratios in Finance: While analysing business efficiency and robustness, liquidity, solvency, and profitability ratios are used, such as the debt-to-equity ratio and the current ratio.
-
Pattern Variability Detection
Those differences, whether increases or decreases, can sometimes tell a story. A rapid increase in accounts receivable may indicate slower collections or more sales. Apparently, such a sharp decline in inventories might be associated with strong sales or possible supply chain issues.
-
Using Trends as Investment Drivers
Retail traders and investors can identify red flags or steady growth by comprehending sequential and year-over-year trends. Therefore, a) evaluate the effectiveness of management strategies, and b) invest in lines aligned with businesses whose fundamentals are steady or getting better.
With these approaches, you can be sure balance sheet research gives you insights that are customized for your investing goals rather than numbers.
About Author
Upstox Desk
Upstox Desk
Team of expert writers dedicated to providing insightful and comprehensive coverage on stock markets, economic trends, commodities, business developments, and personal finance. With a passion for delivering valuable information, the team strives to keep readers informed about the latest trends and developments in the financial world.
Read more from Upstox


Upstox is a leading Indian financial services company that offers online trading and investment services in stocks, commodities, currencies, mutual funds, and more. Founded in 2009 and headquartered in Mumbai, Upstox is backed by prominent investors including Ratan Tata, Tiger Global, and Kalaari Capital. It operates under RKSV Securities and is registered with SEBI, NSE, BSE, and other regulatory bodies, ensuring secure and compliant trading experiences.
Related articles


Online Trading
What Are High-Yield NCDs? A Beginner’s Guide to Safer Fixed-Income Investing3 min read | Written by Mariyam Sara

Online Trading
Understanding the Put-Call Ratio: A Key Indicator for Market Sentiment and Trading Strategies5 min read | Written by Dev Sethia

Online Trading
Is Forex Trading Legal in India? All You Need to Know About Legalities and Penalties6 min read | Written by Dev Sethia
Online Trading
Understanding Profit After Tax (PAT): What It Means for Investors and Businesses5 min read | Written by Dev Sethia