What is Put Ratio Spread - Strategy & Formula
Written by Upstox Desk
Published on February 10, 2026 | 6 min read
A put ratio spread is a three-legged option strategy, created exclusively with put options. The ratio represents the number of puts bought or sold and the sequence in which the put options are bought and sold determines the nature of front or back spread. When more out-of-the-money puts are sold it is known as put ratio front spread. When more out-of-the-money puts are bought, it’s referred to as put ratio back spread. The front and back also refers to the sequence of put options that are purchased or sold to gear the ratio in 2:1 design.
This strategy is designed to take advantage of market direction on downside or take advantage of slow price movement resulting in price stagnation. It is important to remember that put options should belong to the same underlying security and must have the same expiration as well.
Put Ratio Front Spread
A Put ratio front spread is an option trading strategy which consists of more contracts on one strike than another. A front ratio signifies that there are more short contracts than the long ones. It is a bearish to neutral structure that is created by buying a put option on At-the-money strike and selling twice the number of put options on Out-of-the-money strike.
As the strategy involves selling more options, this is a net credit strategy aimed at reducing cost. The profit potential thus is limited to the difference between the bought and sold strike plus net premium received. The loss, however, can be unlimited. Therefore, this complex bit should be handled by experienced traders or investors.
Illustration:
| Strategy | Index | Action | Strike | Premium |
Put Ratio Front spread | Nifty50 | Sell Put | 17,700 (strike 1) | 100 |
Sell Put | 17,700 (strike 2) | 100 | ||
| Buy Put | 17,900 (strike 3) | -185 | ||
Net Premium | 15 |
Payoff chart
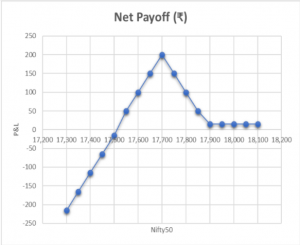
Payoff schedule
| Nifty50 @ Expiry | Net Payoff (₹) |
| 17,300 | -185 |
| 17,350 | -135 |
| 17,400 | -85 |
| 17,450 | -35 |
| 17,500 | 15 |
| 17,550 | 65 |
| 17,600 | 115 |
| 17,650 | 165 |
| 17,700 | 215 |
| 17,750 | 165 |
| 17,800 | 115 |
| 17,850 | 65 |
| 17,900 | 15 |
| 17,950 | 15 |
| 18,000 | 15 |
| 18,050 | 15 |
| 18,100 | 15 |
The spread between 2 strike prices is (17,900 -17,700) = 200.
Max profit = ([strike 3 - strike 1] + net premium received) * Lot size = (200 +15) * 50 = ₹10,750
Since the strategy is touted as credit spread, as the price appreciates, the short put premium is retained, but the long-put option expires worthless, thus leading to the entire erosion of premium. On the upper trajectory, when price goes above 17,900, the gains are reduced and remain limited to the net premium received i.e. ₹15
Break Even point = (Strike 1 – Max profit) = (17,700 – 215) = 17,485
The premium earned from two short put options extend the breakeven point further away from short strike, providing a considerable breathing space for the profitability of the trade
Max loss = unlimited below the breakeven point of 17,485
When the price declines, the probability of profit is reduced and the short put positions start to incur the loss. The profit from one long put option is just about enough to nullify loss from one short put option. The other un-hedged short put option runs the spread towards unlimited loss.
Put Ratio Back Spread
A put ratio back spread is usually created to earn a premium. It is deployed when traders expect strong down side move and increase in volatility. However, in case of an unforeseen up move in the market the trader’s aim is to retain some bit of credit and still profit from the spread.
The structure is created by selling one At-the-money put option and buying two Out-of-the-money put options. The sold put fetches the substantial premium as the time value is highest in At-the-money option. The bought pair of puts are cheap and Out-of-the-money options possess only time value. Essentially, the put ratio back spread is a bearish spread, with no downside risk and benefits from large sell off in underlying security. It is important to remember that the put options have the same underlying and same expiry.
Illustration:
| Strategy | Index | Action | Strike | Premium |
| Put Ratio Back spread | Nifty50 | Buy Put | 17,700 (strike 1) | -80 |
Buy Put | 17,700 (strike 2) | -80 | ||
Sell Put | 17,900 (strike 3) | 185 | ||
| Net Premium | 25 |
The difference between spread is 200 (17,900 – 17,700)
Max loss = (Spread – Net premium received) * Lot size = (200 – 25) * 50 = ₹8,750
Max loss occurs at the lower strike i.e. at 17,700
Lower breakeven point = (Strike 1 – Max loss) = (17,700 – 175) = 17,525
Upper breakeven point = (Strike 1 + Max loss) = (17,700 + 175) = 17,875
Profit = 1. On the downside the gains are potentially unlimited, when the market price slides down below lower breakeven point.
- On the upside the profit is limited to net premium received when the underlying moves above the upper breakeven point.
Payoff schedule
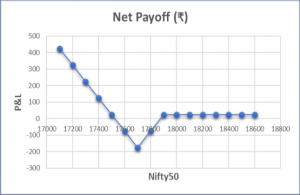
Payoff chart
| Nifty50 @ Expiry | Net Payoff (₹) |
| 17100 | 425 |
| 17200 | 325 |
| 17300 | 225 |
| 17400 | 125 |
| 17500 | 25 |
| 17600 | -75 |
| 17700 | -175 |
| 17800 | -75 |
| 17900 | 25 |
| 18000 | 25 |
| 18100 | 25 |
| 18200 | 25 |
| 18300 | 25 |
| 18400 | 25 |
| 18500 | 25 |
| 18600 | 25 |
Conclusion:
The put ratio spreads are easy to implement but very complex to manage when price movement becomes unfavorable. Both, put ratio front spread and put ratio back spread rely on increase in volatility, therefore executing these spreads very close to expiry will not yield best results. It is important to give some time to spreads, meaning expansion in volatility is more likely when there is more time to expiry of a contract.
To manage the trade, it is important to preserve the ratio of 2:1, however that being said – experienced traders and investors try to milk this strategy by skewing the ratios by adding additional legs and converting the spread ratio to 3:2 or 3:1, the higher number in ratio usually represents the number of sold options to obtain net credit in premium.
About Author
Upstox Desk
Upstox Desk
Team of expert writers dedicated to providing insightful and comprehensive coverage on stock markets, economic trends, commodities, business developments, and personal finance. With a passion for delivering valuable information, the team strives to keep readers informed about the latest trends and developments in the financial world.
Read more from Upstox


Upstox is a leading Indian financial services company that offers online trading and investment services in stocks, commodities, currencies, mutual funds, and more. Founded in 2009 and headquartered in Mumbai, Upstox is backed by prominent investors including Ratan Tata, Tiger Global, and Kalaari Capital. It operates under RKSV Securities and is registered with SEBI, NSE, BSE, and other regulatory bodies, ensuring secure and compliant trading experiences.
Related articles


Futures and Options
What is the Expiration Time in Options Trading?4 min read | Written by Mariyam Sara
Futures and Options
How to Trade in Options with Small Capital: Strategies for Success6 min read | Written by Upstox Desk

Futures and Options
Top 5 Futures Trading Strategies You Should Know in 20262 min read | Written by Mariyam Sara
Futures and Options
Best Ways To Calculate Commodity Price Risks: Understanding The Main Risks Involved5 min read | Written by Upstox Desk