Basics of Options
Option Chain
What is an Option Chain?
The Option Chain is a table that contains the most critical information needed to purchase and sell options. We have previously discussed calls and puts, underlying prices, strike prices, expiration, and moneyness. The option chain is where all of this comes together (just like that map of the metro network).
Each financial services firm will have their own way of presenting the option chain, and not all of them may contain the same pieces of information. Even though different websites and apps will present slightly different data in slightly different ways, once you learn what to look for, as well as how to use it, the differences won’t matter.
How do you read the option chain?
All option chains will have a section that contains data for call options and a section for put option data. The call option section will be on the left side of the table, and the put option section will be on the right side of the table. Each row of this table will be a strike price that will have both call and put options associated with it. Typically, the strike price is in the center of the table. This allows the strike price column to separate the call and put option sections, as well as to make it easier to read regardless of whether you are interested in call or put options.
In the illustration below, we have a screenshot of the Upstox option chain that is on the desktop version of the website. We highlight the call option section in blue and the put option section in orange. In between the two sections is a column for the strike prices. Before we get into more specific data points, you will also see a horizontal section in the middle with a number (45737.50). This is the current or spot price of the underlying.
Illustration 1: Example Option Chain on the Upstox website
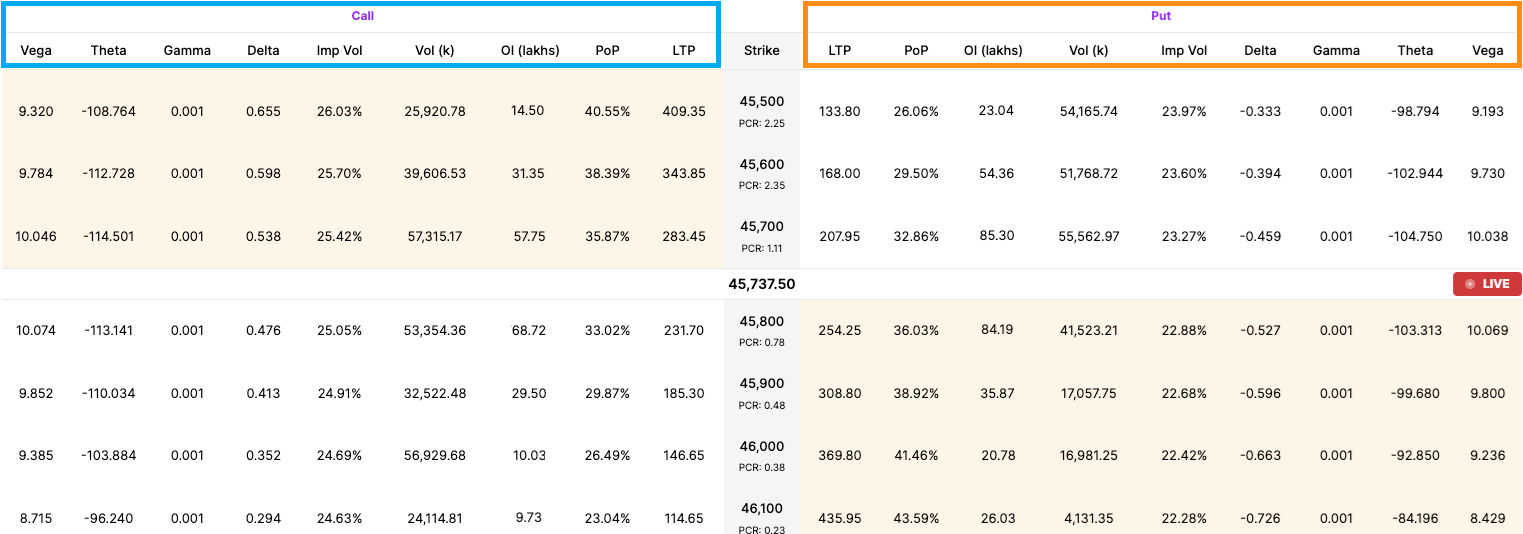 Source: Upstox
For call options (on the left side), any row of strike prices above this horizontal line that contains the current underlying price is ‘in-the-money’. This is because the strike prices are sorted from low-to-high. As discussed earlier in the lesson about moneyness, if the call option strike price is less than the underlying price, then the call option is in the money.
In the screenshot above, the call option section above the marker for the current underlying price is colored in tan. While the color may vary, this is a common design theme for wherever you find option chains that highlight strikes that are in the money.
On the opposite side, the put option section is colored tan below the horizontal line for the current underlying price. As with the call options, this is the indicator that these rows of strike prices for put options are in the money.
In addition to the main table, there will be sections or filters associated with expiration dates. Each underlying will have strike prices for multiple expiration dates. Some websites may publish option chains with the long list of strike prices for the nearest expiration date and then the next list of strike prices for the next subsequent expiration date. Another convention you may find is a filter that allows the trader to select which expiration date they want to see data for.
An example of this is below. This is an animated gif of the Upstox option chain in the Pro app. As in the example above, call options are on the left and put options are on the right. Similarly, in-the-money call option strike prices are shaded in tan on the top left, while in-the-money put option strike prices are shaded in tan on the bottom right. Towards the top, you will see a series of dates: 7 March 2024, 14 March 2024, etc. The date selected is 7 March 2024; this is the expiry date for this particular set of option contracts.
Illustration 2: Example Option Chain on the Upstox Pro App
 Source: Upstox
What is included in the option chain?
Now that we have covered the main sections of the option chain, let’s look at the primary data points that you will find in most option chains, including in our examples above.
-
Last Traded Price (LTP) / Change in LTP: The last traded price is for the respective call option and put option. During market hours, this could change by the second. For strike prices that are deep out-of-the-money and thinly traded, this data may be stale. Often quoted with the LTP is the change in last traded price, which is the difference between the prior day’s closing price and the current price.
-
Open Interest (OI) / Change in OI: The open interest is updated throughout the day as options are bought and sold to open, as well as bought and sold to close. The change in open interest for the day may be listed as well. The change in OI is based on the difference between the closing open interest value for the day before and the current value.
-
Volume: The volume represents the number of transactions for a particular call or put option contract. It is specific to the day. This value is updated throughout the day in real-time.
Lastly, there are additional data points that may be included in the option chain:
-
Implied Volatility: There is an implied volatility value associated with each call and put option. So for each row of strike prices and each expiration date, there will be an implied volatility. We will cover implied volatility in depth in this chapter, but this value is derived from the last traded price of the option. If an option hasn’t traded for the day—perhaps because it is deep out-of-the-money—there won’t be an implied volatility value for that particular option.
-
Option Greeks: There are several option Greeks, including Delta, Gamma, Theta, Vega, and Rho. These values inform the trader how much the price of the option will change based upon another value changing. For example, delta tells the trader how much the option price will change if the underlying price changes, and theta gives the value for how much the option price will change based on the passage of time. We will go into Greeks in more detail in later chapters.
-
Probability of Profit (PoP): Probability of profit is a less common data point provided but is one offered by Upstox. It is a measure of the likelihood that an option contract will return a profit. It considers all possible outcomes and their associated likelihoods and is expressed as a percentage. The higher the probability of profit, the more likely it is that the trade will generate a profit. This metric doesn’t provide insight into how much profit will be made; the return could be +1000% or +0.001%. PoP is derived from the Black-Scholes option pricing formula.
In short, an option chain is a snapshot of all the essential information a trader needs at hand while formulating a trading strategy. The ability to read and interpret an option chain could determine the extent of profit or loss traders could make when they trade. The upcoming chapters will help you build this skill.
Summary
- Option Chain is a table that contains the most critical information you need to buy and sell options.
- An option chain lists data on calls and puts, underlying prices, strike prices, expiration, and moneyness.
- Call option data is listed to the right of the table.
- Put option data is listed to the left of the table.
- Strike prices are listed on rows in the center of the table.
- Option chains may also have data on last traded price, open interest, volatility and Greeks.
Is this chapter helpful?
- Home/
- Option Chain