Basics of Options
Open Interest
Introduction to Open Interest
Before we learn what open interest is, let’s spend a minute discussing volume.
What is Volume?
If you have invested or traded in shares, chances are you might have heard of ‘volume.’ Volume means the number of shares traded. So if a buyer buys 100 shares and a seller sells those 100 shares, the volume is 100 shares (not 200).
Illustration 1: Volume in Reliance Industries (equity)
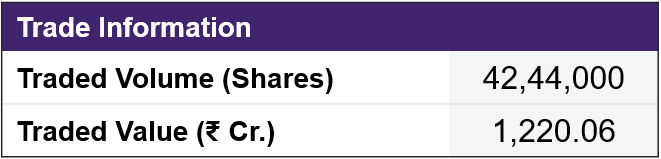 Source: NSE
The above image shows that a total of about 42.4 lakh shares of Reliance Industries were traded on 20 March 2024. The next day (i.e., on 21st), the volume counter will start from zero. So each day when the market opens, the volume counter resets to zero and rises from there as the shares get traded.
What is Open Interest?
Open interest, or OI, is the total number of contracts of an option that are currently open (or outstanding). In the image below, it shows the volume and open interest for the 2900-strike price call option of Reliance Industries. This information is for a particular trading day. A total of 6360 contracts of this 2900-strike call option are open as of this trading day. This is the open interest.
Illustration 2: OI in Reliance Industries 2900 Call option
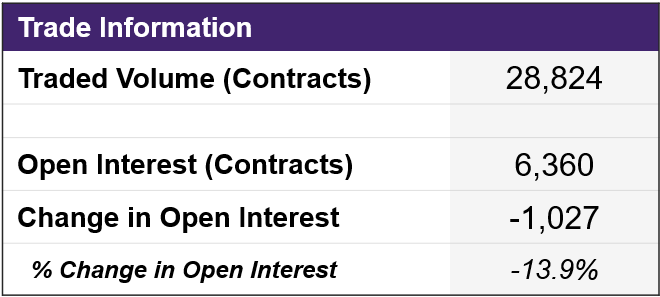 Source: NSE
When does OI change?
Using our example from the illustration above, if a buyer and seller both exit one contract, then the OI will decrease to 6359 contracts. Or if a buyer and seller add one new contract, the OI will increase to 6361. In the above illustration, the change in OI is -1027 contracts. It means 1027 more contracts were closed than were opened, and thus the reduction in OI.
Any increase or decrease in the OI stacks up on the previous day’s OI. This is unlike volume, which resets every day.
When does OI not change?
On a normal trading day, if a buyer or seller passes on one existing contract to a new seller or buyer, the OI remains unchanged. This is because no new contract is added. Overall, the changes in OI continue till the expiry of the contract.
How to use OI data for analysis?
Just like volume data, using OI data with the price movement can help you gauge market sentiment.
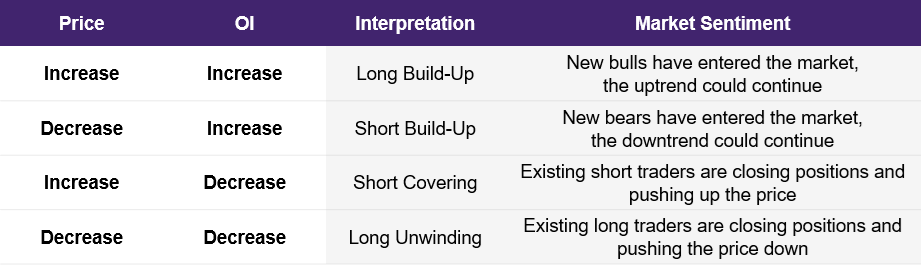 Source: NSE
Using OI for support and resistance
In options trading, sellers are usually considered more powerful, and there are a couple of reasons behind that:
- Option selling (aka. writing) requires bigger capital compared to option buying. Sellers have deep pockets.
- Institutions and high-net-worth individuals who prefer options selling have superior research capabilities. They are also called ‘smart money.’
At strikes with high OI, a large amount of selling is considered to have happened. (Of course, there are an equal number of buyers too. But as we discussed above, a higher consideration is given to sellers).
The Nifty50 option chain shown below is captured when the Nifty50 was at 21839. In the illustration below, we display the Upstox option chain for this index. The column with the OI for call options is highlighted with a green box; the OI for put options is highlighted with a red box. Let’s dig deeper.
Illustration 3: Nifty50 Option Chain
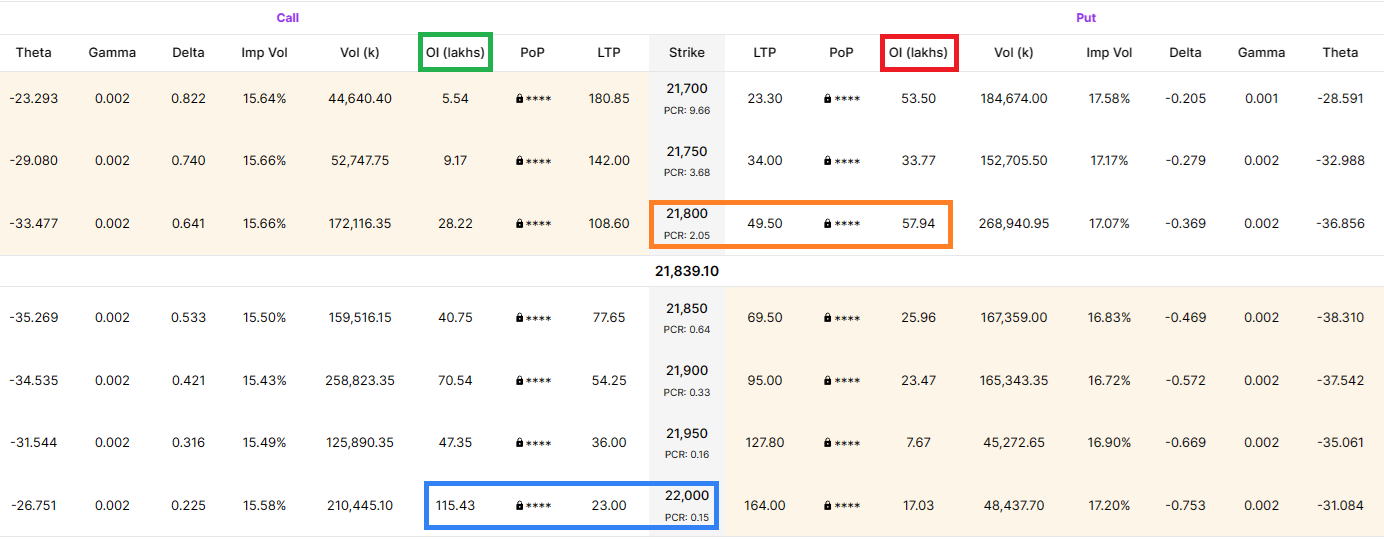 Source: Upstox
The 22000-strike call option (horizontal blue box) has the highest OI for the trading day. This high OI suggests that the maximum calls are sold at this strike because sellers do not expect the Nifty to rise above 22000 prior to expiry. So this could act as the resistance (what’s resistance? Read below).
Similarly, the 21800-strike put option (horizontal orange box) has the highest OI for puts. This suggests that maximum puts are sold at this strike because sellers do not expect Nifty50 to fall below 21800 on expiry. So this could act as the support (read below).
- Resistance: A price level around which a rising stock faces pressure. This is because of the presence of a large number of sellers who want to sell around that price.
- Support: A price level around which a declining stock witnesses buying interest. This is due to the presence of a large number of buyers who want to buy around that price.
Ideally, you should confirm the above support and resistance levels with at least one other technique such as:
- Swing lows and highs on price charts
- Fibonacci levels
- Moving averages
- Pivot levels
- Big round numbers (e.g., 21500, 22000)
Support and resistance levels help traders plan entry and exit points in a trade.
So this was a detailed discussion on open interest. We will see you in the next chapter where we will discuss Put Call Ratios or how to understand the mood of the market.
Summary
- Open interest taken along with price data helps gauge market sentiment for an options contract.
- Open Interest taken along with price data helps gauge market sentiment for an options contract.
- A negative OI indicates more contracts were closed than opened, and vice versa.
- Use OI options chain data to identify the support and resistance levels of an option contract. This can be used to decide when to enter or exit a trade.
Is this chapter helpful?
- Home/
- Open Interest