Basics of Options
Intrinsic and Time Value
Introduction to Intrinsic Value and Time Value
To introduce the concept of time value and intrinsic value, let’s go back to the long days of summer. What is the best part about summer, apart from school vacations? You bet! Those ripe, juicy, golden mangoes that we can’t get enough of.
How is that related to Time Value and Intrinsic Value? Let us show you.
Now, unless you have access to a mango tree, the mangoes you eat come in baskets or crates wrapped in newspaper and straw. Most of these would be unripe or nearing ripeness. This critical point is when the farmer gets the best price for the mangoes.
But, the price of the mango is also dependent on which variant it is. The most expensive are the Alphonso mangoes or the Hapus which are prized for their sweetness. The Time Value and Intrinsic Value of an options contract is somewhat similar.
As the time to expiry increases, the price of an options contract also increases. Just like the mangoes being priciest when they are at the near-ripe stage. However, the price of an options contract is also dependent on the value of the underlying. Just like you would pay more for the Hapus as compared to a Totapuri.
What is Intrinsic Value?
As we’ve learned previously, if the price of the underlying stock or index is higher than a call option’s strike price, then the call option is in-the-money. This means that if the option were to expire right now, it would be valuable. This value is known as intrinsic value. Let’s take a look at a simple example using the Upstox option chain.
Below is a screenshot of the Nifty50 option chain where the Nifty has a price of 22011.95. The 22000-strike price for a call option that expires in one week is priced at ₹206.00. Alternatively, there is a put option with a strike price of 22100 that is priced at ₹119.00.
Illustration 1
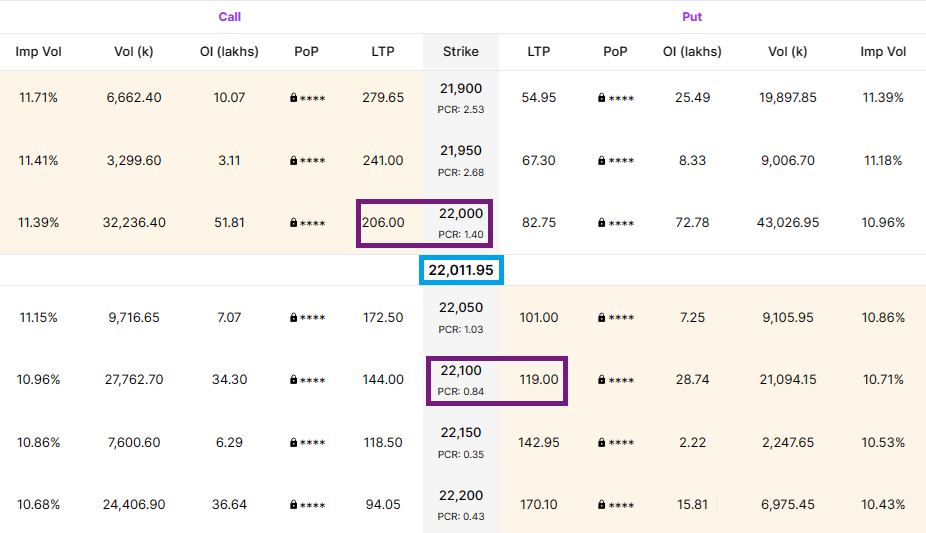 Source: Upstox
For a call option, the intrinsic value of an option is the difference between the underlying price and the strike price.
Key Formula:
- Call Option Intrinsic Value = Underlying Price – Strike Price
- 22011.95 – 22000 = 11.95
This should intuitively make sense because a call option gives you the right but not the obligation to purchase the underlying at the strike price on expiry. If this were expiry, you would be able to buy the Nifty for 22000 even though it is trading for 22011.95. You could then immediately sell it at the market price of 22011.95, earning a profit of 11.95.
For a put option, the intrinsic value formula is flipped. The intrinsic value of a put option is the difference between the strike price and the underlying price.
Key Formula:
- Put Option Intrinsic Value = Strike Price – Underlying Price
- 22100 – 22011.95 = 88.05
There are two additional points to make with intrinsic value:
-
Buying a call option gives you the right but not the obligation to buy the underlying. What if the underlying were trading at 21000 and you held a call option for the 22000-strike? You would let the option expire worthless because you would never want to use your call option to buy the Nifty at 22000 when you could simply buy it for 21000 in the open market. What this means is that intrinsic value cannot be negative. For a call option, if the underlying is below the strike price, then the intrinsic value is 0. This also means that the option is “out-of-the-money” in this situation.
-
Put options work differently. The Put Option Intrinsic Value is the Strike Price minus the Underlying Price. A put option will be in-the-money, and have intrinsic value, if the underlying price is below the strike price. This is because as a put buyer, you want the underlying price to fall in value in order to profit. Similarly, intrinsic value cannot be negative for a put option. If the underlying price is above the strike price, then the put option is “out-of-the-money” and the intrinsic value is 0.
Below is a diagram that uses this example to help you understand the relationship between strike price, underlying price, and intrinsic value for call options. In a later lesson, we will discuss the break-even price, which is the price that the underlying needs to cross for the option to be profitable on expiry.
Illustration 2a: Call Options
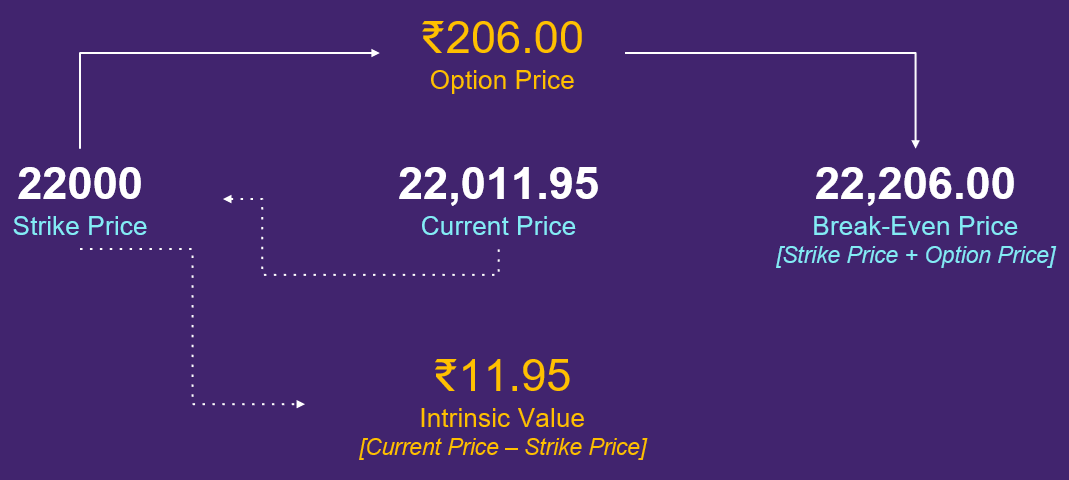 Source: Upstox
Illustration 2b: Put Options
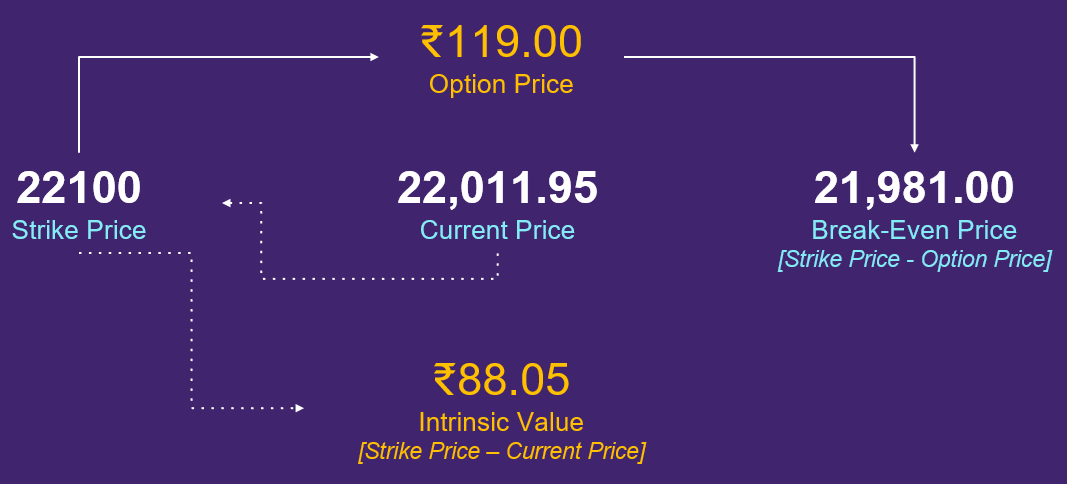 Source: Upstox
Taking our call option example one step further: if the intrinsic value of this call option is only ₹11.95, why are we paying ₹206.00 for this option? The answer is time value.
What is Time Value?
There is a saying that “time is money,” and it certainly applies to option prices. Here’s why:
- The more time between now and the expiration of the option, the more chance the underlying can move.
- The more the underlying can move, the higher the chance that the option could have intrinsic value.
Let’s review historical data to be more objective with this concept.
Below is a histogram that charts the distribution of the Nifty50 1-day returns over the last 15 years. On the horizontal axis are 1-day return ‘bins’. The vertical axis is the frequency of observations associated with those bins. If there is only one observation (or day) where the Nifty returned +10%, then the frequency of the vertical axis would be 1 for the +10% value on the horizontal axis.
As you can see, there are a large number of observations centered around 0% with few observations outside that are greater than +5% or less than -5%. On an average over the last 15 years, the daily return of the Nifty50 was +0.06%. The standard deviation, or range around the average, is ±1.17%. If you add the standard deviation to the average as well as subtract the standard deviation from the average, you will have a range that contains approximately 68% of values.
Based on this information, we can say that 68% of 1-day returns of the Nifty50 index over the last 15 years were between +1.23% and -1.11%.
Illustration 3: 1-Day Returns of Nifty50 for Last 15 Years
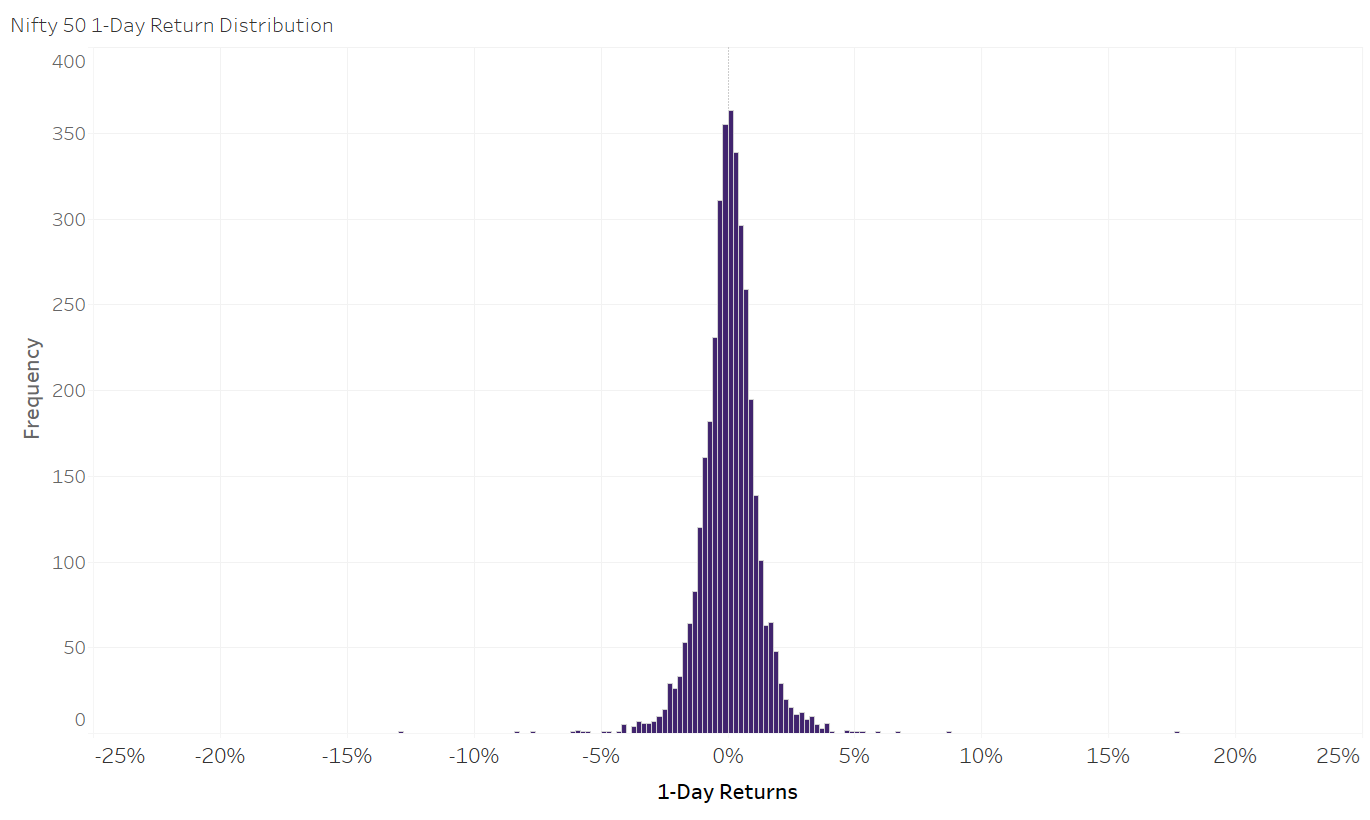 Source: Upstox
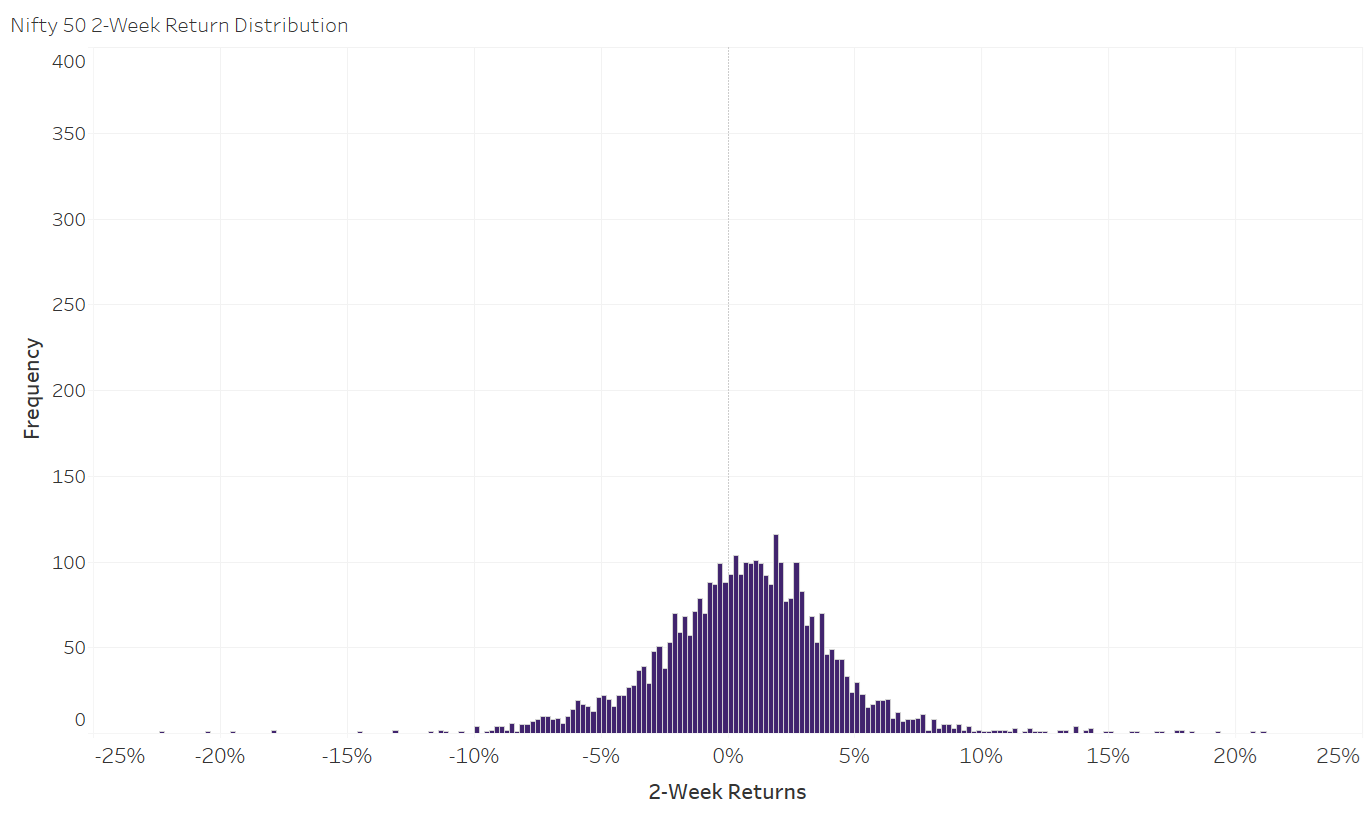
A comparison to the 1-day returns is seen in the chart below. This histogram chart plots the 2-week returns of the Nifty50 over the last 15 years. Visually, you can see that the distribution is ‘flatter’ and there are more observations that extend out to beyond +10% and -10%. On an average, the 2-week return of the Nifty50 was +0.60% with a standard deviation of ±3.74%. Performing a similar analysis as above, the range of values that represents approximately 68% of observations is +4.34% and -3.14%.
On the upper end for the 2-week returns is +4.34% which is substantively more than the upper end of the 1-day return range of +1.23%. The same is true when you compare the lower end of the 2-week returns of -3.14% to the lower end of the 1-day return of -1.11%. This makes sense because indices, as well as individual stocks, will move more over a longer time frame than over a shorter time frame.
Illustration 4: 2-Week Returns of Nifty50 for Last 15 Years
 Source: Upstox
Let’s return one more time to a call option example where the Nifty is trading at 22,011.95, the call strike price selected is 22000 and we will look at an option expiring in two weeks instead of one week. In this case, the price of this option is higher at ₹319.95 compared to ₹206.00. The intrinsic value of this option is ₹11.95 (22011.95 – 22000) and the time value of this option is ₹308.00 (319.95 – 11.95).
In order for this call option to be profitable on expiry, the Nifty will need to rise in price enough to cover the purchase price of the option. This means that the Nifty needs to rise to 22,319.95 or higher to break-even on this trade.
The price of 22,319.95 is 1.40% higher than the current price of 22,011.95. Looking at historical data, we know that the Nifty50 1-day moves tend to be between +1.23% and -1.11%. The required move of +1.40% for this option contract to breakeven is higher than the upper end of one-day moves. However, you are “buying time” with a contract that expires in two weeks. Historical data shows that the Nifty50 2-week moves are usually between +4.34% and -3.14%. The required move of +1.40% to reach profitability is far more feasible across a two-week period than a shorter time frame.
Key Formula:
- Time Value = Option Price – Intrinsic Value
- Intrinsic Value (Call Options) = Max(Underlying Price – Strike Price, 0)
- Intrinsic Value (Put Options) = Max(Strike Price – Underlying Price, 0)
Summary
- Options pricing is a function of its time value and intrinsic value.
- As the time to expiry increases, the price of an options contract also increases. This is Time Value.
- The price of an options contract is also dependent on the value of the underlying. This is its Intrinsic Value.
Is this chapter helpful?
- Home/
- Intrinsic and Time Value