As of 4 Jul 2026, ZEN TECHNOLOGIES share price is ₹1,746.70. The stock opened at ₹1,784.00, compared to its previous close of ₹1,773.20. During today's trading session, ZEN TECHNOLOGIES share price moved in the range of ₹1,740.10 to ₹1,806.60, with an average price of ₹1,773.35 for the day. Looking at its last 52-week, the stock has touched a low of ₹1,223.00 and a high of ₹2,024.00. On the performance front, ZEN TECHNOLOGIES share price has increased by 28.21% over the last six months and is down 9.28% on a year-on-year basis.
| Name | Mkt Cap Cr | P/E | P/B | ROE | D/E | ROCE | Book Value | Div. Yield | Turnover | EPS(TTM) |
|---|---|---|---|---|---|---|---|---|---|---|
| BEL | 3,03,502.00 | 50.08 | 12.65 | 25.27% | 0.00 | 33.35% | 32.42 | 0.60% | 1.10 | 8.27 |
| HAL | 2,96,515.00 | 32.53 | 7.22 | 22.21% | 0.00 | 14.09% | 611.01 | 0.79% | 0.38 | 135.71 |
| Solar Industries (India) | 1,68,695.00 | 97.14 | 26.87 | 26.72% | 0.04 | 29.10% | 467.10 | 0.06% | 1.21 | 135.01 |
| MAZAGON DOCK SHIPBUIL LTD | 1,03,029.00 | 39.96 | 10.56 | 26.48% | 0.00 | 32.01% | 219.23 | 0.71% | 1.24 | 60.38 |
| Bharat Dynamics | 50,746.90 | 120.70 | 11.97 | 9.91% | 0.00 | 7.22% | 115.70 | 0.35% | 0.31 | 11.47 |
| Cochin Shipyard | 39,967.20 | 55.77 | 6.81 | 12.20% | 0.27 | 14.45% | 223.99 | 0.10% | 0.66 | 24.44 |
| Garden Reach Ship & Eng | 31,749.20 | 42.45 | 12.09 | 28.48% | 0.01 | 38.21% | 229.25 | 0.71% | 2.52 | 65.29 |
| ITI | 28,885.10 | 98.65 | 15.16 | -8.20% | 0.41 | 1.44% | 19.23 | 0.00% | 1.07 | 3.04 |
| Data Patterns India | 26,056.30 | 96.02 | 15.01 | 15.63% | 0.00 | 21.41% | 310.08 | 0.21% | 0.52 | 48.47 |
| MTAR Technologies | 22,768.10 | 242.13 | 27.68 | 11.43% | 0.46 | 12.93% | 268.43 | 0.00% | 0.85 | 30.99 |
| Particulars | Mar 2025 | Mar 2024 | Mar 2023 | Mar 2022 |
|---|---|---|---|---|
| Revenue | ₹973.64 | ₹439.85 | ₹218.85 | ₹69.75 |
| Other Income | ₹58.39 | ₹14.92 | ₹7.25 | ₹5.38 |
| Total Revenue | ₹1,032.03 | ₹454.77 | ₹226.09 | ₹75.13 |
| Total Expenses | ₹625.91 | ₹271.03 | ₹156.37 | ₹71.55 |
| Profit Before Tax | ₹406.07 | ₹186.15 | ₹71.73 | ₹3.30 |
| Tax | ₹106.74 | ₹56.65 | ₹21.76 | ₹0.69 |
| Profit After Tax | ₹299.33 | ₹129.50 | ₹49.97 | ₹2.61 |
| EPS - Basic | ₹32.07 | ₹15.45 | ₹5.39 | ₹0.25 |
| EPS - Diluted | ₹32.07 | ₹15.34 | ₹5.20 | ₹0.25 |
| Particulars | Mar 2025 | Mar 2024 | Mar 2023 | Mar 2022 |
|---|---|---|---|---|
| Profit before tax | ₹406.07 | ₹186.15 | ₹71.73 | ₹3.30 |
| Income before WC changes | ₹390.04 | ₹198.17 | ₹75.70 | ₹5.09 |
| Change in Assets | -₹239.33 | -₹247.25 | -₹2.36 | -₹100.91 |
| Change in Liabilities | -₹180.43 | ₹95.48 | ₹57.42 | ₹53.72 |
| Change in WC | -₹419.76 | -₹151.78 | ₹55.06 | -₹47.19 |
| Cash flow from Operations | -₹146.27 | ₹13.42 | ₹116.36 | -₹44.26 |
| Cash flow from Investing | -₹823.11 | -₹85.24 | -₹3.69 | -₹43.61 |
| Cash flow from Financing | ₹1,006.83 | -₹3.30 | -₹21.88 | ₹87.98 |
| Total Cash Flow | ₹37.45 | -₹75.12 | ₹90.79 | ₹0.12 |
| Cash (Start of the year) | ₹36.71 | ₹111.82 | ₹21.04 | ₹20.93 |
| Cash (End of the year) | ₹74.15 | ₹36.71 | ₹111.82 | ₹21.05 |
| Particulars | Mar 2025 | Mar 2024 | Mar 2023 | Mar 2022 |
|---|---|---|---|---|
| Non-Current Assets | ₹445.04 | ₹132.16 | ₹97.16 | ₹93.90 |
| Current Assets | ₹1,603.99 | ₹618.34 | ₹376.54 | ₹275.06 |
| Total Assets | ₹2,049.02 | ₹750.50 | ₹473.70 | ₹368.96 |
| Current Liabilities | ₹243.97 | ₹269.91 | ₹140.15 | ₹71.96 |
| Net Current Asset | ₹1,360.02 | ₹348.44 | ₹236.39 | ₹203.09 |
| Non-Current Liabilities | ₹69.14 | ₹14.30 | ₹3.26 | ₹7.10 |
| Equity Capital | ₹1,735.91 | ₹466.29 | ₹330.28 | ₹289.90 |
| Total Equity & Liabilities | ₹2,049.02 | ₹750.50 | ₹473.70 | ₹368.96 |
| Particulars | Mar 2025 | Mar 2024 | Mar 2023 | Mar 2022 |
|---|---|---|---|---|
| Revenue | ₹930.67 | ₹430.28 | ₹161.44 | ₹53.71 |
| Other Income | ₹57.78 | ₹13.93 | ₹7.05 | ₹5.28 |
| Total Revenue | ₹988.45 | ₹444.21 | ₹168.49 | ₹58.99 |
| Total Expenses | ₹636.46 | ₹262.20 | ₹116.56 | ₹56.84 |
| Profit Before Tax | ₹351.99 | ₹184.41 | ₹53.93 | ₹1.86 |
| Tax | ₹89.04 | ₹55.18 | ₹16.29 | -₹0.16 |
| Profit After Tax | ₹262.95 | ₹129.23 | ₹37.64 | ₹2.02 |
| EPS - Basic | ₹30.09 | ₹15.61 | ₹4.75 | ₹0.25 |
| EPS - Diluted | ₹30.09 | ₹15.51 | ₹4.75 | ₹0.25 |
| Particulars | Mar 2025 | Mar 2024 | Mar 2023 | Mar 2022 |
|---|---|---|---|---|
| Profit before tax | ₹351.99 | ₹184.41 | ₹53.93 | ₹1.86 |
| Income before WC changes | ₹329.89 | ₹193.92 | ₹54.12 | ₹2.67 |
| Change in Assets | -₹248.76 | -₹269.58 | -₹13.63 | -₹89.90 |
| Change in Liabilities | -₹128.99 | ₹129.08 | ₹67.49 | ₹44.66 |
| Change in WC | -₹377.76 | -₹140.49 | ₹53.87 | -₹45.24 |
| Cash flow from Operations | -₹146.28 | ₹21.35 | ₹99.28 | -₹43.81 |
| Cash flow from Investing | -₹862.41 | -₹81.98 | -₹2.69 | -₹43.16 |
| Cash flow from Financing | ₹1,016.87 | -₹6.21 | -₹18.40 | ₹87.31 |
| Total Cash Flow | ₹8.17 | -₹66.84 | ₹78.20 | ₹0.34 |
| Cash (Start of the year) | ₹26.06 | ₹92.90 | ₹14.70 | ₹14.37 |
| Cash (End of the year) | ₹34.24 | ₹26.06 | ₹92.90 | ₹14.70 |
| Particulars | Mar 2025 | Mar 2024 | Mar 2023 | Mar 2022 |
|---|---|---|---|---|
| Non-Current Assets | ₹532.42 | ₹142.74 | ₹155.23 | ₹107.59 |
| Current Assets | ₹1,343.06 | ₹575.66 | ₹291.22 | ₹250.26 |
| Total Assets | ₹1,875.48 | ₹718.39 | ₹446.45 | ₹357.85 |
| Current Liabilities | ₹141.01 | ₹254.83 | ₹124.87 | ₹61.22 |
| Net Current Asset | ₹1,202.04 | ₹320.83 | ₹166.35 | ₹189.04 |
| Non-Current Liabilities | ₹45.48 | ₹10.44 | ₹2.39 | ₹4.93 |
| Equity Capital | ₹1,688.99 | ₹453.13 | ₹319.19 | ₹291.70 |
| Total Equity & Liabilities | ₹1,875.48 | ₹718.39 | ₹446.45 | ₹357.85 |
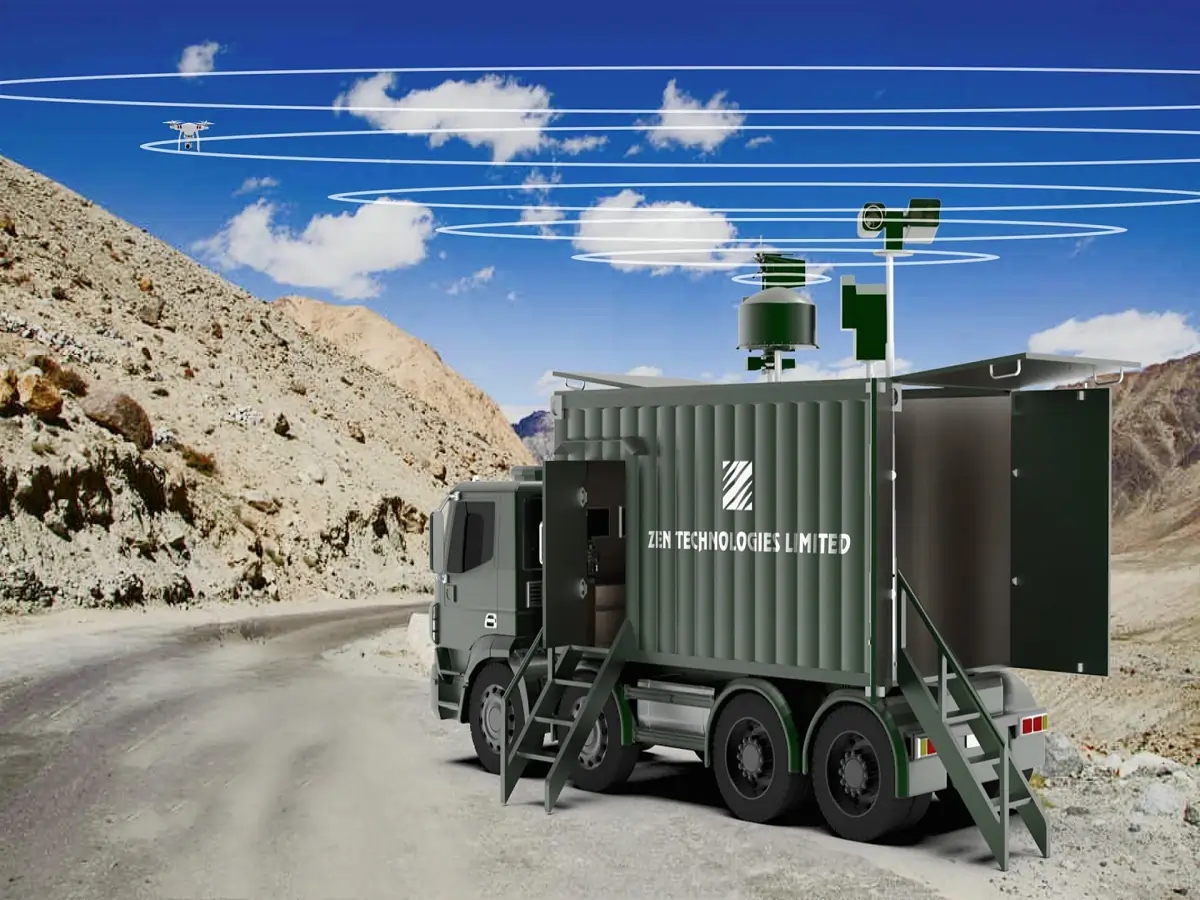
Zen Technologies Limited is a company that specialises in the design, development and manufacturing of defence training systems utilising sensor and simulator technology. Its product range comprises land-based military training simulators, driving simulators, live range equipment and anti-drone systems.
Established in 1996, the company is known for innovation and plays a vital role in meeting the needs of the Indian Army, state police and joint forces. Zen Technologies was among the first companies in India to introduce PC-based visual simulation technology for small arms training simulators into the commercial market.
Based in Hyderabad, it has served more than 100 institutional customers, including the Ministry of Defence, thus significantly contributing to the advancement of the nation's defence capabilities.
In FY21, the company acquired 100% of the shareholding of Zen Medical Technologies Private Limited. Consequently, Zen Medical Technologies Private Limited became a wholly-owned subsidiary of the company. During the same fiscal, the company introduced the anti-drone system and established a branch office in Abu Dhabi, UAE, to explore various business opportunities. It also diversified into the medical devices business. The company launched the Advanced Warfare Weapons Simulator (AweSim) in 2021-22.
The market capitalisation of Zen Technologies as of January 29, 2024, is over ₹6,400 crore. Zen Technologies has increased by over 750% inthe last three years.
With a team of experts, its R&D efforts and employing state-of-the-art cutting-edge technology, Zen Technologies has received recognition from the Ministry of Science and Technology, Government of India. The company has applied for over 130 patents and has exported over 1,000 training systems worldwide.
The company's manufacturing unit is situated at Maheswaram Mandal in Telangana. It has supplied over 170 simulators to more than 70 customers across India. Its customers span the entire country with main clients including defence services, state police forces and paramilitary forces. The company also exports its products to Nigeria, Qatar, Malaysia, UAE, Kenya and Egypt.
Zen Technologies runs a demo centre-cum-factory, located near the Shamshabad Airport, which has a built-up area of about 15,000 square feet. This facility enables the company to showcase its products to the world. The company also operates an Artificial Intelligence (AI) centre, situated in the Hi-tech City of Hyderabad. At this centre, the company has collaborated with the University of Hyderabad to explore the capabilities of AI.
The company's product line includes the Small Arms Training Simulator (Zen SATS SL), Hand Grenade Simulator (Zen HE36S), Advanced Weapons Simulator (Zen AWeSim), Tactical Engagement Simulator (Zen TacSim), 81mm Mortar Simulator, Driving Training Simulator (Zen DTS), Zen Bus Simulator, BMP II Driving Simulator (ZEN BMP-II DS) and Anti-Tank Guided Missile Simulator (Zen ATGM Sim).
– Zen Technologies revenue for FY23 was ₹281.84 crore as against ₹69.75 crore during FY22. –The net profit reported was ₹49.97 crore in FY23 as against ₹2.61 crore in the previous financial year. – The company’s earnings per share for FY23 was at ₹5.39 as against ₹0.25 in FY22.
ZEN TECHNOLOGIES share price is ₹1,746.70 as on 03 Jul, 2026, 15:59 IST.
In the last 1 year, ZEN TECHNOLOGIES delivered a return of -9.28%. The ZEN TECHNOLOGIES share price hit a high of ₹2,024.00 and low of ₹1,223.00.
The Mutual Fund Shareholding in ZEN TECHNOLOGIES was 6.72% at the end of Mar 2026.
The 52-week high and low of ZEN TECHNOLOGIES share is ₹2,024.00 and ₹1,223.00 as of 03 Jul, 2026.
The market capitalisation of ZEN TECHNOLOGIES is ₹16,002.20 Crores as on 03 Jul, 2026.
The stock symbol of ZEN TECHNOLOGIES is ZENTEC on the NSE, 533339 on the BSE, and the ISIN is INE251B01027.
ZEN TECHNOLOGIES shares closed yesterday at ₹1,773.20 on NSE & ₹1,772.30 on BSE
To buy ZEN TECHNOLOGIES shares, open a demat account with Upstox and complete the KYC process. Once your account is set up, search for the stock and place your order.
No, shares of ZEN TECHNOLOGIES or any other publicly traded company cannot be bought or sold on holidays when the stock exchanges are closed. You can only buy or sell ZEN TECHNOLOGIES shares on days when the stock exchanges are open for trading. It's important to check the NSE & BSE holidays calendar, before placing any trades to avoid any inconvenience.
The PE and PB ratio of ZEN TECHNOLOGIES is 73.42 and 8.47 respectively, as on 03 Jul, 2026, 15:59 IST.