As of 4 Jul 2026, Paras Defence share price is ₹1,294.00. The stock opened at ₹1,343.80, compared to its previous close of ₹1,343.80. During today's trading session, Paras Defence share price moved in the range of ₹1,285.00 to ₹1,346.00, with an average price of ₹1,315.50 for the day. Looking at its last 52-week, the stock has touched a low of ₹580.50 and a high of ₹1,443.00. On the performance front, Paras Defence share price has increased by 89.25% over the last six months and is up 52.45% on a year-on-year basis.
| Name | Mkt Cap Cr | P/E | P/B | ROE | D/E | ROCE | Book Value | Div. Yield | Turnover | EPS(TTM) |
|---|---|---|---|---|---|---|---|---|---|---|
| BEL | 3,03,502.00 | 50.08 | 12.65 | 25.27% | 0.00 | 33.35% | 32.42 | 0.60% | 1.10 | 8.27 |
| HAL | 2,96,515.00 | 32.53 | 7.22 | 22.21% | 0.00 | 14.09% | 611.01 | 0.79% | 0.38 | 135.71 |
| Solar Industries (India) | 1,68,695.00 | 97.14 | 26.87 | 26.72% | 0.04 | 29.10% | 467.10 | 0.06% | 1.21 | 135.01 |
| MAZAGON DOCK SHIPBUIL LTD | 1,03,029.00 | 39.96 | 10.56 | 26.48% | 0.00 | 32.01% | 219.23 | 0.71% | 1.24 | 60.38 |
| Bharat Dynamics | 50,746.90 | 120.70 | 11.97 | 9.91% | 0.00 | 7.22% | 115.70 | 0.35% | 0.31 | 11.47 |
| Cochin Shipyard | 39,967.20 | 55.77 | 6.81 | 12.20% | 0.27 | 14.45% | 223.99 | 0.10% | 0.66 | 24.44 |
| Garden Reach Ship & Eng | 31,749.20 | 42.45 | 12.09 | 28.48% | 0.01 | 38.21% | 229.25 | 0.71% | 2.52 | 65.29 |
| ITI | 28,885.10 | 98.65 | 15.16 | -8.20% | 0.41 | 1.44% | 19.23 | 0.00% | 1.07 | 3.04 |
| Data Patterns India | 26,056.30 | 96.02 | 15.01 | 15.63% | 0.00 | 21.41% | 310.08 | 0.21% | 0.52 | 48.47 |
| MTAR Technologies | 22,768.10 | 242.13 | 27.68 | 11.43% | 0.46 | 12.93% | 268.43 | 0.00% | 0.85 | 30.99 |
| Particulars | Mar 2025 | Mar 2024 | Mar 2023 | Mar 2022 |
|---|---|---|---|---|
| Revenue | ₹364.66 | ₹253.50 | ₹222.43 | ₹182.56 |
| Other Income | ₹7.92 | ₹8.27 | ₹8.22 | ₹2.97 |
| Total Revenue | ₹372.58 | ₹261.77 | ₹230.65 | ₹185.53 |
| Total Expenses | ₹289.01 | ₹221.24 | ₹183.67 | ₹148.96 |
| Profit Before Tax | ₹83.60 | ₹40.47 | ₹46.85 | ₹36.57 |
| Tax | ₹22.11 | ₹10.43 | ₹10.90 | ₹9.50 |
| Profit After Tax | ₹61.49 | ₹30.04 | ₹35.94 | ₹27.08 |
| EPS - Basic | ₹16.02 | ₹8.22 | ₹9.25 | ₹7.78 |
| EPS - Diluted | ₹16.02 | ₹8.22 | ₹9.25 | ₹7.78 |
| Particulars | Mar 2025 | Mar 2024 | Mar 2023 | Mar 2022 |
|---|---|---|---|---|
| Profit before tax | ₹83.60 | ₹40.47 | ₹46.85 | ₹36.57 |
| Income before WC changes | ₹104.89 | ₹58.81 | ₹60.08 | ₹57.48 |
| Change in Assets | -₹97.54 | -₹130.00 | -₹45.45 | -₹34.83 |
| Change in Liabilities | ₹55.83 | ₹37.29 | ₹40.58 | ₹0.66 |
| Change in WC | -₹41.71 | -₹92.71 | -₹4.87 | -₹34.16 |
| Cash flow from Operations | ₹44.83 | -₹45.54 | ₹45.73 | ₹11.51 |
| Cash flow from Investing | -₹87.00 | -₹1.69 | ₹9.63 | -₹77.11 |
| Cash flow from Financing | ₹73.66 | ₹33.10 | -₹40.69 | ₹63.10 |
| Total Cash Flow | ₹31.50 | -₹14.12 | ₹14.67 | -₹2.50 |
| Cash (Start of the year) | ₹2.98 | ₹17.11 | ₹2.18 | ₹4.68 |
| Cash (End of the year) | ₹34.47 | ₹2.98 | ₹17.11 | ₹2.18 |
| Particulars | Mar 2025 | Mar 2024 | Mar 2023 | Mar 2022 |
|---|---|---|---|---|
| Non-Current Assets | ₹253.52 | ₹238.70 | ₹205.46 | ₹160.26 |
| Current Assets | ₹598.43 | ₹401.03 | ₹315.08 | ₹297.41 |
| Total Assets | ₹851.96 | ₹639.73 | ₹520.54 | ₹457.68 |
| Current Liabilities | ₹191.01 | ₹170.73 | ₹82.95 | ₹56.47 |
| Net Current Asset | ₹407.42 | ₹230.30 | ₹232.13 | ₹240.95 |
| Non-Current Liabilities | ₹24.33 | ₹25.72 | ₹24.14 | ₹22.68 |
| Equity Capital | ₹636.62 | ₹443.28 | ₹413.45 | ₹378.53 |
| Total Equity & Liabilities | ₹851.96 | ₹639.73 | ₹520.54 | ₹457.68 |
| Particulars | Mar 2025 | Mar 2024 | Mar 2023 | Mar 2022 |
|---|---|---|---|---|
| Revenue | ₹333.85 | ₹232.43 | ₹214.28 | ₹180.00 |
| Other Income | ₹11.86 | ₹9.34 | ₹8.33 | ₹3.01 |
| Total Revenue | ₹345.71 | ₹241.77 | ₹222.61 | ₹183.01 |
| Total Expenses | ₹258.90 | ₹197.15 | ₹175.89 | ₹146.62 |
| Profit Before Tax | ₹86.81 | ₹44.62 | ₹46.73 | ₹36.39 |
| Tax | ₹21.74 | ₹10.39 | ₹10.80 | ₹9.48 |
| Profit After Tax | ₹65.07 | ₹34.24 | ₹35.93 | ₹26.91 |
| EPS - Basic | ₹16.42 | ₹8.77 | ₹9.21 | ₹7.73 |
| EPS - Diluted | ₹16.42 | ₹8.77 | ₹9.21 | ₹7.73 |
| Particulars | Mar 2025 | Mar 2024 | Mar 2023 | Mar 2022 |
|---|---|---|---|---|
| Profit before tax | ₹86.81 | ₹44.62 | ₹46.73 | ₹36.39 |
| Income before WC changes | ₹101.71 | ₹58.69 | ₹58.74 | ₹57.06 |
| Change in Assets | -₹110.47 | -₹99.76 | -₹39.53 | -₹33.08 |
| Change in Liabilities | ₹55.52 | ₹35.33 | ₹39.68 | ₹0.57 |
| Change in WC | -₹54.95 | -₹64.44 | ₹0.16 | -₹32.51 |
| Cash flow from Operations | ₹28.56 | -₹17.21 | ₹49.48 | ₹12.77 |
| Cash flow from Investing | -₹78.14 | -₹19.96 | ₹9.54 | -₹77.48 |
| Cash flow from Financing | ₹78.02 | ₹23.06 | -₹45.08 | ₹62.35 |
| Total Cash Flow | ₹28.45 | -₹14.12 | ₹13.93 | -₹2.36 |
| Cash (Start of the year) | ₹1.47 | ₹15.59 | ₹1.66 | ₹4.02 |
| Cash (End of the year) | ₹29.91 | ₹1.47 | ₹15.59 | ₹1.66 |
| Particulars | Mar 2025 | Mar 2024 | Mar 2023 | Mar 2022 |
|---|---|---|---|---|
| Non-Current Assets | ₹256.89 | ₹229.60 | ₹200.39 | ₹160.65 |
| Current Assets | ₹574.08 | ₹378.31 | ₹302.81 | ₹293.84 |
| Total Assets | ₹830.97 | ₹607.91 | ₹503.19 | ₹454.49 |
| Current Liabilities | ₹164.11 | ₹136.72 | ₹66.89 | ₹54.19 |
| Net Current Asset | ₹409.97 | ₹241.59 | ₹235.92 | ₹239.65 |
| Non-Current Liabilities | ₹23.39 | ₹24.54 | ₹23.17 | ₹22.68 |
| Equity Capital | ₹643.47 | ₹446.65 | ₹413.13 | ₹377.62 |
| Total Equity & Liabilities | ₹830.97 | ₹607.91 | ₹503.19 | ₹454.49 |
Paras Defence and Space Technologies Limited is an Indian aerospace and defence company. It was founded in 2009 as Paras FlowForm Engineering Limited. Its name was changed to Paras Defence and Space Technologies Limited in 2015. The company engages in the design, development, manufacturing, testing and commissioning of products, systems and solutions for defence and space applications.
Paras Defence is the only Indian private company in the entire Asia-Pacific region capable of constructing a turnkey optronic periscope designed for submarine applications. It is also the only Indian company to achieve the successful development of a fully functional remote-controlled border defence system. The company completed the firing trials in November 2022.
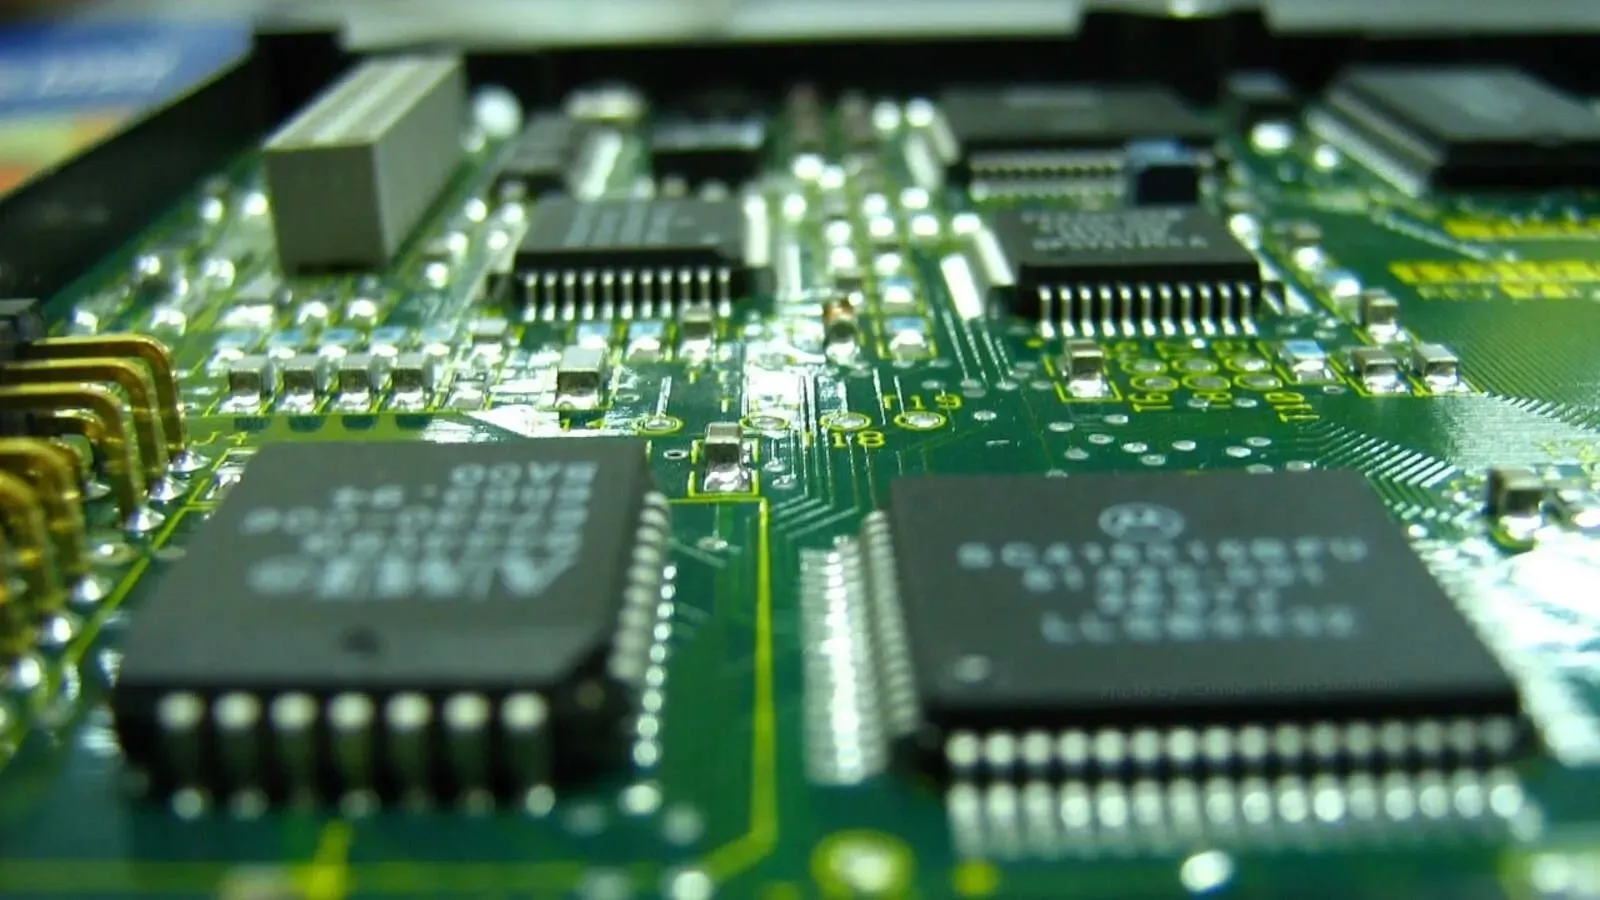
It is actively engaged in the development of full cameras for defence and space applications.
The market capitalisation of Paras Defence and Space Technologies Limited is close to ₹3,000 crores as of January 16, 2024. Paras Defence share price has gained over 30% in the last one year.
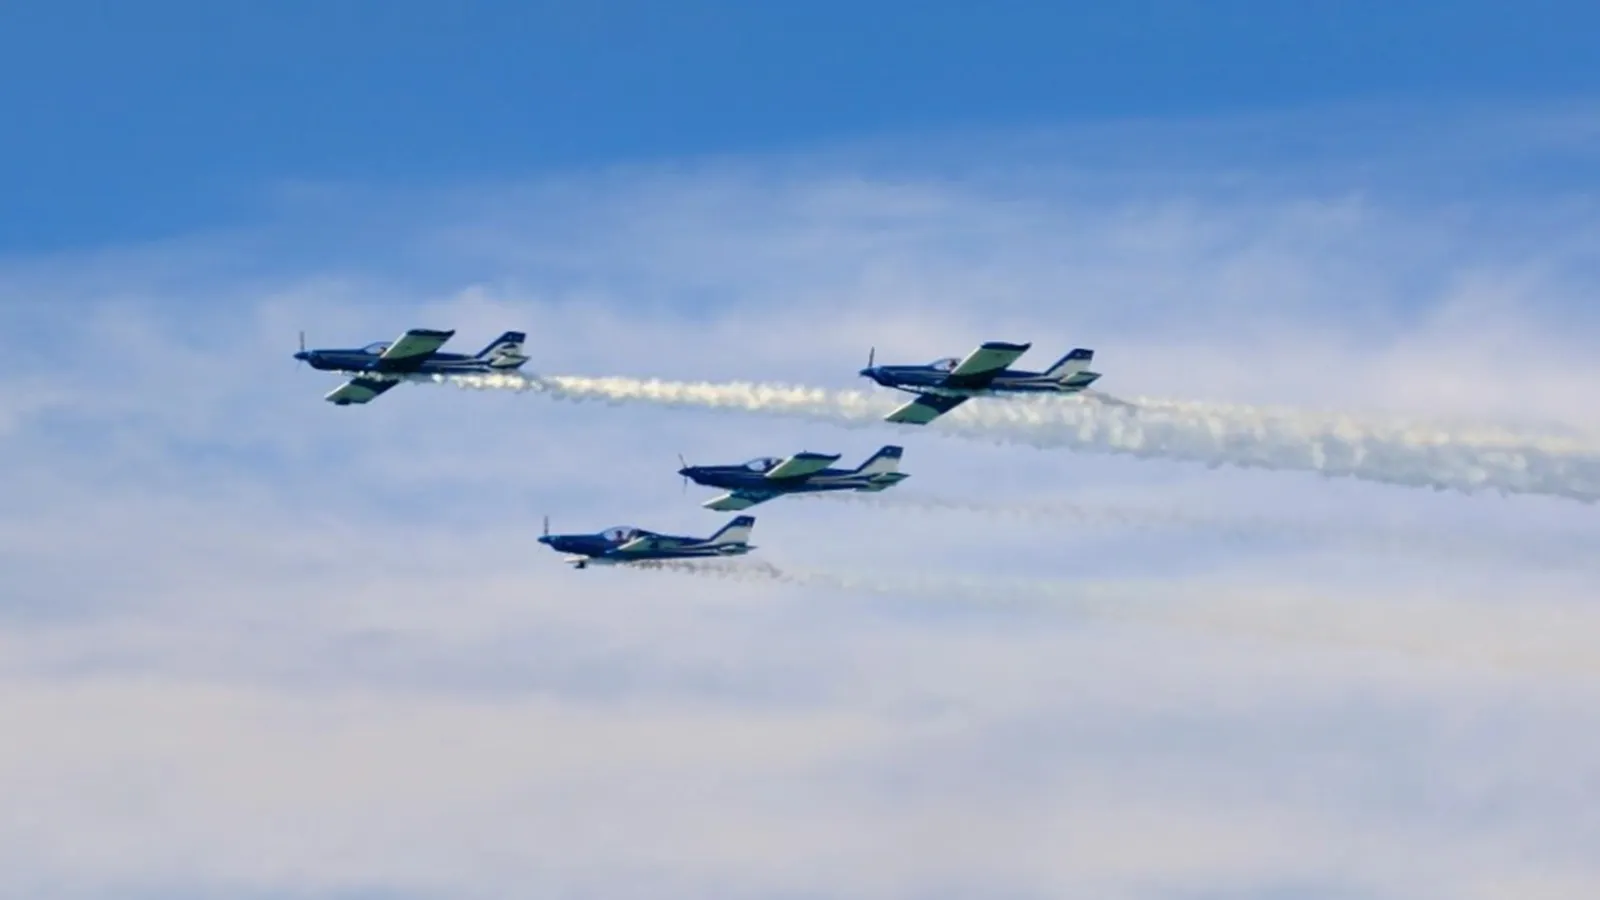
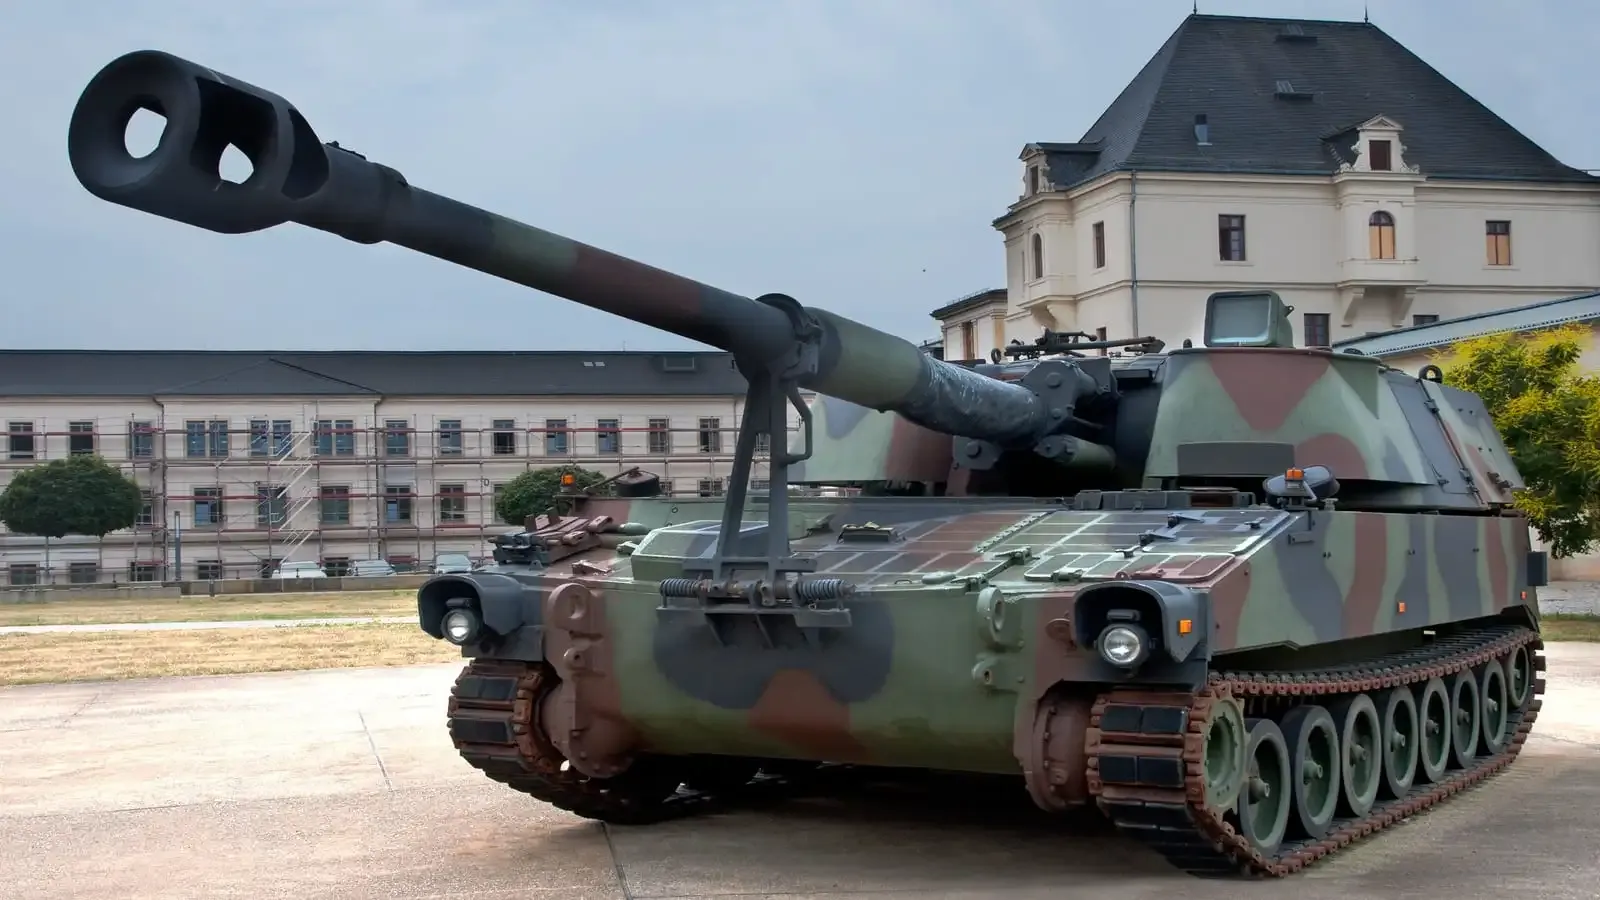
Paras Defence has five verticals in its business namely defence and space optics, defence electronics, heavy engineering, electromagnetic pulse protection solutions and niche technologies. It is involved in technologies for rockets and missiles, space and space research, naval systems, land and armoured vehicles, electronic warfare and surveillance, as well as electromagnetic shielding.
The company primarily caters to government organisations including the Defence Research and Development Organisation (DRDO), the Indian Space Research Organisation (ISRO), Defence Public Sector Undertakings (DPSUs), shipyards and ordnance factories. It also serves publicly listed corporations such as Tata, L&T and Solar. It also extends its services to numerous private and international firms operating within the defence and space industries.
Paras Defence conducts business operations with a focus on manufacturing, research and development (R&D), after-sales support and international exports. In terms of manufacturing, the company operates facilities in Navi Mumbai and Ambernath.
The company has R&D centres located in Navi Mumbai, Bengaluru and Ahmedabad. To ensure customer satisfaction and ongoing support, the company provides after-sales services from multiple locations. These include Navi Mumbai, Ambernath, Bengaluru, New Delhi and Hyderabad. When it comes to international exports, Paras Defence's markets include Israel, the USA, Europe, South Korea, Singapore, the UAE, Saudi Arabia, South Africa and Canada.
Paras Defence holds a majority stake of 60% in Paras Aerospace Private Limited, a company actively engaged in drones, drone services and associated technologies. Additionally, it has a 55% ownership in Paras Anti-Drone Technologies Private Limited, which focuses on the development of radio frequency and microwave systems and sub-systems to counter unmanned aerial vehicles.
Paras Defence and Space Technologies Limited wholly owns Opel Technologies Private Limited, a company dedicated to providing solutions for efficient global sourcing. Another subsidiary, Ayatti Innovative Private Limited, has a 58% holding and specialises in the manufacturing of structural metal products, particularly for railway coaches.
Paras Defence share price is ₹1,294.00 as on 03 Jul, 2026, 15:53 IST.
In the last 1 year, Paras Defence delivered a return of 52.45%. The Paras Defence share price hit a high of ₹1,443.00 and low of ₹580.50.
The Mutual Fund Shareholding in Paras Defence was 1.10% at the end of Mar 2026.
The 52-week high and low of Paras Defence share is ₹1,443.00 and ₹580.50 as of 03 Jul, 2026.
The market capitalisation of Paras Defence is ₹10,809.60 Crores as on 03 Jul, 2026.
The stock symbol of Paras Defence is PARAS on the NSE, 543367 on the BSE, and the ISIN is INE045601023.
Paras Defence shares closed yesterday at ₹1,343.80 on NSE & ₹1,341.35 on BSE
To buy Paras Defence shares, open a demat account with Upstox and complete the KYC process. Once your account is set up, search for the stock and place your order.
No, shares of Paras Defence or any other publicly traded company cannot be bought or sold on holidays when the stock exchanges are closed. You can only buy or sell Paras Defence shares on days when the stock exchanges are open for trading. It's important to check the NSE & BSE holidays calendar, before placing any trades to avoid any inconvenience.
The PE and PB ratio of Paras Defence is 120.84 and 15.81 respectively, as on 03 Jul, 2026, 15:53 IST.