Logo

LEELA PALACES HOTEL LTD Share Price

NSE: THELEELA
|
Hotels & Restaurants
₹ 475.70
-₹0.55 (-0.12%)
1D
Last updated 03 Jul, 2026, 15:52 IST

LEELA PALACES HOTEL LTD Share Price Today

As of 5 Jul 2026, LEELA PALACES HOTEL LTD share price is ₹475.70. The stock opened at ₹476.55, compared to its previous close of ₹476.25. During today's trading session, LEELA PALACES HOTEL LTD share price moved in the range of ₹468.35 to ₹481.30, with an average price of ₹474.83 for the day. Looking at its last 52-week, the stock has touched a low of ₹384.50 and a high of ₹511.00. On the performance front, LEELA PALACES HOTEL LTD share price has increased by 6.86% over the last six months and is up 16.39% on a year-on-year basis.


₹468.35
0.12% down today
₹481.30
1D LOW
1D HIGH

LEELA PALACES HOTEL LTD Returns Calculator

Open
₹476.55
High
₹481.30
Low
₹468.35
Prev. close
₹476.25

Circuit
L
H
₹428.15
₹523.25
52-week
L
H
₹384.50
₹511.00

LEELA PALACES HOTEL LTD Shareholder Returns

LEELA PALACES HOTEL LTD Share Price History

Mkt Cap Cr
15,864.70

P/E
39.36

P/B
2.48

ROE
6.30%

D/E
0.04

ROCE
8.41%

Div. Yield
0.00%

EPS(TTM)
8.51
Turnover
0.05

EV/EBITDA
21.82

Net Margin
0.00%

Op. Margin
0.00%

ROA
4.52%

Quick Ratio
0.00

Curr. Ratio
4.36
Based on fundamentals, this stock's
Step 5 of 5
Performance
Excellent
Leela Palaces Hotels outperforming all market indices
Step 1 of 5
Valuation
Overvalued
Leela Palaces Hotels appears overvalued compared to its peers
Step 5 of 5
Earnings
Excellent
Leela Palaces Hotels revenue, operating profit and net profit are growing
Peer Comparison
Peer comparison — key ratios
NameMkt Cap CrP/EP/BROED/EROCEBook ValueDiv. YieldTurnoverEPS(TTM)
The Indian Hotels Co.1,02,537.0038.996.2214.93%0.1018.61%6.360.57%0.3814.13
ITC HOTELS LIMITED36,868.7044.923.167.01%0.019.58%57.090.56%0.283.98
EIH Limited20,393.1031.033.8813.68%0.0319.82%74.980.46%0.528.61
Chalet Hotels18,329.8028.424.9617.45%0.5616.03%171.430.24%0.4430.43
VENTIVE HOSPITALITY LTD14,736.5029.362.687.73%0.1811.70%202.350.00%0.119.80
Lemon Tree Hotels9,419.8132.666.7716.32%0.2415.49%17.260.00%0.271.37
India Tourism Development Corp5,078.4161.6812.0119.57%0.0026.15%53.820.50%1.129.80
Mahindra Holidays4,788.7365.57-16.34-21.12%3.294.10%20.830.00%0.200.23
JUNIPER HOTELS LIMITED4,443.3731.401.556.05%0.388.16%127.910.00%0.246.60
SAMHI HOTELS LIMITED3,911.796.911.7918.37%0.088.29%146.300.00%0.0417.37

LEELA PALACES HOTEL LTD Financials

Full statement

Income Statement · Consolidated

Income Statement · Consolidated — all values in INR Crore
ParticularsMar 2025Mar 2024Mar 2023
Revenue₹1,300.57₹1,171.45₹860.06
Other Income₹105.98₹55.05₹43.21
Total Revenue₹1,406.56₹1,226.50₹903.27
Total Expenses₹1,304.30₹1,207.07₹963.83
Profit Before Tax₹102.07₹19.43-₹60.56
Tax₹54.41₹21.56₹1.12
Profit After Tax₹47.66-₹2.13-₹61.68
EPS - Basic₹1.97-₹0.12-₹3.50
EPS - Diluted₹1.97-₹0.12-₹3.50

Cash Flow · Consolidated

Cash Flow · Consolidated — all values in INR Crore
ParticularsMar 2025Mar 2024Mar 2023
Profit before tax₹102.07₹19.43-₹60.56
Income before WC changes₹619.45₹583.90₹420.22
Change in Assets-₹65.49-₹21.00-₹114.16
Change in Liabilities₹9.43₹5.21₹23.17
Change in WC-₹56.06-₹15.79-₹90.99
Cash flow from Operations₹552.88₹538.78₹318.32
Cash flow from Investing-₹5,729.73-₹786.01-₹84.67
Cash flow from Financing₹5,235.89₹146.99-₹317.77
Total Cash Flow₹59.03-₹100.23-₹84.13
Cash (Start of the year)₹70.98₹171.21₹255.33
Cash (End of the year)₹130.01₹70.98₹171.21

Balance Sheet · Consolidated

Balance Sheet · Consolidated — all values in INR Crore
ParticularsMar 2025Mar 2024Mar 2023
Non-Current Assets₹7,724.94₹6,528.72₹5,483.67
Current Assets₹541.22₹533.16₹391.87
Total Assets₹8,266.16₹7,061.88₹5,875.54
Current Liabilities₹525.53₹5,503.79₹289.49
Net Current Asset₹15.69-₹4,970.63₹102.37
Non-Current Liabilities₹4,135.64₹4,383.82₹8,098.01
Equity Capital₹3,604.99-₹2,825.72-₹2,511.96
Total Equity & Liabilities₹8,266.16₹7,061.88₹5,875.54

Income Statement · Standalone

Income Statement · Standalone — all values in INR Crore
ParticularsMar 2025Mar 2024Mar 2023Mar 2022
Revenue₹375.11₹322.44₹281.92₹114.60
Other Income₹99.06₹29.45₹27.42₹3.14
Total Revenue₹474.17₹351.90₹309.34₹117.74
Total Expenses₹416.38₹364.75₹334.59₹271.71
Profit Before Tax₹57.80-₹12.85-₹25.25-₹153.97
Tax₹23.56₹0.00₹0.00₹0.00
Profit After Tax₹34.24-₹12.85-₹25.25-₹153.97
EPS - Basic₹1.41-₹3.65-₹7.17-₹76.53
EPS - Diluted₹1.41-₹3.65-₹7.17-₹76.53

Cash Flow · Standalone

Cash Flow · Standalone — all values in INR Crore
ParticularsMar 2025Mar 2024Mar 2023Mar 2022
Profit before tax₹57.80-₹12.85-₹25.25-₹153.97
Income before WC changes₹199.67₹175.44₹156.19₹18.55
Change in Assets-₹71.22-₹1.21-₹9.23-₹7.31
Change in Liabilities₹6.70₹6.83₹8.88-₹7.87
Change in WC-₹64.53₹5.63-₹0.35-₹15.18
Cash flow from Operations₹132.82₹177.43₹154.35₹1.79
Cash flow from Investing-₹5,956.15-₹138.19-₹39.81-₹145.49
Cash flow from Financing₹5,853.14-₹70.37-₹123.99₹192.92
Total Cash Flow₹29.82-₹31.14-₹9.44₹49.22
Cash (Start of the year)₹9.79₹40.93₹50.38₹1.16
Cash (End of the year)₹39.61₹9.79₹40.93₹50.38

Balance Sheet · Standalone

Balance Sheet · Standalone — all values in INR Crore
ParticularsMar 2025Mar 2024Mar 2023Mar 2022
Non-Current Assets₹7,632.53₹1,789.14₹1,710.45₹1,421.83
Current Assets₹381.33₹97.91₹82.00₹73.34
Total Assets₹8,013.86₹1,887.05₹1,792.45₹1,495.16
Current Liabilities₹168.63₹312.62₹209.89₹173.99
Net Current Asset₹212.70-₹214.71-₹127.89-₹100.65
Non-Current Liabilities₹1,502.45₹1,599.32₹1,603.67₹1,495.51
Equity Capital₹6,342.78-₹24.89-₹21.11-₹174.33
Total Equity & Liabilities₹8,013.86₹1,887.05₹1,792.45₹1,495.16
* All values are in INR Crore
Qty
Bid
956
475.7
0
0
0
0
0
0
0
0
Ask
Qty
0
0
0
0
0
0
0
0
0
0
Bid Total: 956
Ask Total: 0
Buy orders: 100%
Sell orders: 0%
Bearish
1
Neutral
4
Bullish
3
Slightly Bullish
by SEBI experts
Expert Pick
EXPPICK
Stop-loss
Entry price
Target
Indicator
Value
Verdict

RSI (14)
62.42
Neutral

ATR (14)
20.26
Neutral

STOCH(9,6)
17.23
Bullish

STOCH RSI (14)
0
Bullish

ADX(9)
44.62
Bearish

UO(9)
40.94
Neutral

ROC(12)
3.89
Bullish

WillR(14)
-45.26
Neutral
Period
Simple value
Exponential vaue

5D
477.35
477.54

10D
483.39
474.52

20D
457.56
462.39

50D
434.11
443.39

100D
431.57
434.61

About LEELA PALACES HOTEL LTD

LEELA PALACES HOTEL LTD logo
ISIN
INE0AQ201015
Sector Market Cap
₹ 15,864.7 Cr

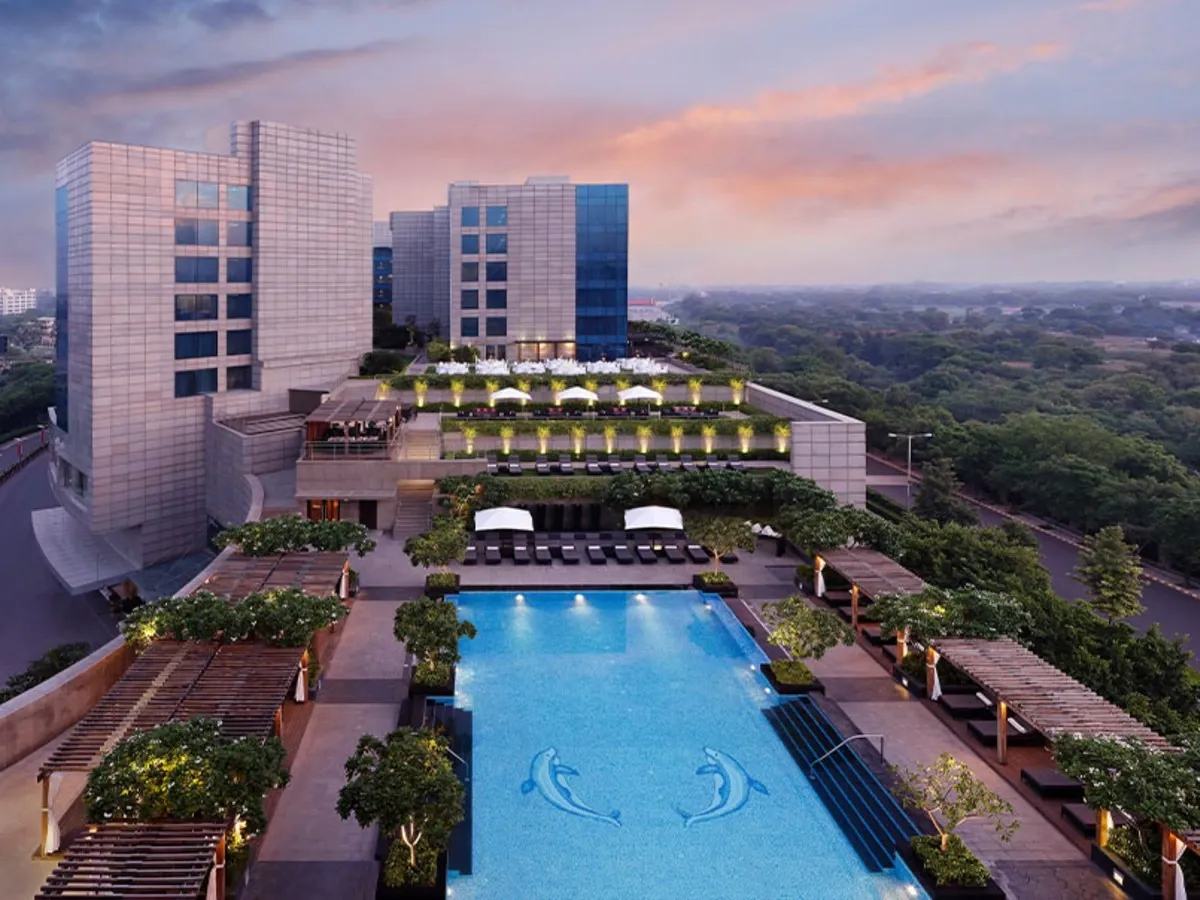
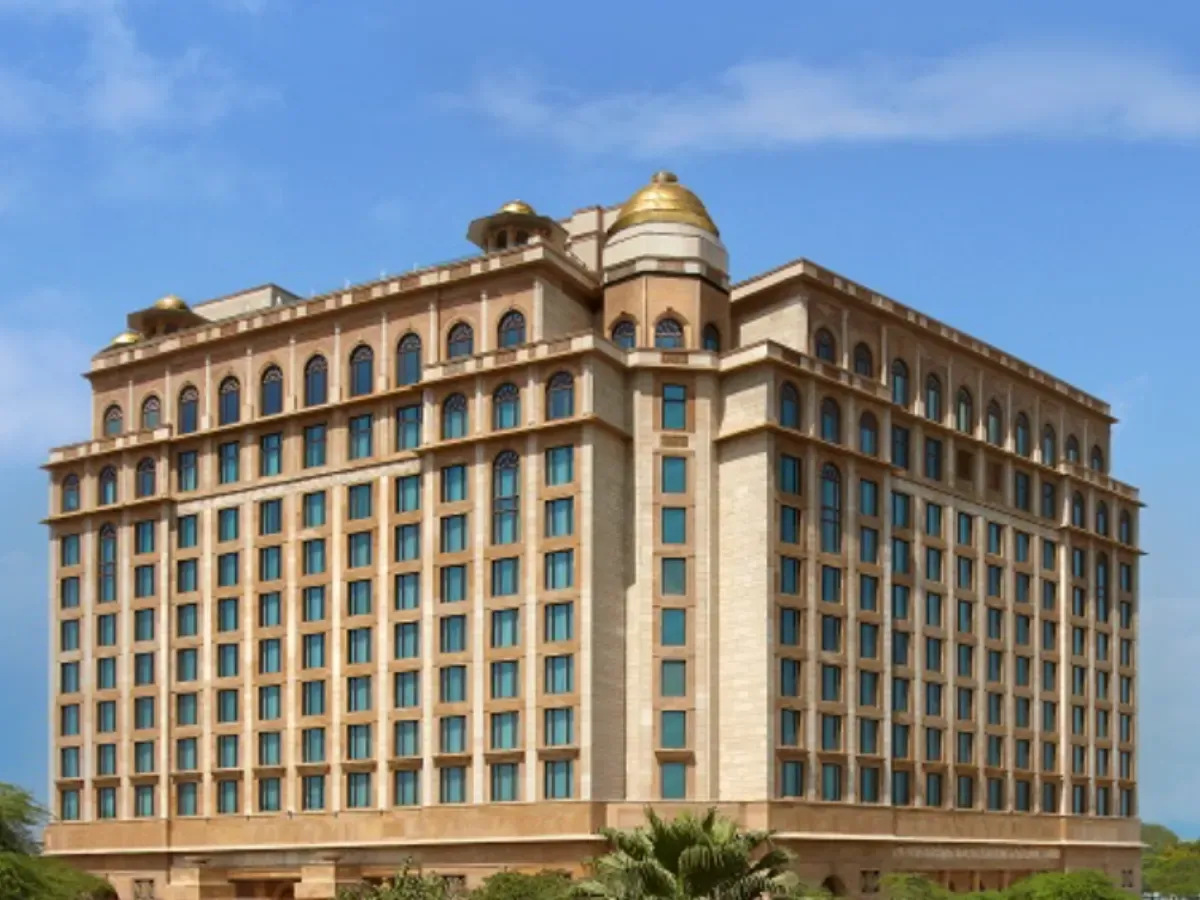
Leela Palaces Hotels & Resorts Limited, formerly Schloss Bangalore Limited, is a luxury hospitality company. It owns, operates, manages and develops luxury hotels and resorts under The Leela brand. Its portfolio includes The Leela Palaces, The Leela Hotels and The Leela Resorts. It undertakes business through direct ownership of hotels and hotel management agreements with third-party hotel owners. Its portfolio includes 3,553 keys across 13 operational hotels, comprising five-owned hotels, seven hotels that are managed by it pursuant to hotel management agreements and one hotel which is owned and operated by a third-party owner under a franchise arrangement with it. Its modern palace hotels are in Bengaluru (Karnataka), Chennai (Tamil Nadu) and New Delhi (Delhi). Its pipeline includes modern palaces, hotels and resorts, including expansion in segments: wildlife, spiritual and heritage tourism, diversifying its geographical footprint across additional cities and tourist destinations.

LEELA PALACES HOTEL LTD Financial Highlights

  • Revenue: LEELA PALACES HOTEL LTD reported revenue of ₹1,597.78 crore in FY26 vs ₹1,406.55 crore in FY25. It showed an increase of 13.60% on a yearly basis.
  • Operating Profit: LEELA PALACES HOTEL LTD reported an operating profit of ₹488.23 crore in FY26 vs ₹102.07 crore in FY25. It showed an increase of 378.33% on a year-on-year basis.
  • Net Profit: LEELA PALACES HOTEL LTD reported a net profit of ₹403.03 crore in FY26 vs ₹47.66 crore in FY25. It showed an increase of 745.64% on a yearly basis.

LEELA PALACES HOTEL LTD Quarterly Result Highlights

  • LEELA PALACES HOTEL LTD reported revenue of ₹492.15 crore in Mar 2026, compared with ₹470.85 crore in Dec 2025, representing an increase of 4.52% on a quarter-on-quarter (QoQ) basis.
  • LEELA PALACES HOTEL LTD reported an operating profit of ₹205.77 crore in Mar 2026, compared with ₹173.53 crore in Dec 2025, representing an increase of 18.58% on a quarter-on-quarter (QoQ) basis.
  • LEELA PALACES HOTEL LTD reported a profit of ₹171.72 crore in Mar 2026, compared with ₹147.89 crore in Dec 2025, reflecting an increase of 16.11% on a QoQ basis.
  • The earnings per share (EPS) of LEELA PALACES HOTEL LTD stood at ₹1.97 during Mar 2026.
Know more
Promoters
75.91%
FII
8.62%
Other DII
3.86%
Retail and other
4.96%
Mutual funds
6.65%
Foreign institutions - FII
Compare against other stocks
LEELA PALACES HOTEL LTD logo
LEELA PALACES HOTEL LTD
Hotels & Restaurants
Add Stock
Add Another

FAQs on LEELA PALACES HOTEL LTD Share Price