Logo

Gallantt Ispat Share Price

NSE: GALLANTT
|
Steel & Iron Products
₹ 688.75
+₹8.85 (1.30%)
1D
Last updated 03 Jul, 2026, 15:47 IST

Gallantt Ispat Share Price Today

As of 5 Jul 2026, Gallantt Ispat share price is ₹688.75. The stock opened at ₹680.00, compared to its previous close of ₹679.90. During today's trading session, Gallantt Ispat share price moved in the range of ₹680.00 to ₹709.80, with an average price of ₹694.90 for the day. Looking at its last 52-week, the stock has touched a low of ₹496.25 and a high of ₹948.00. On the performance front, Gallantt Ispat share price has increased by 24.66% over the last six months and is up 24.17% on a year-on-year basis.


₹680.00
1.30% up today
₹709.80
1D LOW
1D HIGH

Gallantt Ispat Returns Calculator

Open
₹680.00
High
₹709.80
Low
₹680.00
Prev. close
₹679.90

Circuit
L
H
₹654.35
₹723.15
52-week
L
H
₹496.25
₹948.00

Gallantt Ispat Shareholder Returns

Gallantt Ispat Share Price History

Mkt Cap Cr
16,422.80

P/E
33.91

P/B
4.95

ROE
14.60%

D/E
0.17

ROCE
16.69%

Div. Yield
0.29%

EPS(TTM)
20.07
Turnover
1.23

EV/EBITDA
21.19

Net Margin
0.00%

Op. Margin
0.00%

ROA
11.34%

Quick Ratio
0.00

Curr. Ratio
8.53
Based on fundamentals, this stock's
Step 3 of 5
Performance
Neutral
Gallantt Ispat L performance is moderate compared to markets
Step 1 of 5
Valuation
Overvalued
Gallantt Ispat L appears overvalued compared to its peers
Step 5 of 5
Earnings
Excellent
Gallantt Ispat L revenue, operating profit and net profit are growing
Peer Comparison
Peer comparison — key ratios
NameMkt Cap CrP/EP/BROED/EROCEBook ValueDiv. YieldTurnoverEPS(TTM)
JSW Steel2,99,238.0011.732.997.21%0.8310.29%350.040.72%0.8126.72
Tata Steel2,33,629.0022.172.3811.44%0.4011.37%1.392.09%0.6612.87
Jindal Steel & Power1,06,467.0031.682.097.92%0.169.16%520.840.19%0.9630.23
SAIL69,392.8020.561.156.35%0.557.76%140.891.40%1.247.83
Jindal Stainless57,091.1017.932.8816.14%0.2417.44%228.860.58%1.8634.51
Shyam Metalics and Energy26,872.0025.352.339.29%0.0513.08%230.620.28%1.0619.87
Sarda Energy & Minerals17,650.8015.912.3915.00%0.2116.80%190.510.40%0.5126.92
GODAWARI POW & ISP LTD17,234.7021.503.0113.79%0.0818.50%83.140.38%0.7614.20
Usha Martin15,302.6032.824.6314.11%0.0017.96%58.700.75%1.2412.42
VEDANTA IRON AND STEEL L16,673.900.0042.6549.39%-0.84252.94%1.000.00%0.003.66

Gallantt Ispat Financials

Full statement

Income Statement · Consolidated

Income Statement · Consolidated — all values in INR Crore
ParticularsMar 2025Mar 2024Mar 2023Mar 2021
Revenue₹4,292.73₹4,227.12₹4,056.70₹1,007.05
Other Income₹15.62₹6.85₹3.27₹2.31
Total Revenue₹4,308.34₹4,233.97₹4,059.98₹1,009.37
Total Expenses₹3,740.25₹3,922.65₹3,820.09₹921.39
Profit Before Tax₹568.09₹311.32₹239.89₹87.98
Tax₹167.35₹85.98₹98.98₹31.19
Profit After Tax₹400.74₹225.34₹140.91₹56.79
EPS - Basic₹16.61₹9.34₹5.84₹10.01
EPS - Diluted₹16.61₹9.34₹5.84₹10.01

Cash Flow · Consolidated

Cash Flow · Consolidated — all values in INR Crore
ParticularsMar 2025Mar 2024Mar 2023Mar 2021
Profit before tax₹568.09₹311.32₹239.89₹87.98
Income before WC changes₹701.59₹450.02₹362.61₹136.34
Change in Assets-₹50.12-₹56.98-₹137.13-₹41.21
Change in Liabilities₹31.83₹5.73-₹88.27₹12.25
Change in WC-₹18.29-₹51.25-₹225.41-₹28.96
Cash flow from Operations₹578.80₹344.32₹95.56₹91.73
Cash flow from Investing-₹459.90-₹248.06-₹225.07-₹74.65
Cash flow from Financing-₹113.89-₹101.57₹126.48-₹16.55
Total Cash Flow₹5.01-₹5.30-₹3.03₹0.52
Cash (Start of the year)₹0.32₹5.62₹8.65₹1.28
Cash (End of the year)₹5.33₹0.32₹5.62₹1.80

Balance Sheet · Consolidated

Balance Sheet · Consolidated — all values in INR Crore
ParticularsMar 2025Mar 2024Mar 2023Mar 2021
Non-Current Assets₹2,170.98₹2,048.69₹1,954.99₹719.58
Current Assets₹1,377.37₹1,086.84₹993.85₹210.47
Total Assets₹3,548.35₹3,135.53₹2,948.84₹930.05
Current Liabilities₹411.05₹465.67₹537.82₹172.27
Net Current Asset₹966.32₹621.18₹456.03₹38.20
Non-Current Liabilities₹294.74₹219.14₹185.99₹20.85
Equity Capital₹2,842.56₹2,450.73₹2,225.03₹736.93
Total Equity & Liabilities₹3,548.35₹3,135.53₹2,948.84₹930.05

Income Statement · Standalone

Income Statement · Standalone — all values in INR Crore
ParticularsMar 2025Mar 2024Mar 2023Mar 2022
Revenue₹4,292.73₹4,227.12₹4,056.70₹3,017.38
Other Income₹15.62₹6.85₹3.27₹53.61
Total Revenue₹4,308.34₹4,233.97₹4,059.98₹3,070.98
Total Expenses₹3,740.25₹3,922.65₹3,820.09₹2,833.68
Profit Before Tax₹568.09₹311.32₹239.89₹237.30
Tax₹167.35₹85.98₹98.98₹61.46
Profit After Tax₹400.74₹225.34₹140.91₹175.84
EPS - Basic₹16.61₹9.34₹5.84₹21.62
EPS - Diluted₹16.61₹9.34₹5.84₹21.62

Cash Flow · Standalone

Cash Flow · Standalone — all values in INR Crore
ParticularsMar 2025Mar 2024Mar 2023Mar 2022
Profit before tax₹568.09₹311.32₹239.89₹237.30
Income before WC changes₹701.59₹450.02₹362.61₹335.33
Change in Assets-₹50.12-₹56.98-₹137.13-₹125.51
Change in Liabilities₹31.83₹5.73-₹88.27₹65.60
Change in WC-₹18.29-₹51.25-₹225.41-₹59.91
Cash flow from Operations₹578.80₹344.32₹95.56₹233.96
Cash flow from Investing-₹459.90-₹248.06-₹225.07-₹208.81
Cash flow from Financing-₹113.89-₹101.57₹126.48-₹19.29
Total Cash Flow₹5.01-₹5.30-₹3.03₹5.86
Cash (Start of the year)₹0.32₹5.62₹8.65₹2.79
Cash (End of the year)₹5.33₹0.32₹5.62₹8.65

Balance Sheet · Standalone

Balance Sheet · Standalone — all values in INR Crore
ParticularsMar 2025Mar 2024Mar 2023Mar 2022
Non-Current Assets₹2,170.98₹2,048.69₹1,954.99₹1,828.85
Current Assets₹1,377.37₹1,086.84₹993.85₹860.11
Total Assets₹3,548.35₹3,135.53₹2,948.84₹2,688.96
Current Liabilities₹411.05₹465.67₹537.82₹475.33
Net Current Asset₹966.32₹621.18₹456.03₹384.78
Non-Current Liabilities₹294.74₹219.14₹185.99₹130.51
Equity Capital₹2,842.56₹2,450.73₹2,225.03₹2,083.12
Total Equity & Liabilities₹3,548.35₹3,135.53₹2,948.84₹2,688.96
* All values are in INR Crore
Qty
Bid
0
0
0
0
0
0
0
0
0
0
Ask
Qty
688.75
605
0
0
0
0
0
0
0
0
Bid Total: 0
Ask Total: 605
Buy orders: 0%
Sell orders: 100%
Bearish
1
Neutral
4
Bullish
3
Slightly Bullish
by SEBI experts
Expert Pick
EXPPICK
Stop-loss
Entry price
Target
Indicator
Value
Verdict

RSI (14)
47.9
Neutral

ATR (14)
26.2
Neutral

STOCH(9,6)
17.41
Bullish

STOCH RSI (14)
15.94
Bullish

ADX(9)
23.7
Bearish

UO(9)
32.93
Neutral

ROC(12)
1.4
Bullish

WillR(14)
-66.5
Neutral
Period
Simple value
Exponential vaue

5D
685.21
689.36

10D
704.47
693.39

20D
684.86
694.59

50D
735.76
696.99

100D
666.94
674.84

About Gallantt Ispat

Gallantt Ispat logo
ISIN
INE297H01019
Sector Market Cap
₹ 16,422.8 Cr

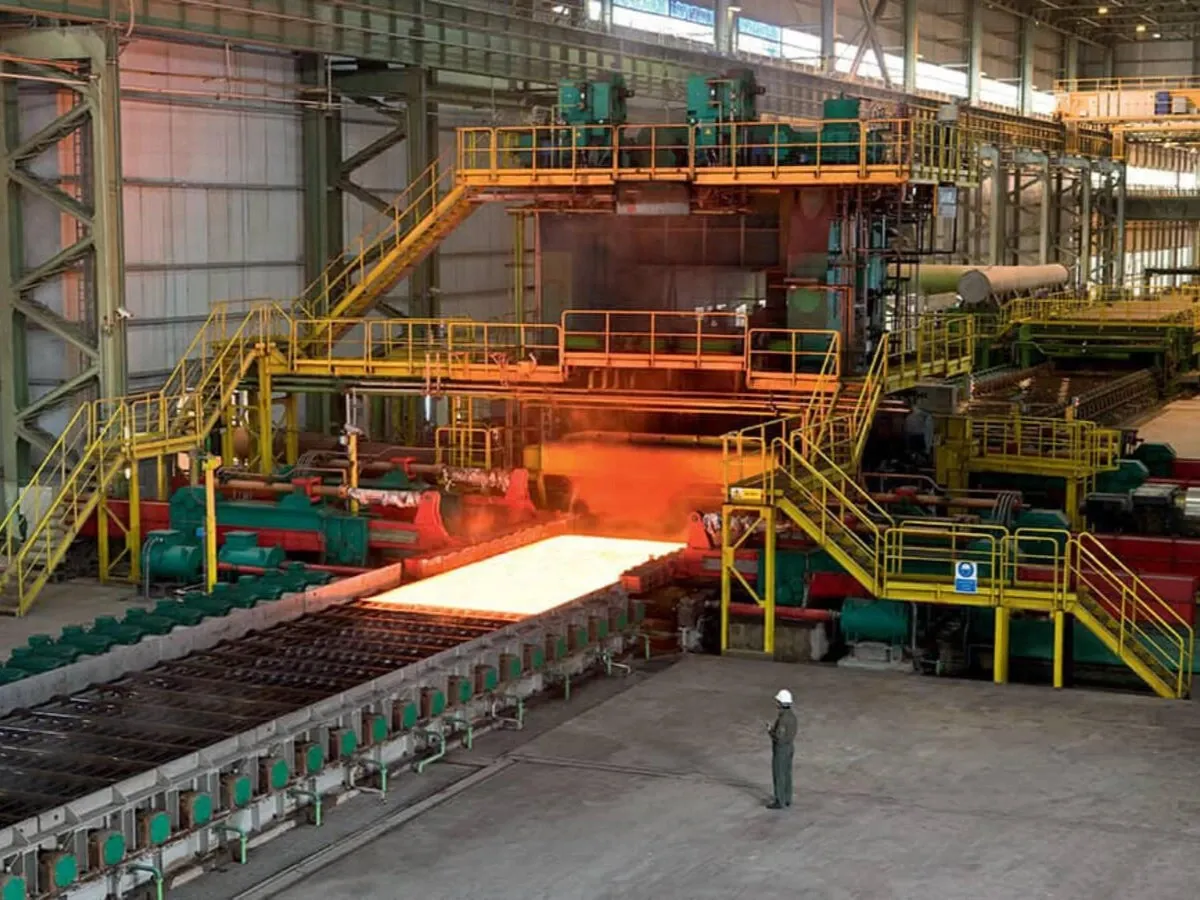
Gallantt Ispat Limited is an India-based company, which is engaged in the manufacturing of steel and steel products with power plants. It is also engaged in the business of real estate. Its customers include real estate developers, construction industries, government organizations and corporate customers. Its products are sold through a network of dealers and distributors. Also, the Company sells products directly to the bulk buyers and participates in auctions of government and non-government organizations. It manufactures pellets, sponge iron, steel melt shops, and rolling pins. Steel billets are also used in forge shops and machine shops for the production of engineering goods and also as feedstock for seamless tubes. It maintains the quality of TMT Bars, conforming to Indian standards as well as international standards. Its product portfolio for the food grain business includes wheat flour products like atta, maida, suji and bran. Its products are sold under the brand name Gallan.

Gallantt Ispat Financial Highlights

  • Revenue: Gallantt Ispat reported revenue of ₹4,478.51 crore in FY26 vs ₹4,308.35 crore in FY25. It showed an increase of 3.95% on a yearly basis.
  • Operating Profit: Gallantt Ispat reported an operating profit of ₹604.03 crore in FY26 vs ₹568.09 crore in FY25. It showed an increase of 6.33% on a year-on-year basis.
  • Net Profit: Gallantt Ispat reported a net profit of ₹484.27 crore in FY26 vs ₹400.74 crore in FY25. It showed an increase of 20.84% on a yearly basis.

Gallantt Ispat Quarterly Result Highlights

  • Gallantt Ispat reported revenue of ₹1,229.33 crore in Mar 2026, compared with ₹1,088.61 crore in Dec 2025, representing an increase of 12.93% on a quarter-on-quarter (QoQ) basis.
  • Gallantt Ispat reported an operating profit of ₹161.61 crore in Mar 2026, compared with ₹123.04 crore in Dec 2025, representing an increase of 31.35% on a quarter-on-quarter (QoQ) basis.
  • Gallantt Ispat reported a profit of ₹122.83 crore in Mar 2026, compared with ₹100.41 crore in Dec 2025, reflecting an increase of 22.33% on a QoQ basis.
  • The earnings per share (EPS) of Gallantt Ispat stood at ₹16.61 during Mar 2026.
Know more
Promoters
70.00%
FII
0.09%
Other DII
0.00%
Retail and other
29.83%
Mutual funds
0.08%
Foreign institutions - FII
Compare against other stocks
Gallantt Ispat logo
Gallantt Ispat
Steel & Iron Products
Add Stock
Add Another

FAQs on Gallantt Ispat Share Price