As of 5 Jul 2026, Dixon Techno share price is ₹12,456.00. The stock opened at ₹12,470.00, compared to its previous close of ₹12,373.00. During today's trading session, Dixon Techno share price moved in the range of ₹12,325.00 to ₹12,575.00, with an average price of ₹12,450.00 for the day. Looking at its last 52-week, the stock has touched a low of ₹9,600.00 and a high of ₹18,471.00. On the performance front, Dixon Techno share price has increased by 2.39% over the last six months and is down 17.37% on a year-on-year basis.
| Name | Mkt Cap Cr | P/E | P/B | ROE | D/E | ROCE | Book Value | Div. Yield | Turnover | EPS(TTM) |
|---|---|---|---|---|---|---|---|---|---|---|
| LG ELECTRONICS INDIA LTD | 1,06,425.00 | 63.15 | 13.88 | 21.98% | 0.06 | 27.56% | 112.93 | 0.00% | 2.91 | 24.83 |
| Havells India | 74,479.00 | 44.19 | 7.90 | 19.00% | 0.03 | 24.73% | 7.88 | 0.84% | 2.21 | 27.19 |
| Voltas | 42,713.90 | 111.82 | 6.59 | 5.74% | 0.09 | 8.54% | 5.28 | 0.31% | 1.23 | 10.31 |
| Blue Star | 32,858.30 | 62.30 | 9.58 | 15.38% | 0.30 | 17.99% | 148.84 | 0.53% | 3.60 | 18.73 |
| Amber Enterprises (I) | 26,126.90 | 115.37 | 5.98 | 4.66% | 0.63 | 8.48% | 868.09 | 0.00% | 1.97 | 41.45 |
| Kaynes Technology | 21,154.80 | 58.14 | 4.46 | 7.66% | 0.07 | 10.97% | 671.25 | 0.00% | 0.47 | 38.30 |
| Crompt Grea Con Elec | 17,646.50 | -76.55 | 5.95 | 11.31% | 0.06 | 22.64% | 49.36 | 1.09% | 2.06 | -3.78 |
| PG Electroplast | 16,012.90 | 81.50 | 5.25 | 6.45% | 0.03 | 9.61% | 93.79 | 0.04% | 0.53 | 4.35 |
| Avalon Technologies | 11,921.20 | 105.52 | 16.52 | 15.65% | 0.05 | 18.01% | 122.60 | 0.00% | 0.99 | 13.41 |
| Whirlpool of India | 10,297.50 | 34.86 | 2.47 | 7.06% | 0.09 | 9.73% | 288.80 | 0.62% | 1.73 | 19.09 |
| Particulars | Mar 2025 | Mar 2024 | Mar 2023 | Mar 2022 |
|---|---|---|---|---|
| Revenue | ₹38,860.10 | ₹17,690.90 | ₹12,192.01 | ₹10,697.08 |
| Other Income | ₹20.23 | ₹22.56 | ₹5.61 | ₹3.81 |
| Total Revenue | ₹38,880.33 | ₹17,713.46 | ₹12,197.62 | ₹10,700.89 |
| Total Expenses | ₹37,787.89 | ₹17,229.87 | ₹11,854.46 | ₹10,446.12 |
| Profit Before Tax | ₹1,569.80 | ₹493.83 | ₹344.78 | ₹254.71 |
| Tax | ₹337.22 | ₹118.91 | ₹89.70 | ₹64.38 |
| Profit After Tax | ₹1,232.58 | ₹374.92 | ₹255.08 | ₹190.33 |
| EPS - Basic | ₹205.70 | ₹62.84 | ₹42.92 | ₹32.31 |
| EPS - Diluted | ₹202.58 | ₹62.46 | ₹42.62 | ₹32.00 |
| Particulars | Mar 2025 | Mar 2024 | Mar 2023 | Mar 2022 |
|---|---|---|---|---|
| Profit before tax | ₹1,552.42 | ₹483.59 | ₹343.16 | ₹254.71 |
| Income before WC changes | ₹1,607.33 | ₹714.91 | ₹531.35 | ₹390.83 |
| Change in Assets | -₹6,206.51 | -₹1,751.69 | -₹51.14 | -₹829.76 |
| Change in Liabilities | ₹6,024.89 | ₹1,742.88 | ₹327.53 | ₹765.65 |
| Change in WC | -₹181.62 | -₹8.81 | ₹276.39 | -₹64.11 |
| Cash flow from Operations | ₹1,149.75 | ₹584.31 | ₹725.75 | ₹272.74 |
| Cash flow from Investing | -₹1,228.90 | -₹530.90 | -₹355.55 | -₹464.46 |
| Cash flow from Financing | -₹26.57 | -₹69.97 | -₹329.62 | ₹304.32 |
| Total Cash Flow | -₹105.72 | -₹16.56 | ₹40.58 | ₹112.60 |
| Cash (Start of the year) | ₹200.48 | ₹217.04 | ₹176.46 | ₹63.86 |
| Cash (End of the year) | ₹230.85 | ₹200.48 | ₹217.04 | ₹176.46 |
| Particulars | Mar 2025 | Mar 2024 | Mar 2023 | Mar 2022 |
|---|---|---|---|---|
| Non-Current Assets | ₹3,672.49 | ₹2,155.17 | ₹1,540.16 | ₹1,130.17 |
| Current Assets | ₹13,094.38 | ₹4,836.28 | ₹3,139.27 | ₹3,147.00 |
| Total Assets | ₹16,766.87 | ₹6,991.45 | ₹4,679.43 | ₹4,277.17 |
| Current Liabilities | ₹12,595.44 | ₹4,731.62 | ₹2,940.99 | ₹2,735.89 |
| Net Current Asset | ₹498.94 | ₹104.66 | ₹198.28 | ₹411.11 |
| Non-Current Liabilities | ₹702.10 | ₹537.37 | ₹453.81 | ₹543.95 |
| Equity Capital | ₹3,469.33 | ₹1,722.46 | ₹1,284.63 | ₹997.33 |
| Total Equity & Liabilities | ₹16,766.87 | ₹6,991.45 | ₹4,679.43 | ₹4,277.17 |
| Particulars | Mar 2025 | Mar 2024 | Mar 2023 | Mar 2022 |
|---|---|---|---|---|
| Revenue | ₹5,400.90 | ₹6,411.40 | ₹6,997.40 | ₹7,484.41 |
| Other Income | ₹66.47 | ₹37.29 | ₹18.47 | ₹2.62 |
| Total Revenue | ₹5,467.37 | ₹6,448.69 | ₹7,015.87 | ₹7,487.03 |
| Total Expenses | ₹5,277.99 | ₹6,201.71 | ₹6,730.62 | ₹7,286.66 |
| Profit Before Tax | ₹678.88 | ₹246.98 | ₹285.25 | ₹200.37 |
| Tax | ₹112.98 | ₹61.32 | ₹74.10 | ₹49.41 |
| Profit After Tax | ₹565.90 | ₹185.66 | ₹211.15 | ₹150.96 |
| EPS - Basic | ₹94.44 | ₹31.12 | ₹35.53 | ₹25.63 |
| EPS - Diluted | ₹93.01 | ₹30.93 | ₹35.27 | ₹25.38 |
| Particulars | Mar 2025 | Mar 2024 | Mar 2023 | Mar 2022 |
|---|---|---|---|---|
| Profit before tax | ₹678.88 | ₹246.98 | ₹285.25 | ₹200.37 |
| Income before WC changes | ₹302.78 | ₹325.19 | ₹377.15 | ₹282.52 |
| Change in Assets | ₹316.07 | ₹108.19 | ₹205.92 | ₹57.53 |
| Change in Liabilities | -₹288.03 | -₹124.51 | -₹114.41 | -₹77.30 |
| Change in WC | ₹28.04 | -₹16.32 | ₹91.51 | -₹19.77 |
| Cash flow from Operations | ₹278.59 | ₹239.31 | ₹404.46 | ₹214.26 |
| Cash flow from Investing | -₹381.69 | -₹265.83 | -₹282.95 | -₹248.96 |
| Cash flow from Financing | ₹120.84 | ₹2.31 | -₹188.93 | ₹110.07 |
| Total Cash Flow | ₹17.74 | -₹24.21 | -₹67.42 | ₹75.37 |
| Cash (Start of the year) | ₹19.79 | ₹44.00 | ₹111.42 | ₹36.05 |
| Cash (End of the year) | ₹37.53 | ₹19.79 | ₹44.00 | ₹111.42 |
| Particulars | Mar 2025 | Mar 2024 | Mar 2023 | Mar 2022 |
|---|---|---|---|---|
| Non-Current Assets | ₹2,376.25 | ₹1,466.08 | ₹1,177.92 | ₹820.18 |
| Current Assets | ₹1,104.16 | ₹1,367.44 | ₹1,554.13 | ₹1,905.67 |
| Total Assets | ₹3,480.41 | ₹2,833.52 | ₹2,732.05 | ₹2,725.85 |
| Current Liabilities | ₹1,048.83 | ₹1,228.09 | ₹1,316.43 | ₹1,473.13 |
| Net Current Asset | ₹55.33 | ₹139.35 | ₹237.70 | ₹432.54 |
| Non-Current Liabilities | ₹248.81 | ₹211.13 | ₹249.22 | ₹330.46 |
| Equity Capital | ₹2,182.77 | ₹1,394.30 | ₹1,166.40 | ₹922.26 |
| Total Equity & Liabilities | ₹3,480.41 | ₹2,833.52 | ₹2,732.05 | ₹2,725.85 |
Dixon Technologies (India) Limited is a major player in the electronic goods industry. Since its establishment in 1993, Dixon Technologies has diversified its products and services to cater to different segments within the electronic goods manufacturing sector.
Dixon manufactures a range of products including LCDs, washing machines, DVDs, mixers grinders, set-top boxes and LED lighting solutions. It is a major supplier for renowned brands like LG Electronics and Philips India. The electronics manufacturing services (EMS) caters to both domestic and international clients in consumer electronics and home appliances segments.
The company began the manufacturing of colour television sets in 1994. It established its Noida manufacturing unit in 1998. The company entered the lighting products segment in 2008 and started washing machine manufacturing in 2010.
By 2018, the company had diversified into manufacturing of mobile phones, security systems and CCTV cameras. In 2020, the company introduced medical electronics and set-top boxes. The next year, the company entered the wearables, telecommunication and IT hardware segments.
The market capitalisation of Dixon Technologies stood at more than ₹38,500 crore as of December 21, 2023. Dixon Technologies share price has gained 1495 in the past three years.
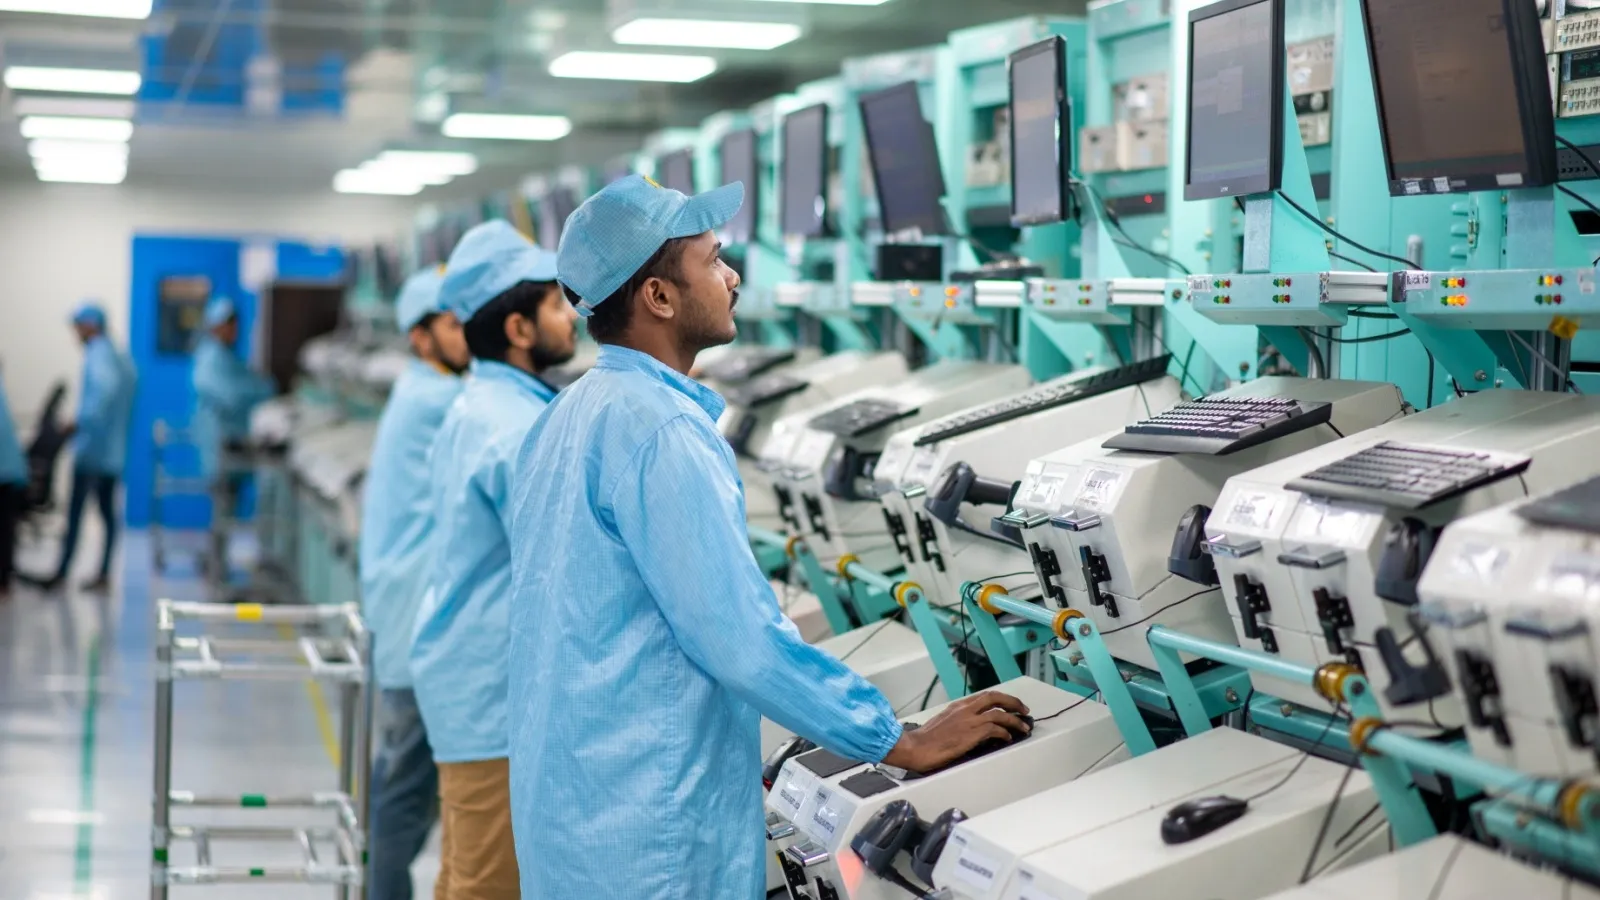
Dixon Technologies caters to customers both in India and abroad through its manufacturing units and 2,700 employees across all verticals. The company operates 21 manufacturing plants to ensure efficient production. It also has three research and development (R&R) centres.
Dixon operates India's largest manufacturing facilities for LED televisions (located in Tirupati), washing machines (in Dehradun) and LED bulbs (in Noida). The company produces and assembles many products including home appliances, smartphones, laptops, television sets, set-top boxes, medical electronics, lighting solutions and security surveillance systems. Dixon has played a pivotal role in taking India to the forefront of the electronics manufacturing industry. The business operates across two main segments: original design manufacturing (ODM) and original equipment manufacturing (OEM).
The majority of Dixon's operations occur in manufacturing and design, which include product ranges across consumer electronics, lighting, home appliances and mobile phones. While more than 60% revenue of the company comes from the consumer electronics segment, lighting solutions contribute 15% of revenue and home appliances add 16%.
The company manages its domestic and global operations through its subsidiaries and joint ventures. Its subsidiaries include Dixon Global Pvt Ltd, Padget Electronics Pvt Ltd, Dixon Electro Appliances Pvt Ltd, Dixon Electro Manufacturing Pvt Ltd, Dixon Technologies Solutions Pvt Ltd and Dixtel Communications Pvt Ltd.
Dixon Techno share price is ₹12,456.00 as on 03 Jul, 2026, 15:59 IST.
In the last 1 year, Dixon Techno delivered a return of -17.37%. The Dixon Techno share price hit a high of ₹18,471.00 and low of ₹9,600.00.
The Mutual Fund Shareholding in Dixon Techno was 19.27% at the end of Mar 2026.
The 52-week high and low of Dixon Techno share is ₹18,471.00 and ₹9,600.00 as of 03 Jul, 2026.
The market capitalisation of Dixon Techno is ₹75,595.70 Crores as on 03 Jul, 2026.
The stock symbol of Dixon Techno is DIXON on the NSE, 540699 on the BSE, and the ISIN is INE935N01020.
Dixon Techno shares closed yesterday at ₹12,373.00 on NSE & ₹12,375.30 on BSE
To buy Dixon Techno shares, open a demat account with Upstox and complete the KYC process. Once your account is set up, search for the stock and place your order.
No, shares of Dixon Techno or any other publicly traded company cannot be bought or sold on holidays when the stock exchanges are closed. You can only buy or sell Dixon Techno shares on days when the stock exchanges are open for trading. It's important to check the NSE & BSE holidays calendar, before placing any trades to avoid any inconvenience.
The PE and PB ratio of Dixon Techno is 45.98 and 16.16 respectively, as on 03 Jul, 2026, 15:59 IST.