Upstox Originals
FMCG Q2FY25: Crisp performance; outlook soggy?
.png)
8 min read | Updated on October 29, 2024, 18:30 IST
SUMMARY
FMCG is perceived as one of the most stable sectors. In times when markets are challenging, investors turn to defensive sectors like FMCG, seeking refuge. As such, tracking its performance becomes critical. So far, performance in Q2FY25 has broadly been steady. Revenue growth has been underwhelming, but margins are stable. On a challenging note, the outlook remains challenging with demand weakness and rising inflation.

Urban areas are seeing reduced spending as consumers face rising living costs and inflation.
The FMCG sector’s Q2FY25 results show both strength and challenges, revealing steady growth against a backdrop of inflation and muted demand in urban areas. Even as costs rise, effective pricing strategies and premiumization efforts have helped leading companies navigate the quarter.
Overall revenue growth has been modest at 5%, versus the market’s expectation of a 7-9% revenue growth this quarter. Managements have highlhgited multiple challenges (covered later in this article) which have deterred revenue growth this quarter. That said, these are not the complete set of results.
| Revenue | Revenue | Revenue | Revenue | Growth (%) | Growth (%) | |
|---|---|---|---|---|---|---|
| Company | Q1FY24 | Q2FY24 | Q1FY25 | Q2FY25 | Q1YoY | Q2YoY |
| Hindustan Unilever | 15,496 | 15,623 | 15,707 | 15,926 | 1% | 2% |
| Nestle India | 4,659 | 5,037 | 4,814 | 5,104 | 3% | 1% |
| Godrej Consumer Products | 3,449 | 3,602 | 3,332 | 3,666 | -3% | 2% |
| Varun Beverages | 5,611 | 3,871 | 7,197 | 4,805 | 28% | 24% |
| Colgate-Palmolive (India) | 1,324 | 1,471 | 1,497 | 1,619 | 13% | 10% |
| Total | 30,539 | 29,604 | 32,547 | 31,120 | 7% | 5% |
Source: Screener; *Aside from the FMCG stocks discussed above, the Q2FY25 results for others have yet to be released at the time of writing.
Taking a look at the gross margins of the FMCG sector, it's clear the industry has managed to hold its ground with gross margins staying steady between 56% to 58%. Despite its price competitive nature, it seems that, FMCG companies have managed to hold on to their pricing power and keep costs under check.
| Gross Margins (%) | ||||
|---|---|---|---|---|
| Companies | Q1FY24 | Q2FY24 | Q1FY25 | Q2FY25 |
| Hindustan Unilever | 50% | 53% | 52% | 52% |
| Nestle India | 55% | 56% | 58% | 57% |
| Godrej Consumer Products | 54% | 55% | 56% | 56% |
| Varun Beverages | 53% | 55% | 55% | 56% |
| Colgate-Palmolive (India) | 68% | 69% | 71% | 69% |
| Average | 56% | 58% | 58% | 58% |
Source: Screener
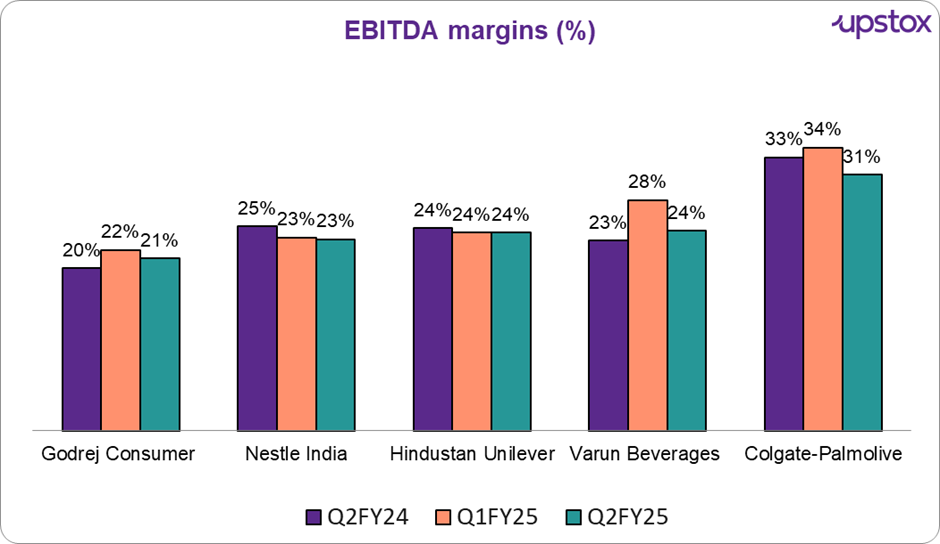
Stable gross margins have also translated into a steady EBITDA margins, with companies reporting largely flat margins. While there are a few who hav reported dips, we would wait to see the entire picture before drawing conclusions.

Source: Company financials, reports
The FMCG sector is showing great performance based on Adjusted PAT figures. From Q1FY24 to Q2FY25, there's been a steady rise, even though YoY growth has slowed down this quarter.
| Adjusted PAT | Adjusted PAT | Adjusted PAT | Adjusted PAT | Growth (%) | Growth (%) | |
|---|---|---|---|---|---|---|
| Company | Q1FY24 | Q2FY24 | Q1FY25 | Q2FY25 | Q1YoY | Q2YoY |
| Hindustan Unilever | 2,593 | 2,662 | 2,660 | 2,611 | 3% | -2% |
| Nestle India | 698 | 1,014 | 747 | 1,277 | 7% | 26% |
| Godrej Consumer Products | 401 | 445 | 471 | 497 | 18% | 12% |
| Varun Beverages | 1,005 | 514 | 1,262 | 629 | 26% | 22% |
| Colgate-Palmolive (India) | 274 | 340 | 364 | 395 | 33% | 16% |
| Total | 4,971 | 4,975 | 5,504 | 5,409 | 11% | 9% |
Source: Screener.in
Key risks
-
Urban demand slowdown: Urban areas are seeing reduced spending as consumers face rising living costs and inflation. This drop in urban demand has hit profits, especially for products in popular and mass-market segments.
-
Rising commodity costs: Higher prices for key raw materials, like palm oil, are squeezing margins. Companies such as Godrej consumers reported a rise in raw material costs, leading to a decline in operating margins.
-
Inflation impact on consumer budgets: With food inflation touching 9.2% in September, household budgets are strained, which has led to cautious spending on FMCG products, especially in non-premium categories.
Performance - Actuals versus analyst expectations
If a company significantly exceeds expectations, its stock prices are likely to rise. Conversely, falling short of expectations can negatively impact stock prices. As such, we anlayse the performance against broader market expectations.
| Company | Expectation | Reality |
|---|---|---|
| Colgate-Palmolive (India) | Expected profit increase in line with analyst estimates. | In line with expectations |
| Varun Beverages | Expected to meet or slightly exceed earnings forecasts. | Above expectations |
| Godrej Consumer Products | Expected profit growth of ~13%. | In line with expectations |
| Nestle India | Expected to exceed the net profit estimate of ₹852 crore. | Above expectations |
| Hindustan Unilever | Expected flat profit growth due to demand recovery concerns; estimated PAT near ₹2,656.9 crore. | In line with expectations |
Source: News articles
Before we move to the next section, if you would like to read our take on India’s tech and private banks’ results, please see the links below
Moving to management expectations
Hindustan Unilever
-
Mixed environment: Urban demand growth is moderating, while rural demand is gradually recovering.
-
Volume-led growth: Focus on maintaining market share and increasing volume-led growth.
-
EBITDA margin: "We are maintaining EBITDA margin at current levels."
-
Strategic priorities: Strengthening core brands, driving premiumization, and separating the Ice Cream business.
-
Trade growth: Consistent double-digit growth in modern trade and rapidly expanding e-commerce.
-
Overall outlook: Cautiously optimistic, focusing on innovation and cost management.
Colgate
-
Positive industry outlook: Focus on expanding consumption and premiumization.
-
Growth potential: CEO Prabha Narasimhan: “The average toothpaste consumption in India continues to be under-indexed…with significant headroom opportunity for us even if we approach the consumption levels of the Philippines or Brazil.”
-
Rural markets: Gaining momentum with rural growth now outpacing urban by around 200 basis points.
Godrej Consumers
-
Cautiously optimistic: Strong domestic volume growth despite inflation and consumer demand pressures
-
Challenges: High inflation, particularly on palm oil, impacting EBITDA margins.
-
Recovery: CEO Sudhir Sitapati: “GCPL has had a steady quarter given the headwinds of oil costs and tough consumer demand in India.”
-
International growth: Strong growth in Indonesia and resilience in key product categories.
Varun Beverages
-
Optimistic outlook: Significant growth potential in the snack business.
-
Capacity expansion: Plans to expand beverage capacities ahead of the peak season.
-
Business growth: “While competition is rising, there is ample scope for business growth for all players.”
-
International demand: Strong demand in markets like DRC, Zambia, and Sri Lanka.
-
Distribution network: Focusing on expanding in underpenetrated areas like Gujarat.
-
Strategic initiatives: Confident that strategic initiatives will drive growth and improve operational efficiencies.
Finally, we look at some of the key companies in this sector.
| # | Name | Market Cap ₹ Cr. | P/E | ROE (%) | 3-Year Stock Return % (2019-2024) | 3-Year Profit Growth % (2019-2024) |
|---|---|---|---|---|---|---|
| 1 | Hind. Unilever | 5,93,742 | 58 | 20 | 1 | 10 |
| 2 | Nestle India | 2,18,304 | 69 | 135 | 6 | 22 |
| 3 | Varun Beverages | 1,98,657 | 78 | 35 | 77 | 35 |
| 4 | Britannia Inds. | 1,37,125 | 62 | 57 | 15 | 8 |
| 5 | Godrej Consumer | 1,32,300 | 73 | -56 | 9 | 9 |
| 6 | Dabur India | 95,528 | 52 | 19 | -2 | 9 |
| 7 | Colgate-Palmoliv | 84,079 | 57 | 75 | 28 | 5 |
| 8 | P & G Hygiene | 51,801 | 77 | 78 | 4 | 6 |
| 9 | Emami | 27,945 | 38 | 30 | 7 | 8 |
| 10 | Gillette India | 26,758 | 65 | 42 | 13 | 10 |
| 11 | Hatsun Agro | 24,015 | 76 | 17 | -6 | 13 |
| 12 | Bikaji Foods | 21,618 | 73 | 25 | - | 21 |
| 13 | Jyothy Labs | 17,903 | 48 | 21 | 48 | 13 |
| 14 | L T Foods | 12,272 | 20 | 19 | 72 | 18 |
| Average | 1,17,289 | 60 | 37 | 21 | 13 |
Source: Screener data as of 25-10-24
Conclusion
Q2FY25 results affirm the FMCG sector’s ability to thrive amid economic pressures. Companies are maintaining margins and pushing for innovation to attract consumers, despite weaker demand in certain segments. With a focus on premiumization and cost management, the sector is set for sustainable growth.
By signing up you agree to Upstox’s Terms & Conditions
About The Author
Next Story
