Market News
Trade Setup for Sept 9: NIFTY50 forms bearish engulfing on weekly chart, 25,000 turns into resistance
.png)
5 min read | Updated on September 09, 2024, 07:38 IST


SUMMARY
Both NIFTY50 and BANK NIFTY index formed bearish engulfing on the weekly chart, which is a bearish candlestick pattern. A bearish engulfing pattern occurs when a large red candle completely engulfs the previous green candle, signaling a potential reversal.
Stock list

The BANK NIFTY index dropped nearly 1,000 points from Friday’s intra day, breaking below the critical 51,000 level.
Asian markets update at 7 am
The Gift Nifty is down 0.3% from Friday's close, indicating a gap down start for Indian equities today. Other Asian indices are also trading in the red. The Nikkei 225 is down 2.3%, while Hong Kong's Hang Seng Index slipped 1.1%.
U.S. market update
- Dow Jones: 40,3445 (▼1.0%)
- S&P 500: 5,408 (▼1.7%)
- Nasdaq Composite: 16,690 (▼2.5%)
U.S. indices ended the Friday’s session in the red as investors digested the crucial jobs report of the August, which will pivotal for the U.S. Federal Reserve to adjust the size of the expected rate cut later this month.
On Friday, the U.S. jobs report remained inconclusive. The U.S. economy added 1,42,000 jobs in August, which was below expectations of 1,65,000. However, the additions were higher than July's data, which was revised down to 89,000. Meanwhile, the unemployment rate ticked down from 4.3% to 4.2%. As on Friday, Fed Funds Futures are pricing in a 30% probability of a 0.5% rate cut at the September meeting, down from 40% the previous day.
NIFTY50
- September Futures: 24,906 (▼1.3%)
- Open Interest: 5,70,923 (▼4.1%)
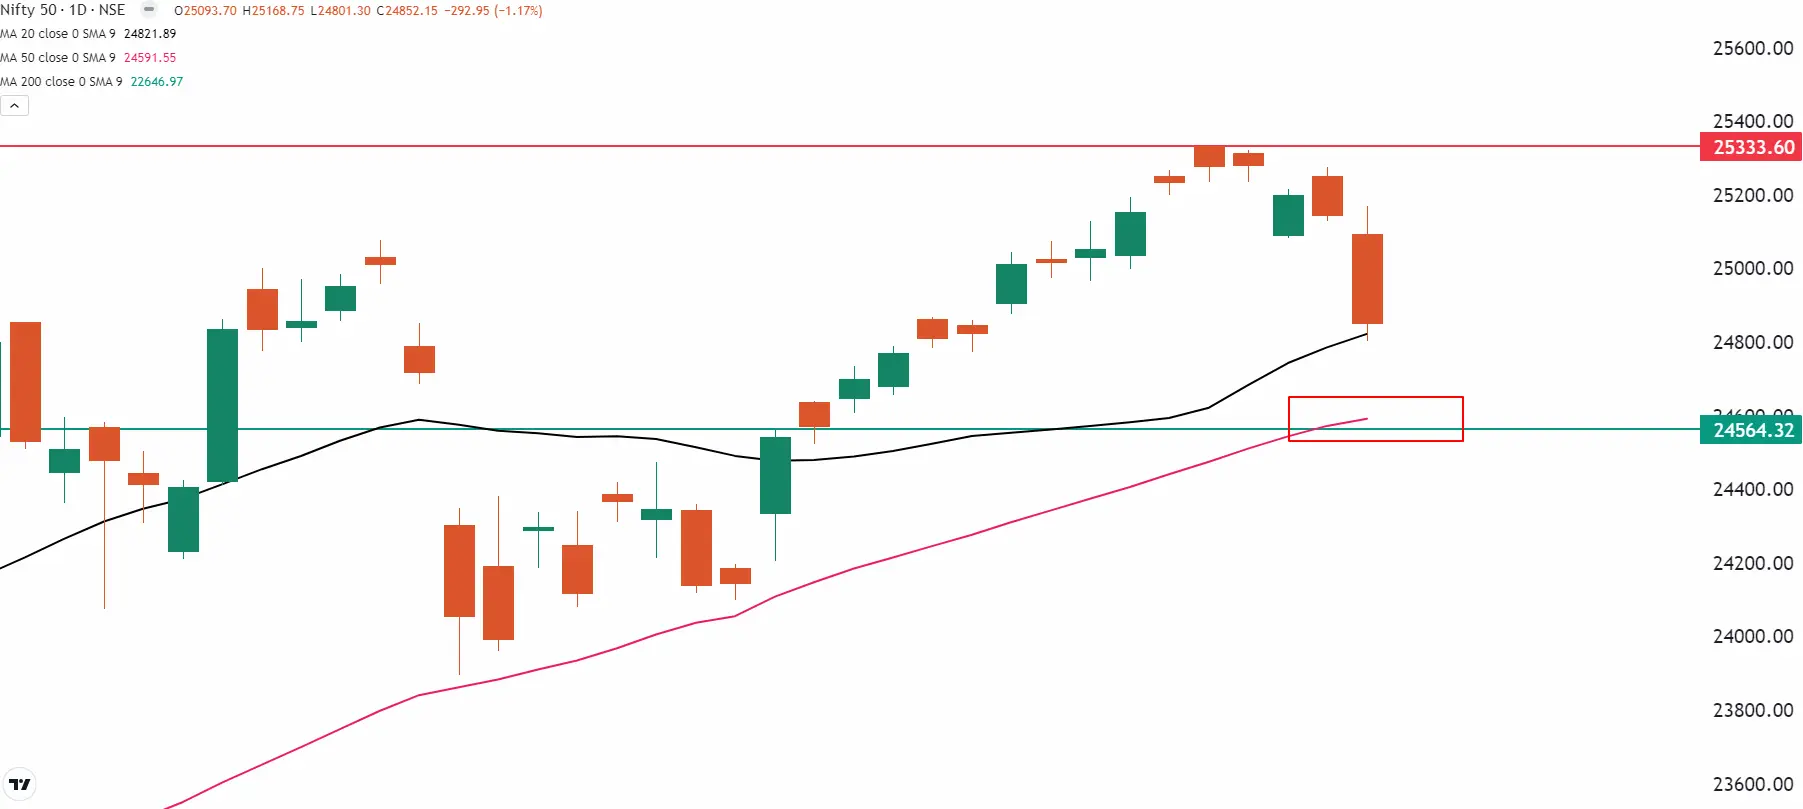
The bears staged a strong comeback on the Dalal Street, pushing the NIFTY50 below the pscyhologically crucial 25,000 mark on Friday. The index closed with a bearish candle on both the daily and weekly charts, signalling potential weakness in the days ahead.
On the daily chart, after breaking the key support level of 25,000, the index found stability near the 20-day moving average (DMA) around 24,800. The short-term momentum has shifted in favour of the bears, with the recent all-time high of 25,333 now acting as immediate resistance. The next critical support level for the index lies near its 50 DMA, around 24,500.
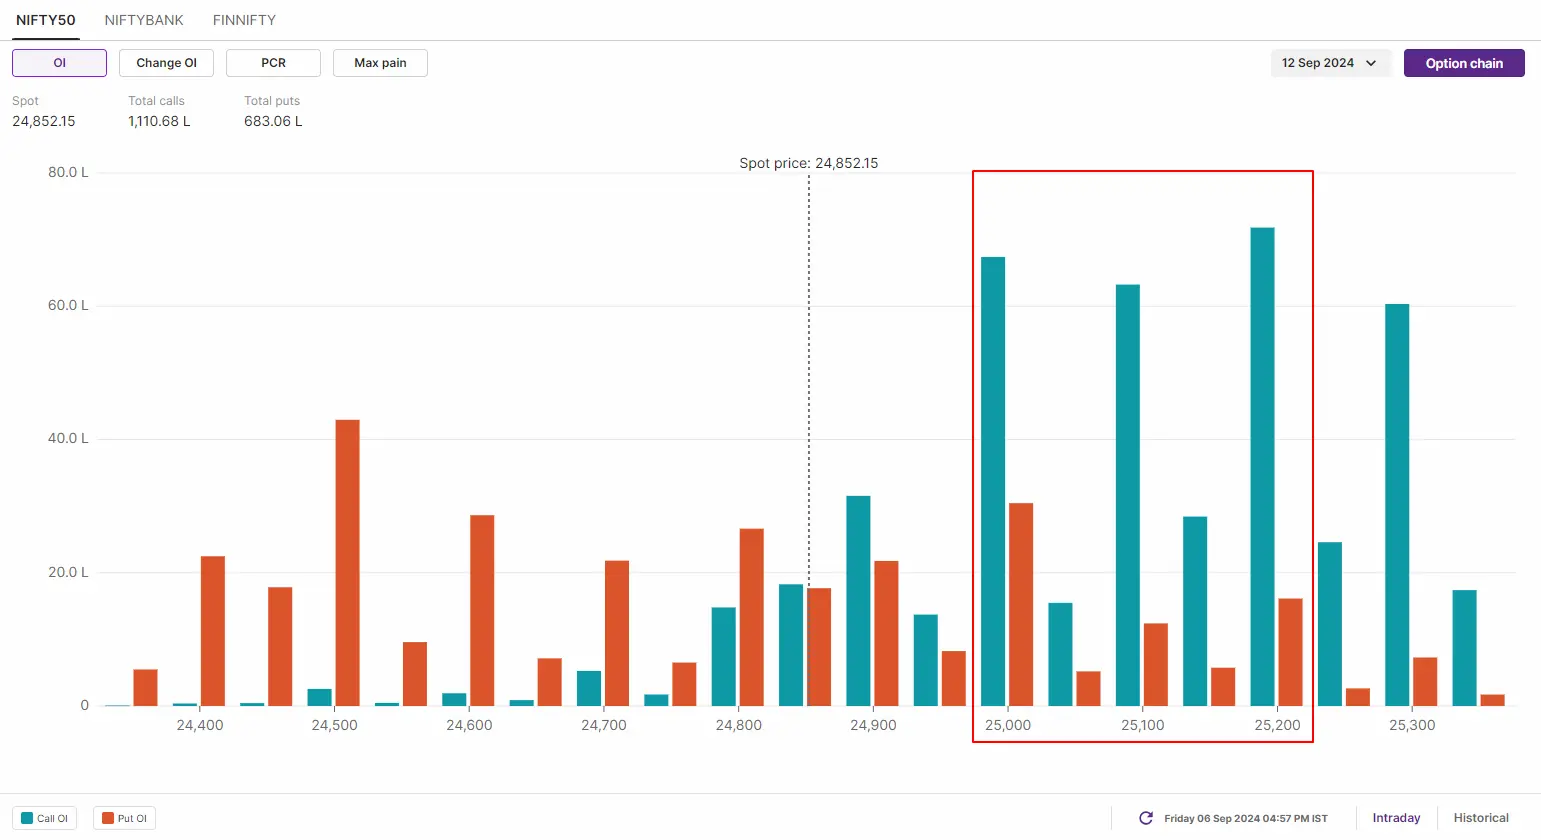
Open interest data for the 12 September expiry saw substantial call additions at 25,000 and 25,300 strike prices, establishing these zones as key resistance zones for traders. In contrast, minimal put writing was seen at 24,500 and 24,000 strikes, indiciating that these levels may serve as crucial support for the index.
BANK NIFTY
- September Futures: 50,787 (▼1.8%)
- Open Interest: 1,67,773 (▲6.2%)
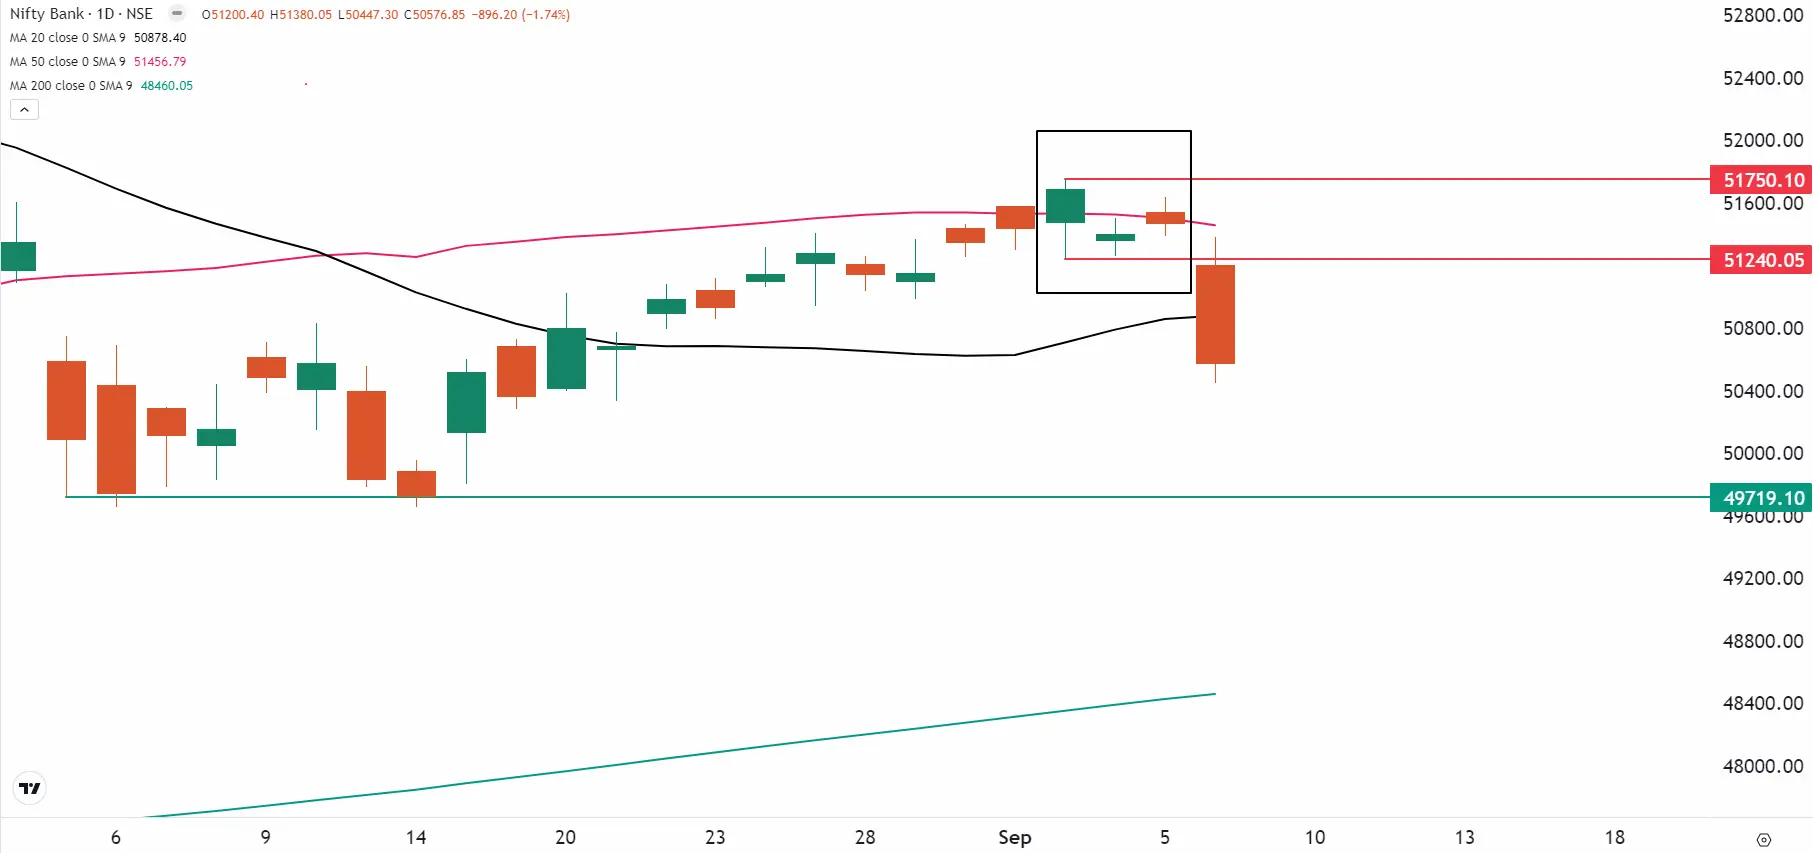
The BANK NIFTY index dropped nearly 1,000 points from Friday’s intra day, breaking below the critical 51,000 level. Like the NIFTY50, it formed a bearish candle on both the daily and weekly charts, signalling the emergence of fresh sellers at higher levels.
In our Friday, 6 September blog, we advised readers to watch for a break above or below the 3 September candle for directional clues. Once the index broke below the low of 3 September, it fell over 1%, breaching the crucial support at its 20-day moving average.
In the upcoming sessions, the index faces immediate resistance at its 50-day moving average (DMA), around 50,500, while immediate support is seen at 49,500. If the index slips below this support level, the next key level to watch is the 200 DMA, positioned around 48,500.
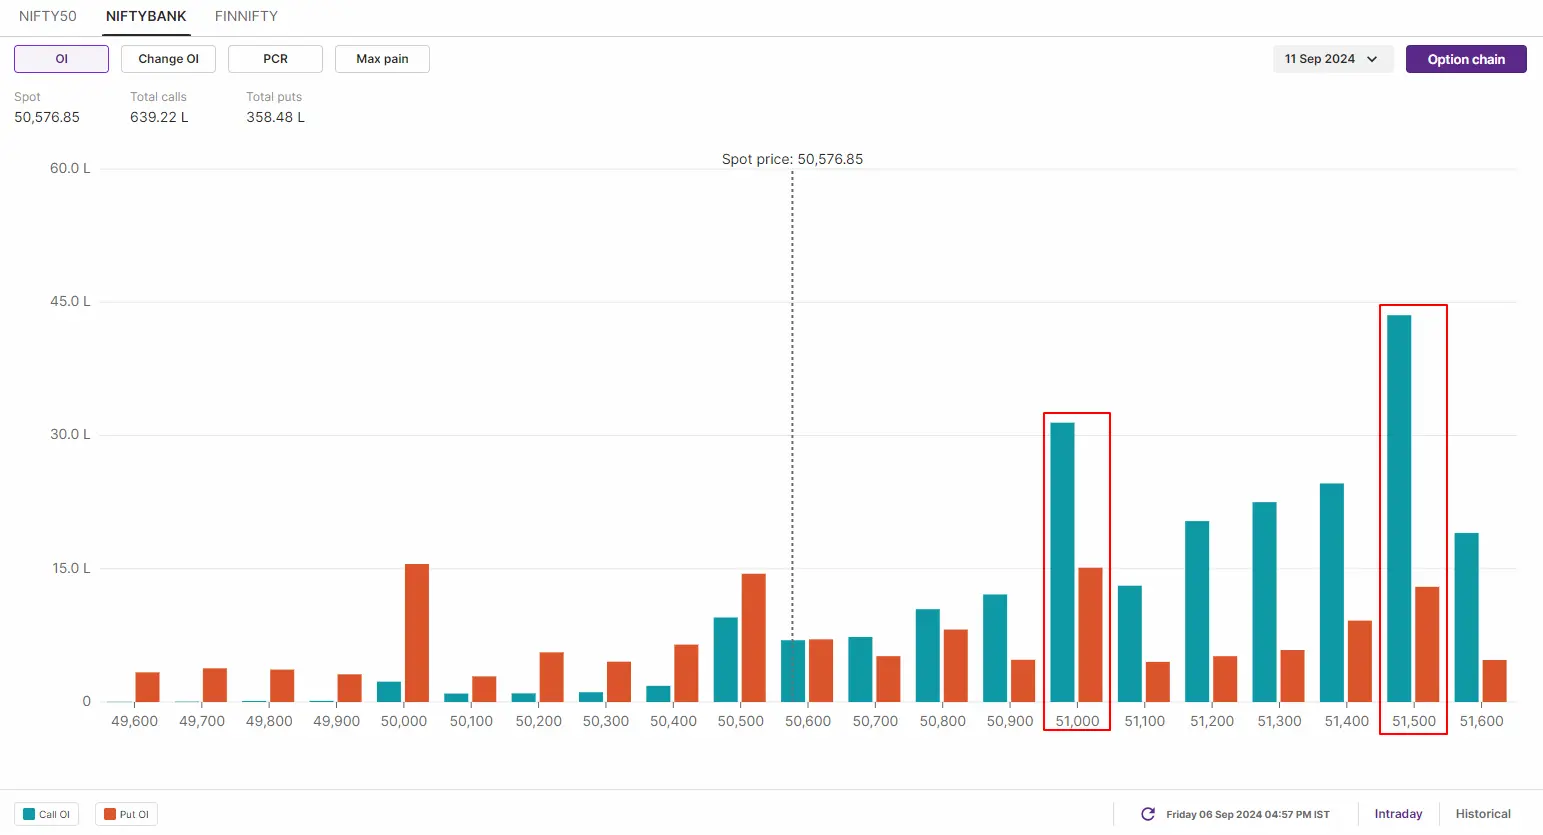
The open interest positioning for 11 September expiry shows a significant call buildup at the 51,500 an 51,000 strikes, marking them as immediate resistance zones for the index. In contrast, limited put writing at the 50,500 and 50,000 strikes suggests support around these levels for the index.
FII-DII activity
Stock scanner
Long build-up: N/A
Under F&O ban: Aditya Birla Fashion and Retail, Balrampur Chini Mills, Bandhan Bank, Biocon, Chambal Fertilisers, Hindustan Copper and RBL Bank
Added under F&O ban: N/A
In Futures and Options or F&O, long build-up means an increase in Open Interest (OI) along with an increase in price, and short build-up means an increase in Open Interest(OI) along with a decrease in price.
Source: Upstox and NSE.
Disclaimer: Derivatives trading must be done only by traders who fully understand the risks associated with them and strictly apply risk mechanisms like stop-losses. The information is only for consumption by the client and such material should not be redistributed. We do not recommend any particular stock, securities and strategies for trading. The securities quoted are exemplary and are not recommendatory. The stock names mentioned in this article are purely for showing how to do analysis. Take your own decision before investing.
About The Author
Next Story


