Market News
Trade setup for Feb 17: NIFTY50 slips below 23,000; can it hold the crucial 22,700 support?
.png)
4 min read | Updated on February 17, 2025, 07:27 IST


SUMMARY
The NIFTY50 index is currently hovering around the crucial support zone of 22,700. A close below this level on daily chart will indicate furher weakness. Meanwhile, in case of a rebound, if the index reclaims the resistance zone of 23,350, it can extend the momentum till 23,600.
Stock list
The NIFTY50 index extended its losing streak for the eighth consecutive session, closing below the psychologically crucial 23,000 mark. | Image: Shutterstock
Asian markets @ 7 am
- GIFT NIFTY: 22,963.50 (+0.14%)
- Nikkei 225: 39,174.09 (+0.06%)
- Hang Seng: 22,959.44 (+1.50%)
U.S. market update
- Dow Jones: 44,546 (▼0.3%)
- S&P 500: 6,114 (▼0.0%)
- Nasdaq Composite: 20,026 (▲0.4%)
U.S. indices closed Friday’s session on a mixed note after retail sales declined by 0.9% month-over-month in January to $723.9 billion, a steeper drop than the estimated 0.2% decline. While experts anticipated a slowdown, the actual figures fell well below expectations, largely due to a pullback in consumer spending following the holiday surge, as well as disruptions caused by wildfires in Los Angeles and severe winter weather in the South.
NIFTY50
- February Futures: 22,972 (▼0.1%)
- Open interest: 2,31,808 (▲0.6%)
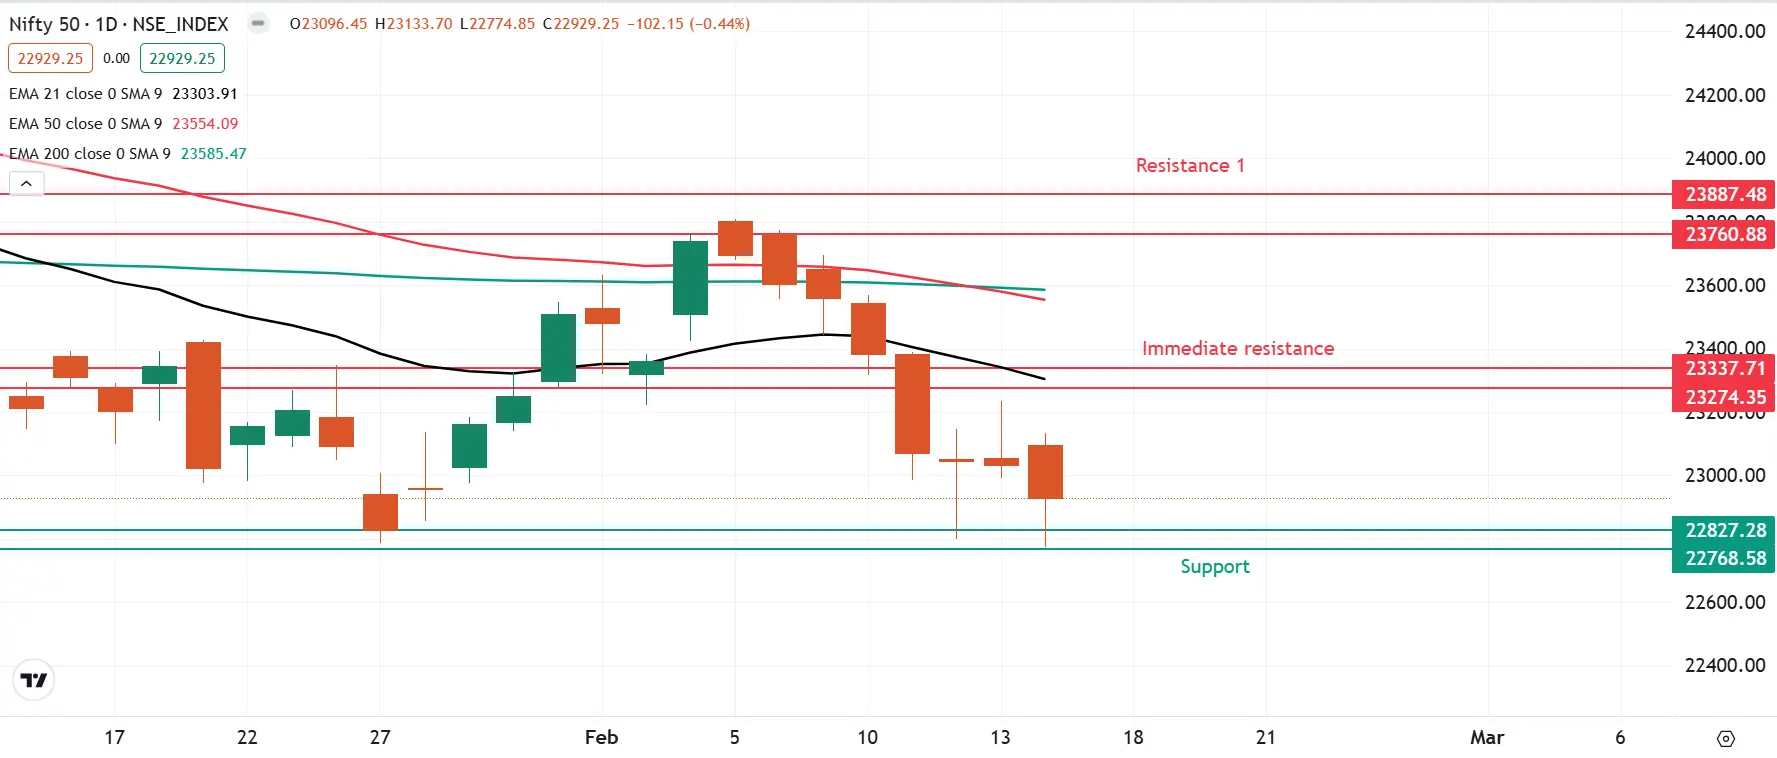
The NIFTY50 index extended its losing streak for the eighth consecutive session, closing below the psychologically crucial 23,000 mark. However, it managed to hold above the key support zone of 22,700, last tested in January.
The technical outlook remains weak, as the index continues to trade below critical support levels—the 21-day, 50-day, and 200-day exponential moving averages (EMAs). For any meaningful rebound, NIFTY50 must reclaim the immediate resistance at 23,350. On the downside, a decisive close below the January low could trigger further weakness, potentially dragging the index toward the 22,500 zone.
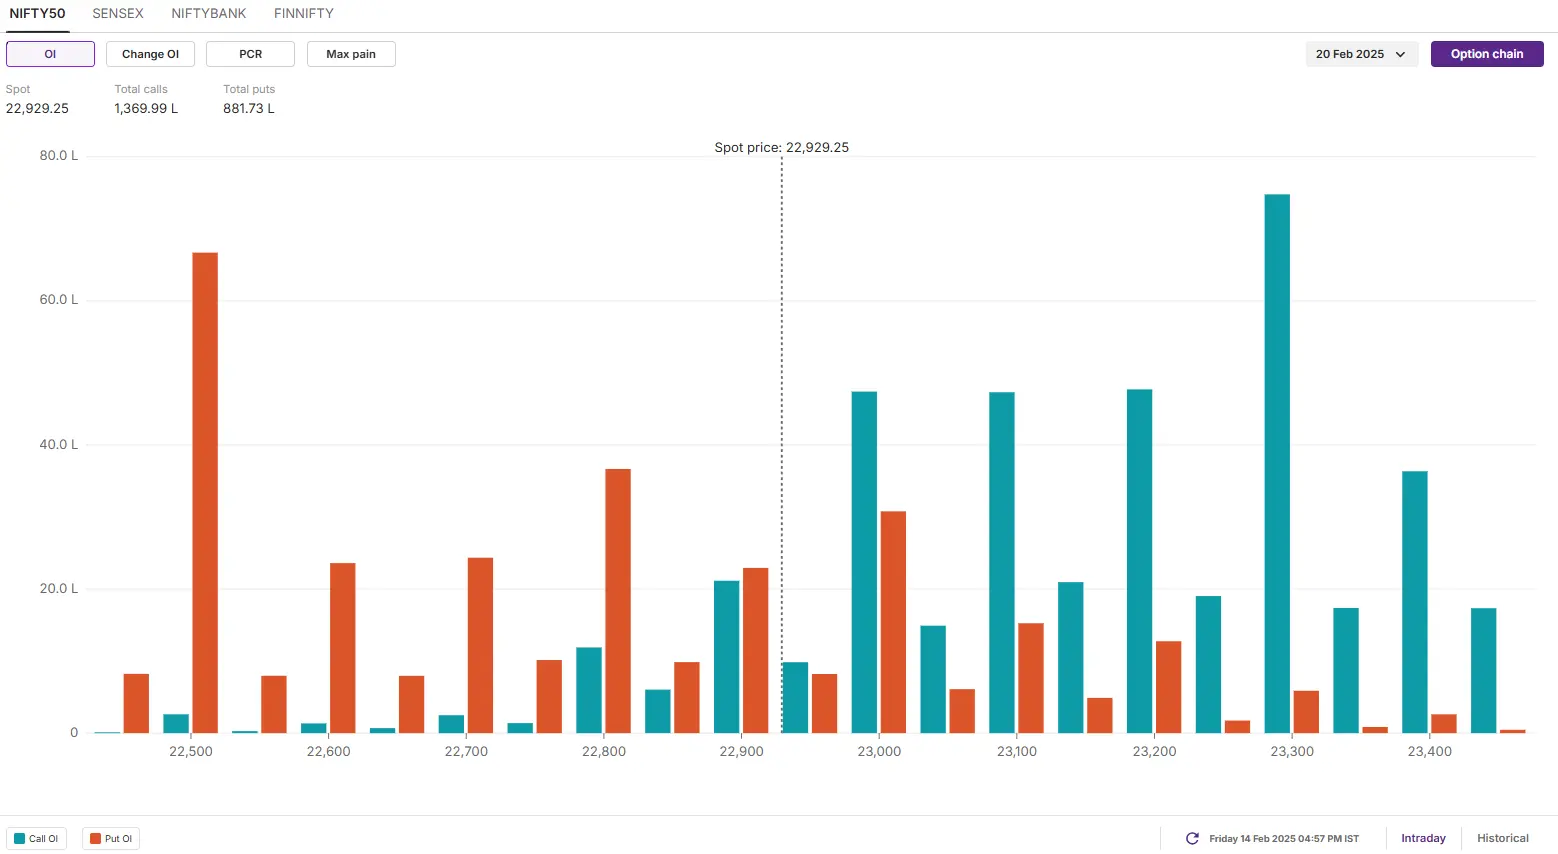
The open interest data for the 23 February expiry saw significant call options build-up at 23,300 strike, indicating resistance for the index around this level. On the flip side, the put base was seen at 22,500 strike, pointing resistance for the index around this level.
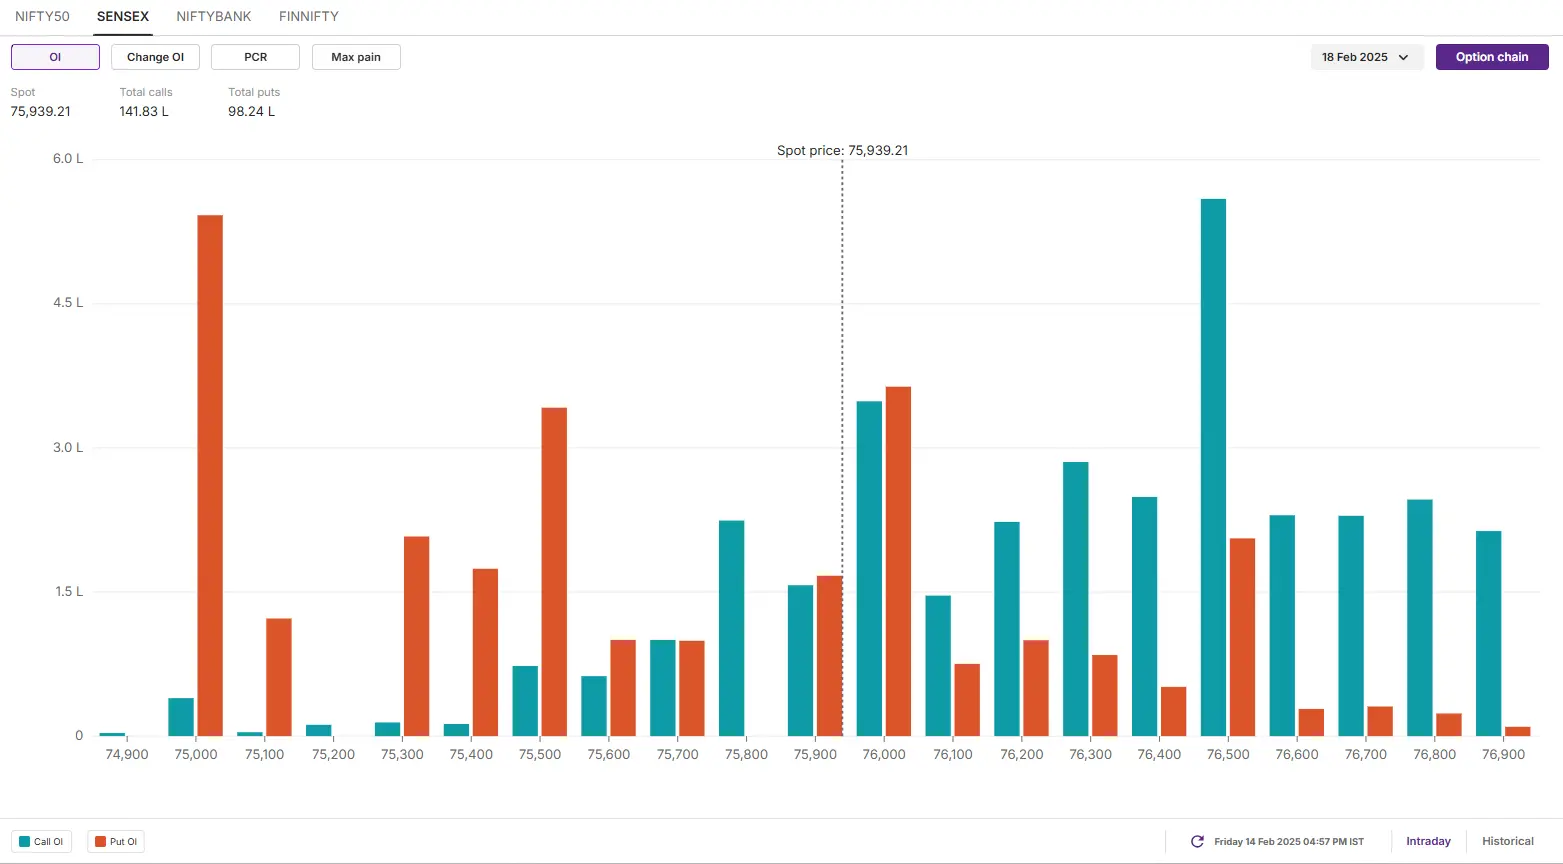
SENSEX
- Max call OI: 76,500
- Max put OI: 75,000
- (20 Strikes from ATM, Expiry: 18 Feb)
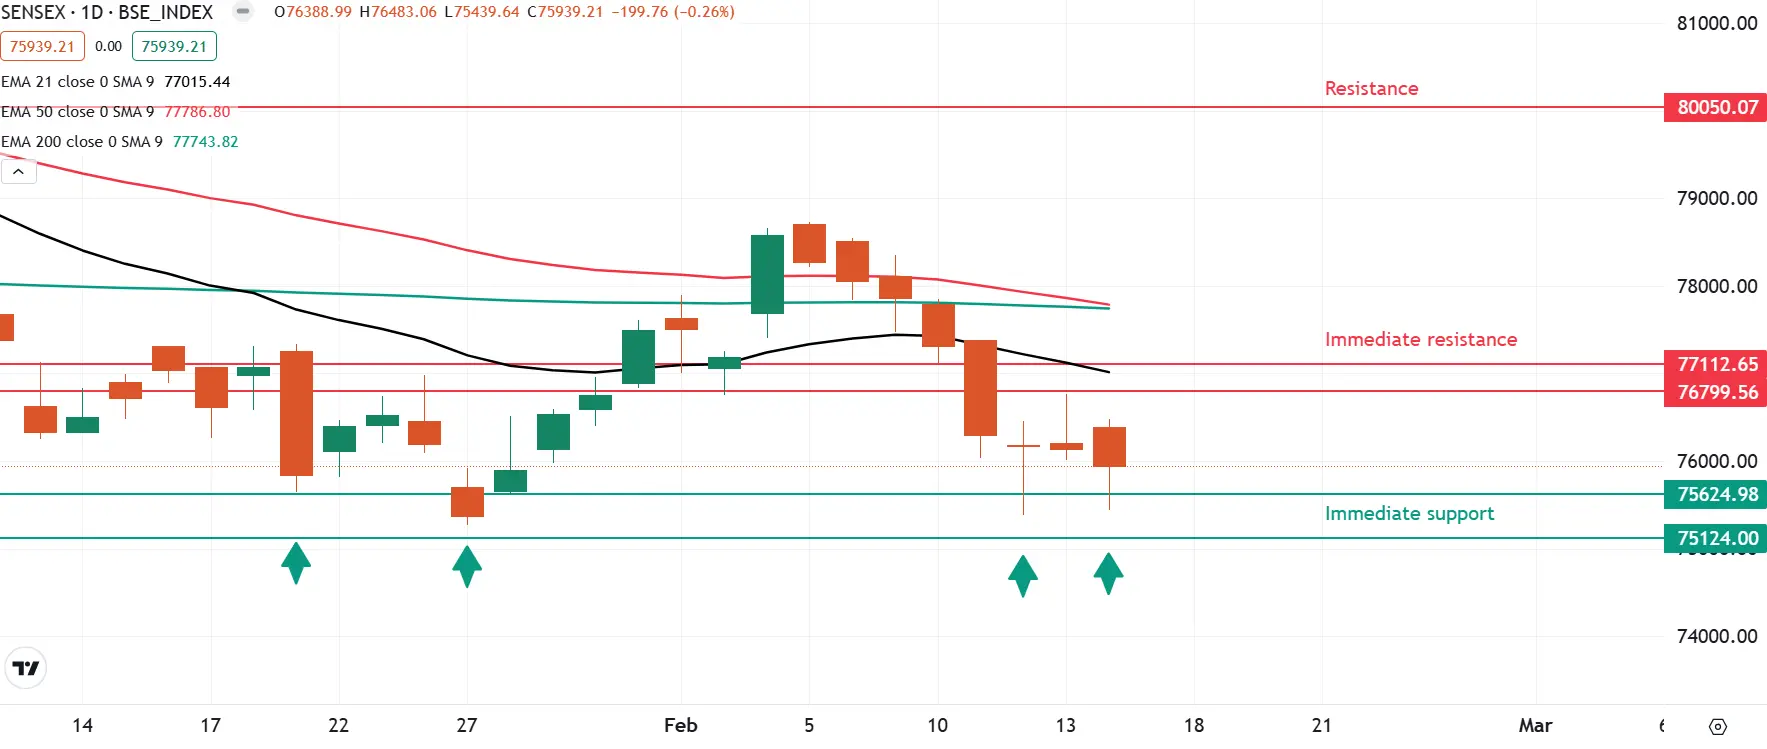
The SENSEX remained volatile, extending its losing streak for the eighth consecutive day and forming a bearish candlestick pattern on the daily chart. However, the index rebounded from the critical support zone of 75,100, marking the fourth time it has found support in this range since January.
From a technical perspective, the index continues to maintain a bearish structure on the daily chart, forming a pattern of lower highs and lower lows. Additionally, it remains below key exponential moving averages—21, 50, and 200-day—reinforcing the negative trend. In the coming sessions, traders should closely watch the 75,100 support zone; a decisive close below this level could signal further weakness. Conversely, if the index rebounds to 76,500, it may extend the recovery toward the 77,100 zone.
The open interest data for the February 18th saw significant call build-up at 76,500 strike, hinting at resistance for the index around this zone. On the flip side, the put base was seen at 75,000 strike, suggesting support for the index around this level.
FII-DII activity
Stock scanner
- Long build-up: Nil
- Short build-up: Deepak Nitrite, Varun Beverages, Kalyan Jewellers, Glenmark Pharamceuticals, Angel One and Adani Green
- Top traded futures contracts: ICICI Bank, HDFC Bank, Reliance Industries, State Bank of India and Deepak Nitrite
- Top traded options contracts: Deepak Nitrite 2000 PE, Deepak Nitrite 1900 PE, Dixon 14000 PE, Adani Enterprises 2200 PE and Deepak Nitrite 1950 PE
- Under F&O ban: Manappuram Finance
In Futures and Options or F&O, long build-up means an increase in Open Interest (OI) along with an increase in price, and short build-up means an increase in Open Interest(OI) along with a decrease in price. Source: Upstox and NSE.
Disclaimer: Derivatives trading must be done only by traders who fully understand the risks associated with them and strictly apply risk mechanisms like stop-losses. The information is only for consumption by the client and such material should not be redistributed. We do not recommend any particular stock, securities and strategies for trading. The securities quoted are exemplary and are not recommendatory. The stock names mentioned in this article are purely for showing how to do analysis. Take your own decision before investing.
About The Author
Next Story


