Market News
Trade setup for Feb 14: NIFTY50 faces resistance at 10-EMA, Trump’s reciprocal tariffs add uncertainity
.png)
4 min read | Updated on February 14, 2025, 07:31 IST
SUMMARY
The NIFTY50 index surrendered all its intraday gains and faced resistance around 23,250 zone, its 10-day exponential moving average. Unless the index reclaims this zone on a closing basis, the index may face selling pressure at higher levels.
Stock list

The NIFTY50 index ended the weekly expiry on a flat note and ended the volatile session on a negative note for the seventh day in a row. | Image: Shutterstock
Asian markets @ 7 am
- GIFT NIFTY: 23,191 (+0.41%)
- Nikkei 225: 39,248 (-0.54%)
- Hang Seng: 22,148 (+1.59%)
U.S. market update
- Dow Jones: 44,711 (▲0.7%)
- S&P 500: 6,115 (▲1.0%)
- Nasdaq Composite: 19,945 (▲1.5%)
U.S. indices advanced on Thursday after President Donald Trump announced plans for "fair and reciprocal" tariffs on trading partners but delayed their implementation. Investors largely shrugged off the fresh tariff proposal, with markets reacting calmly to the possibility of duties taking effect as early as April.
Meanwhile, economic data signaled persistent inflationary pressures. The Producer Price Index (PPI) for January rose 0.4%, surpassing expectations of 0.3%, indicating that wholesale inflation remains sticky.
NIFTY50
- February Futures: 23,153 (▼0.1%)
- Open interest: 2,30,306 (▼1.7%)
The NIFTY50 index ended the weekly expiry on a flat note and ended the volatile session on a negative note for the seventh day in a row. The index swung between gains and losses as investors weighed easing domestic inflation against concerns over hotter-than-expected U.S. inflation and escalating U.S. tariffs tensions, capping upside momentum.
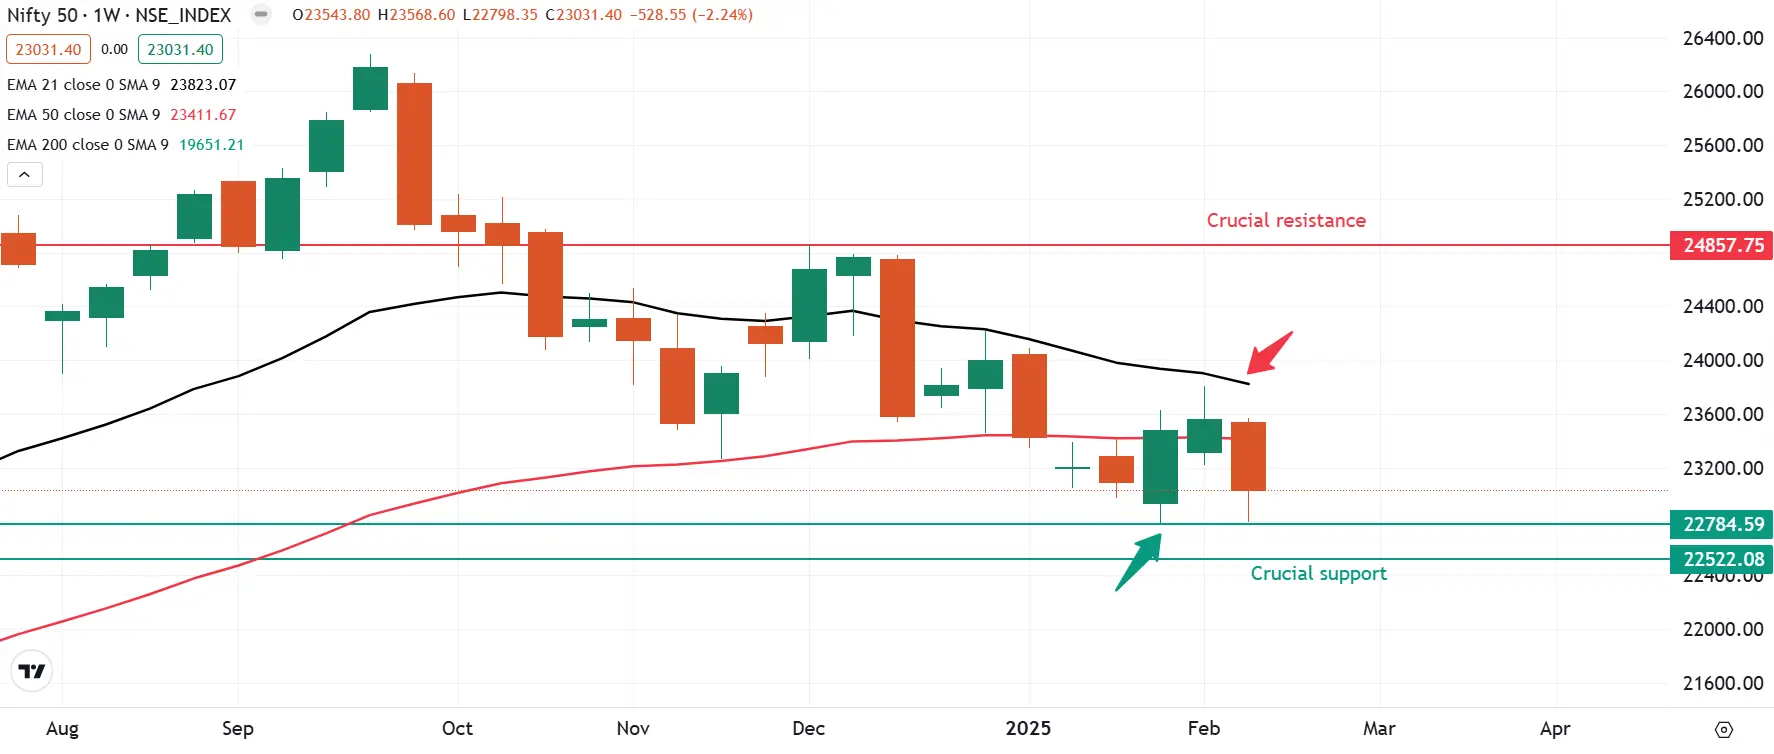
The weekly chart of the NIFTY50 index currently suggests weakness in its technical structure. Traders should closely watch the weekly close for further cues. A close below the previous week's low and the psychologically significant 23,000 level would indicate further downside. Conversely, if the index manages to hold above its previous week’s low on a closing basis, it could signal continued consolidation. A bullish resurgence, however, would require the index to reclaim the key resistance zone of 23,800 on a closing basis.

SENSEX
- Max call OI: 77,000
- Max put OI: 75,000
- (30 Strikes from ATM, Expiry: 18 Feb)
The SENSEX also failed to sustain its intraday gains and faced resistance around the immediate swing low of the 76,700 zone. The index also extended its losing streak for the seventh day in a row, reflecting sell on the rally sentiment.
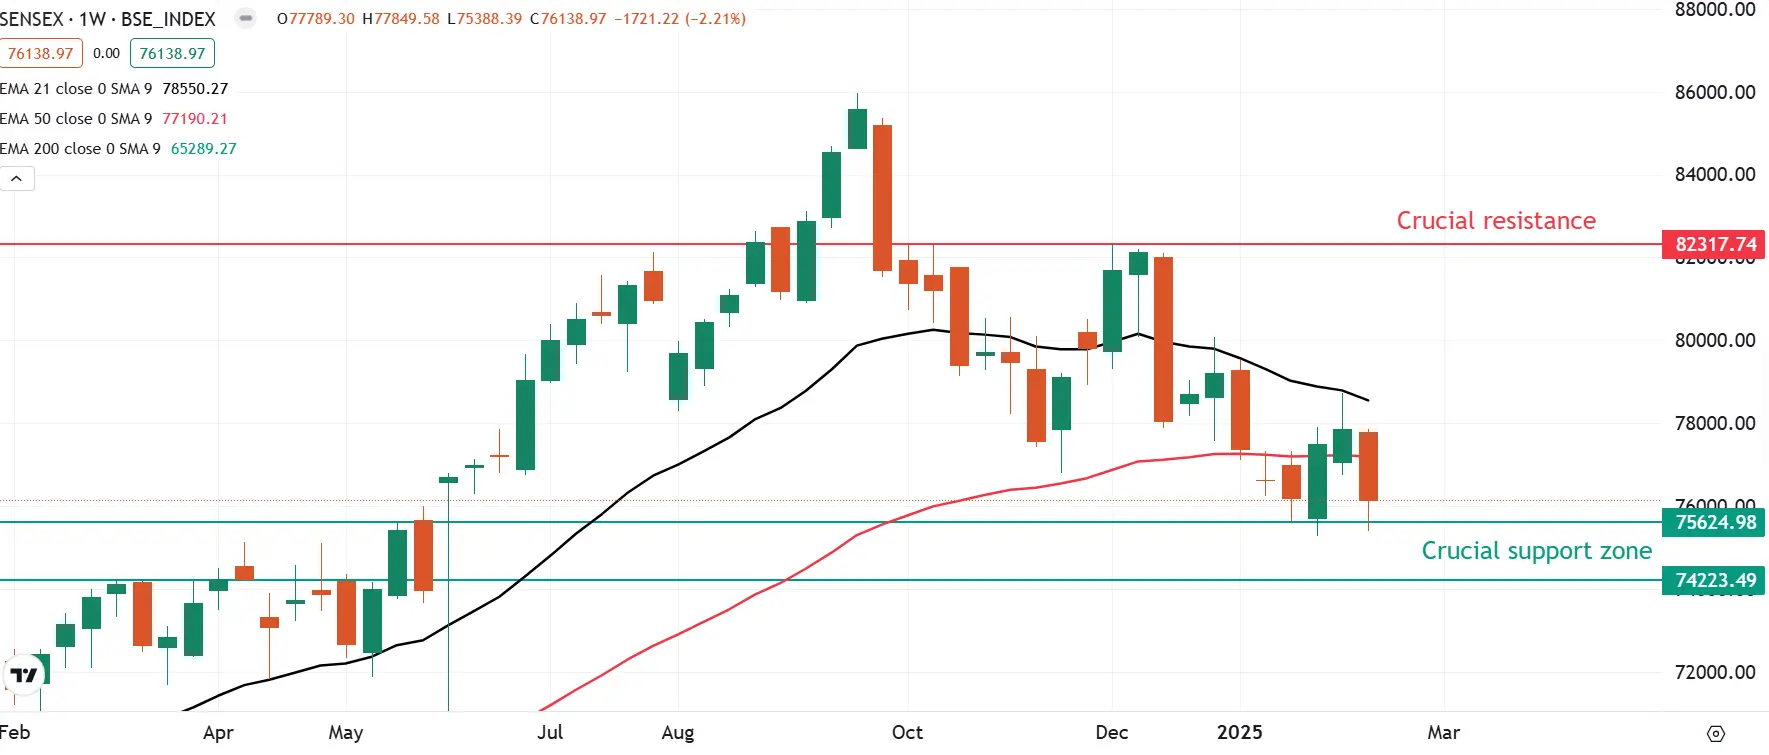
The technical structure of the SENSEX as per the weekly charts remains weak as the index is currently trading below 21 and 50 weekly exponential moving average (EMA). Ahead of the weekly close, traders can monitor the crucial support zone of 75,000. A close belwo this zone will signal further weakness on the index. On the other hand, if the index protects previous week’s low (76,756) on closing basis, the trend may remain sideways with resistance around the 21 weeklty EMA (78,550).

FII-DII activity
Stock scanner
- Long build-up: Muthoot Finance, SBI Cards, APL Apollo Tubes and RBL Bank
- Short build-up: KEI Industries, Adani Enterprises, PI Industries, United Breweries and BSE
- Top traded futures contracts: Kotak Mahindra Bank, Bajaj Finance, HDFC Bank, ICICI Bank, ICICI Bank and
- Top traded options contracts: Bajaj Finance 8500 CE, Lupin 2100 CE, Kotak Mahindra Bank 2000 CE, Bajaj Finance 8400 CE and HAL 3700 CE
- Under F&O ban: Manappuram Finance
In Futures and Options or F&O, long build-up means an increase in Open Interest (OI) along with an increase in price, and short build-up means an increase in Open Interest(OI) along with a decrease in price.
Source: Upstox and NSE.
Disclaimer: Derivatives trading must be done only by traders who fully understand the risks associated with them and strictly apply risk mechanisms like stop-losses. The information is only for consumption by the client and such material should not be redistributed. We do not recommend any particular stock, securities and strategies for trading. The securities quoted are exemplary and are not recommendatory. The stock names mentioned in this article are purely for showing how to do analysis. Take your own decision before investing.
About The Author
Next Story

