Market News
Trade Setup for Dec 9: NIFTY50 reclaims 20 weekly EMA nears pivotal 25,000 mark
.png)
4 min read | Updated on December 09, 2024, 01:49 IST
SUMMARY
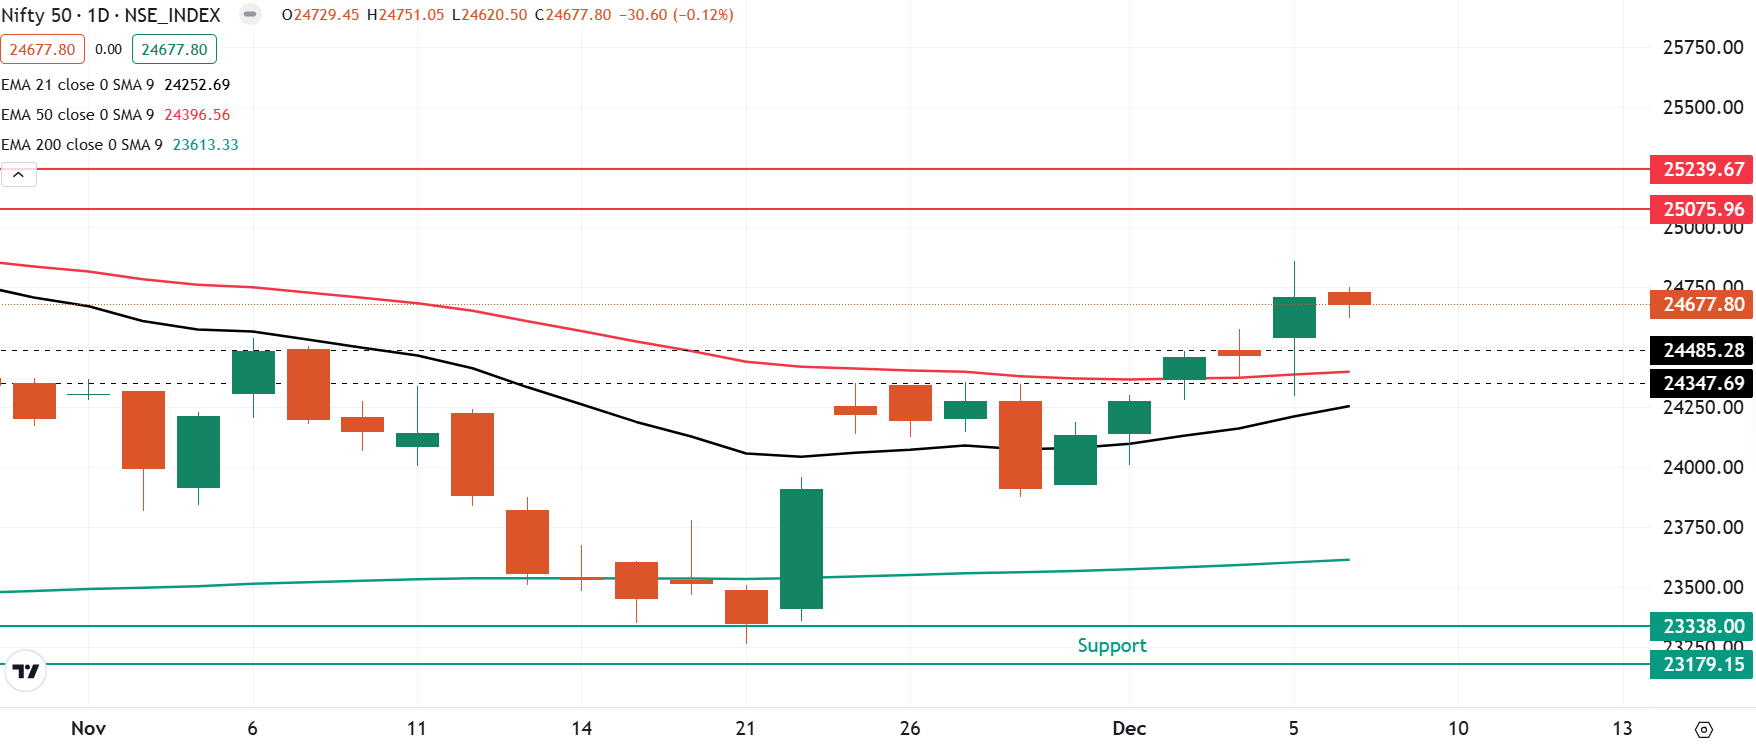
The NIFTY50 index has immediate resistance around the 24,850 zone. A break above this level on a closing basis can potentially test the 25,000 mark. On the other hand, immediate support is visible around the 24,400–24,300 zone.
Stock list

The technical structure of the NIFTY50 index as per the daily chart looks sideways to bullish.
Asian markets @ 7 am
- GIFT NIFTY: 24,726.50 (-0.01%)
- Nikkei 225: 39,236.84 (+0.37%)
- Hang Seng: 19,732.28 (-0.67%)
U.S. market update
- Dow Jones: 44,642 (▼0.2%)
- S&P 500: 6,090 (▲0.2%)
- Nasdaq Composite: 19,859 (▲0.8%)
U.S. indices ended Friday's session on a mixed note after investors digested November's non-farm payrolls report. The U.S. economy added 2,27,000 jobs in November, which was slightly better than the Street's estimate of 2,14,000. Meanwhile, traders ended Friday's session with 90% of fed funds futures contracts reflecting a 90% probability of a 0.25% rate cut at the Fed's December meeting.
NIFTY50
- December Futures: 24,783 (▲0.0%)
- Open interest: 4,54,315 (▲1.6%)
The NIFTY50 index broke its five-day winning streak and ended the Friday’s session on a flat-to negative note. The index traded within the range of previous session’s candle, forming an inside candlestick pattern on the daily chart.
The technical structure of the index as per the daily chart looks sideways to bullish. The index is currently sustaining above all its short-term exponential moving averages (EMAs) like 21 and 50 with immediate support in the range of 24,350 to 24,500. Conversely, the resistance is visible around 25,000 to 25,200 zone. A break of this range may provide further clues to the traders.

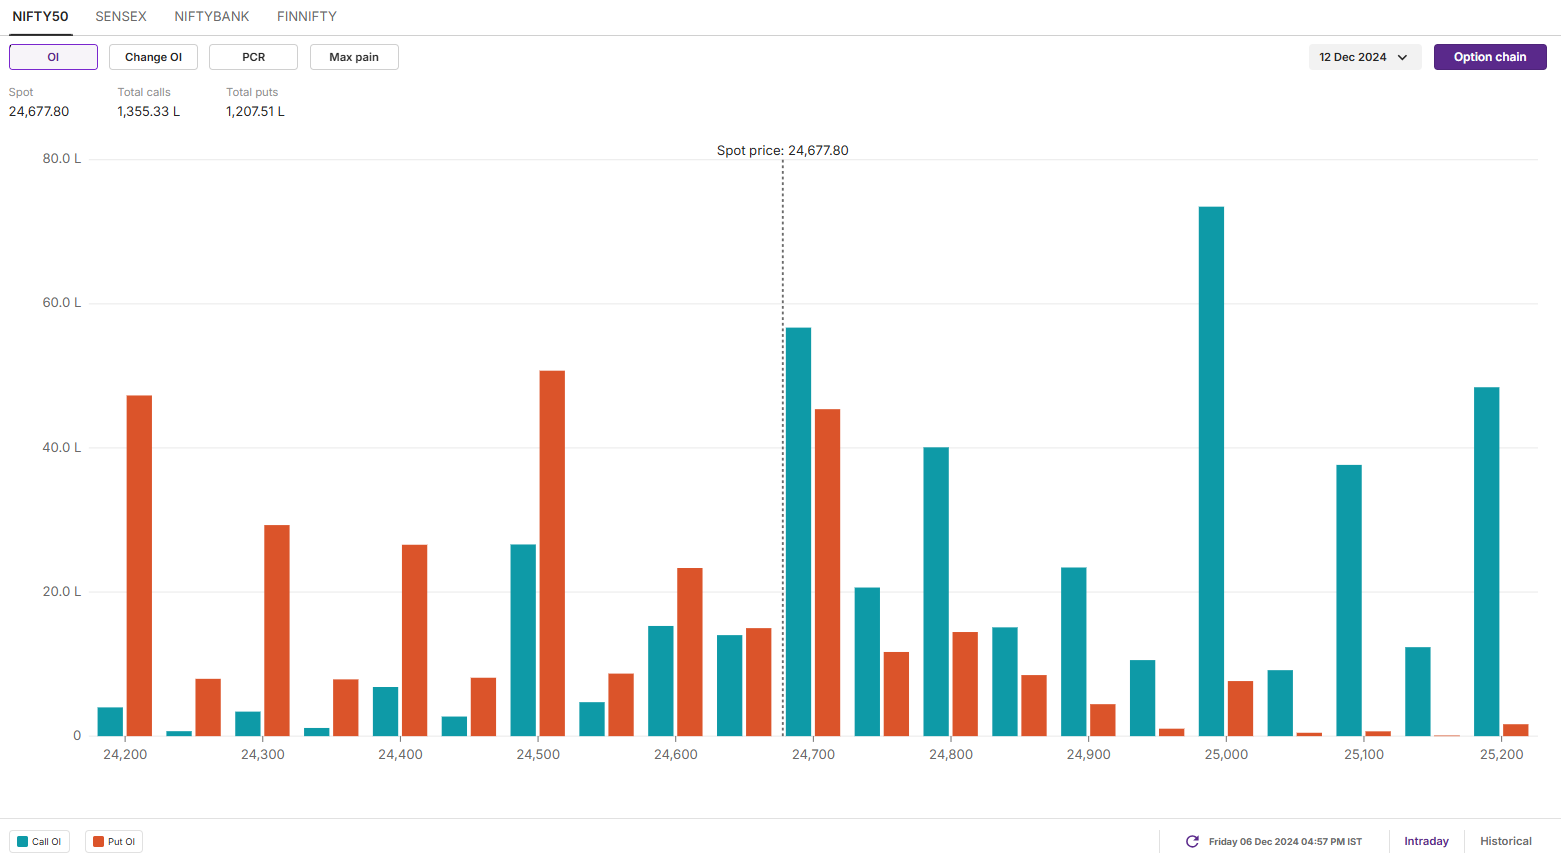
The open interest positioning of the traders saw siginificant call options placement at 25,000 strike, making this zone as the immediate resistance for the index. On the flip side, the put options base was build at 24,500 and 24,000 strikes, suggesting support for the index around these levels.

SENSEX:
- Max call OI: 84,000
- Max put OI: 78,000
- (Expiry: 13 Dec)
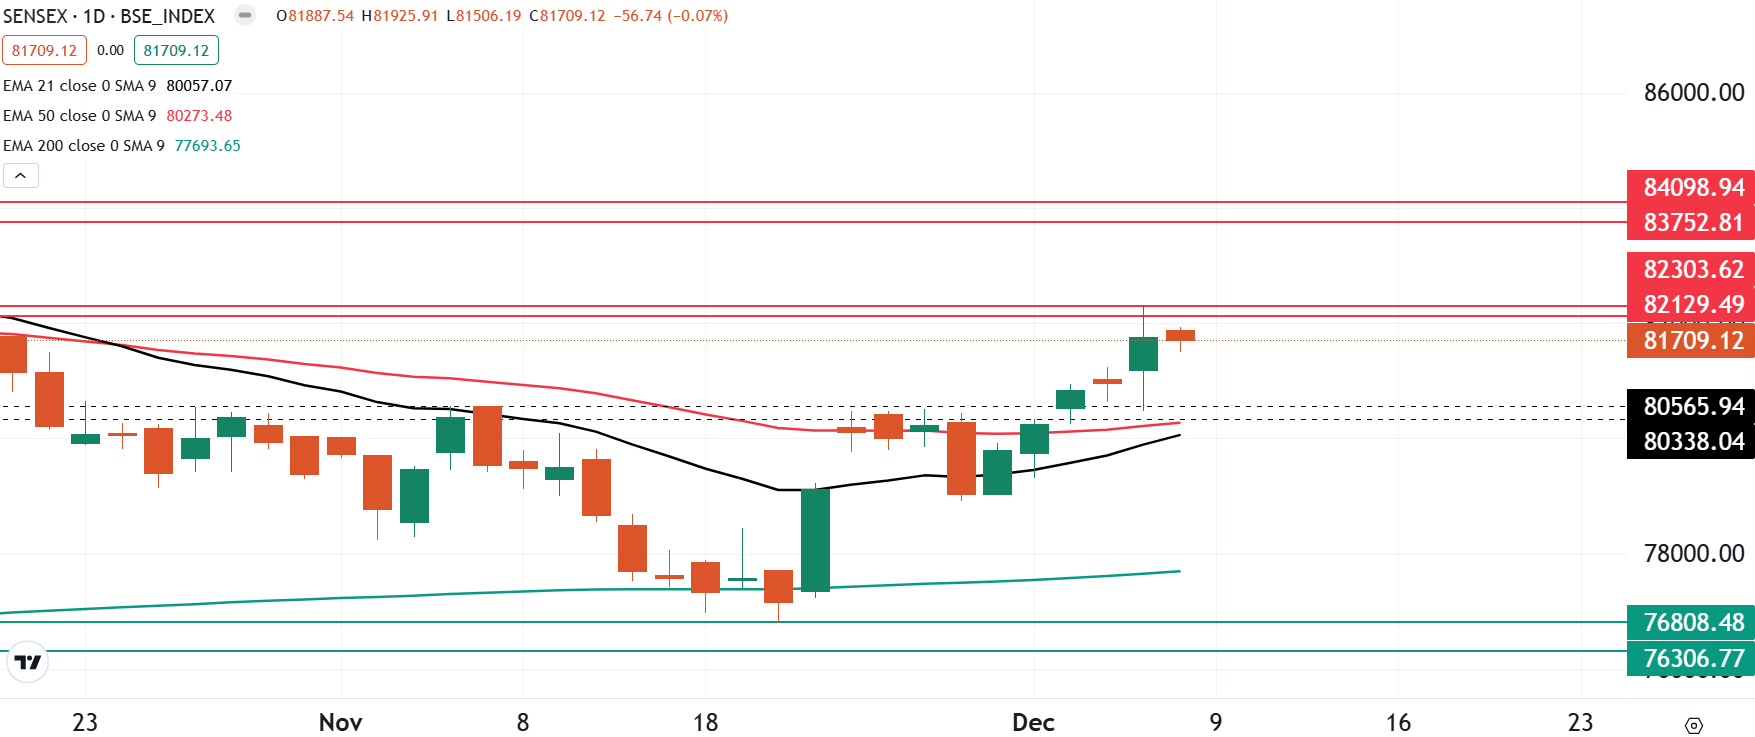
The SENSEX index snapped its five-day winning streak, closing Friday's session with a flat-to-negative performance. The index also formed an inside candle on the daily chart, signalling a pause after a sharp upmove.
The short-term trend of the SENSEX remains sideways to bullish with the immediate support around the 80,300 zone. Unless the index breaks this zone on closing basis, the trend may remain sideways to bullish with resistance around 80,300 zone. On the flip side, if index sustains the current momentum and captures 80,300 level on closing basis, then it may open the doors to fill the gap created aroud 84,000 zone.

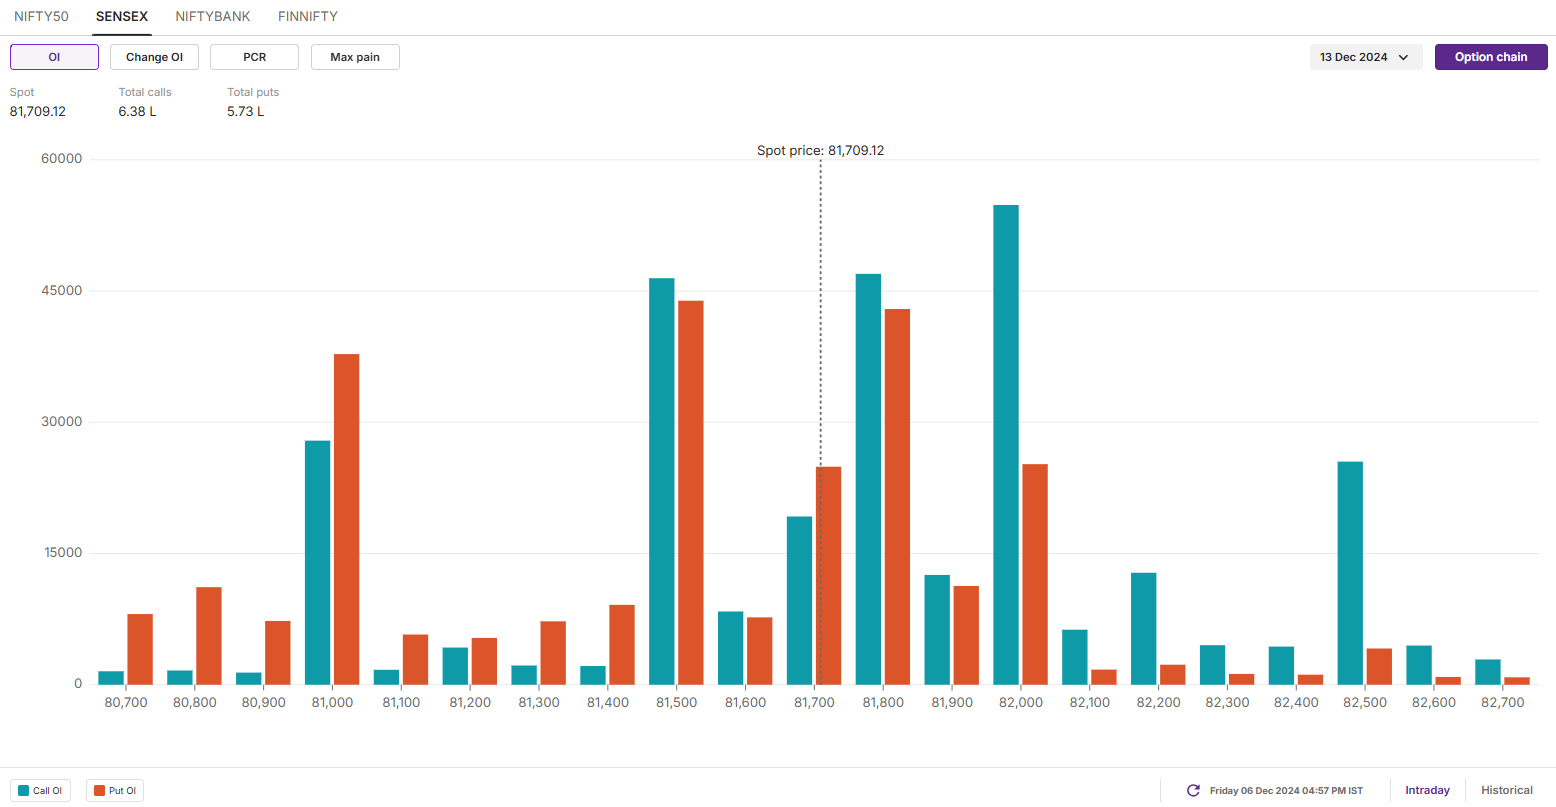
The open interest data for the 13 December expiry saw significant call options base at 82,000 strike, suggesting resistance for the index around this zone. On the contrary, the put base was seen at 81,500 and 81,000 strikes, indicating support for the index around these levels.

FII-DII activity
Stock scanner
- Long build-up: CESE, Angel One, CG Power, Jubilant FoodWorks and SJVN
- Short build-up: Can Fin Homes, Computer Age Management Services (CAMS), Tube Investments of India and Avenue Supermarts
- Under F&O ban: Granules India, Manappuram Finance, PVR Inox and RBL Bank
- Added under F&O ban: PVR Inox
In Futures and Options or F&O, long build-up means an increase in Open Interest (OI) along with an increase in price, and short build-up means an increase in Open Interest(OI) along with a decrease in price. Source: Upstox and NSE.
Disclaimer: Derivatives trading must be done only by traders who fully understand the risks associated with them and strictly apply risk mechanisms like stop-losses. The information is only for consumption by the client and such material should not be redistributed. We do not recommend any particular stock, securities and strategies for trading. The securities quoted are exemplary and are not recommendatory. The stock names mentioned in this article are purely for showing how to do analysis. Take your own decision before investing.
About The Author
Next Story

