Market News
Check earnings preview and options strategy for Wipro ahead of Q3 results
.png)
4 min read | Updated on January 17, 2025, 12:49 IST
SUMMARY
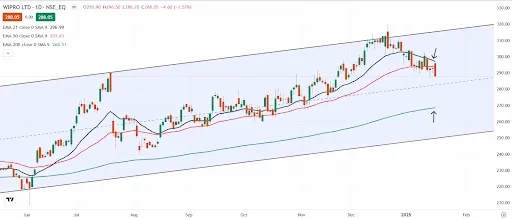
On January 16, Wipro slipped below its 21-day and 50-day EMAs, forming a bearish engulfing candle on the daily chart. This candlestick pattern is inherently bearish and indicates potential weakness, but its confirmation requires the subsequent candle to close below the low of the engulfing pattern.
Stock list

Open interest data of Wipro’s 30 January expiry shows a fresh addition of open interest at 290 strike.
According to estimates, Wipro’s Q3 revenue is expected to fall in the range of ₹22,150 to ₹22,210 crore, marking a 1-2% year-on-year (YoY) decline and a sequential drop of 1-3%. The company had recorded revenues of ₹22,302 crore in Q2 FY25 and ₹22,205 crore during the same quarter last year.
On the profit front, Wipro’s consolidated net profit is projected to grow by 8-10% YoY to ₹2,950 to ₹3,100 crore. However, this would represent a sequential decline of 4-6%. In comparison, the company reported a net profit of ₹3,227 crore in Q2 FY25 and ₹2,701 crore in Q3 FY24.
The EBIT margin is expected to contract by 40-60 basis points during the quarter, driven by seasonal weakness, wage hikes, higher furloughs, and cross-currency headwinds.
Investors will be watching closely for insights during the earnings call. Key areas of focus include Wipro’s revenue growth guidance for FY25, announcements of interim dividend, and management’s commentary on discretionary spending trends across verticals and the broader demand outlook.
Ahead of the Q3 earnings announcement, Wipro shares were trading 1.7% lower at ₹283 on Friday, January 17. Despite a 6% decline in share value so far this month, Wipro has delivered a strong performance in the calendar year 2024, with a 28% gain, significantly outperforming the NIFTY50 index, which rose 8.8% in the same period.
Technical View
Wipro slipped below its 21-day and 50-day exponential moving averages (EMAs) on January 16, signaling weakness on the daily chart. Additionally, the stock formed a bearish engulfing candle, a bearish candlestick pattern that suggests further downside. However, confirmation of the pattern requires the subsequent candle to close below the low of the reversal pattern.
The technical outlook for Wipro remains weak, with key support positioned at its 200 EMA. A decisive break below this level would indicate further downside potential. Conversely, if Wipro reclaims the high of the bearish engulfing candle formed on January 16, it would invalidate the pattern and signal a potential trend reversal.

Options build-up
Open interest data of Wipro’s 30 January expiry shows a fresh addition of open interest at 290 strike with highest call base established at 310 strikes. The options build-up indicates that Wipro may face resistance around these strikes.
On the other hand, the put base was seen at 280 strike, suggesting support for the IT major around this zone.
To better understand the price behaviour, let's take a look at how Wipro has moved over the last six quarters around its earnings announcements

Options strategy for Wipro
Based on options data suggesting a potential price movement of ±7.3%, traders have the opportunity to engage in either a long or short volatility strategy.
Disclaimer
Derivatives trading must be done only by traders who fully understand the risks associated with them and strictly apply risk mechanisms like stop-losses. The information is only for educational purposes. We do not recommend any particular stock, securities and strategies for trading. The stock names mentioned in this article are purely for showing how to do analysis. Take your own decision before investing.
About The Author
Next Story

