Market News
TCS Q1 earnings: How to plan an options trade ahead of its results?
.png)
4 min read | Updated on February 16, 2026, 13:19 IST


SUMMARY
Tata Consultancy Services shares have been consolidating between ₹3,000 and ₹4,000 for over 3 months. With the upcoming earnings announcement, options market is implying a move of ±4.5% ahead of July 25 expiry. Traders can anticipate a directional move once the stock breaks this range.
Stock list

TCS revenue could increase by 1.6% on a quarterly basis, while net profit could dip by over 3%
Experts believe the global IT service provider’s first quarter revenue may increase in the range of 4%-5% year-on-year between ₹62,086 to ₹62,491 crore. On a quarter-on-quarter basis, revenue could increase by 1.6%. Despite uptick in revenue, the street expects net profit may fall between 3 % to 5% from Q4 FY24, ranging between ₹11,771 crore to ₹12,140 crore.
TCS’s Earnings Before Interest Tax (EBIT) margins are expected to decline during the June quarter due to wage hikes and lower utilisation rates.
For the March quarter of FY24, TCS reported a consolidated net profit of ₹12,502 crore, up 12.6% over the previous quarter. Its revenue from operations grew by just 1% to ₹61,237 crore during the same period. The company declared an interim dividend of ₹28 per share.
Ahead of the results, TCS shares are trading flat at ₹3,918 per share (+0.23%) but are up 3.0% year-to-date, underperforming the NIFTY50’s 11.9% during the same period.
Technical view
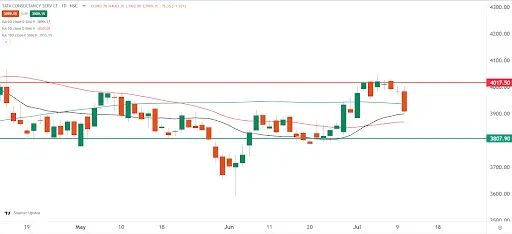
The technical structure of Tata Consultancy Services (TCS) remains range-bound as the stock has traded between the 4,000 and 3,500 levels for the past three months. After regaining the 100-day moving average on 1 July, the index surrendered it on 10 July and is currently stuck between the 100 and 50-day moving averages.
On 10 July, TCS formed a bearish candlestick on the daily chart, indicating potential weakness or a continuation of range-bound activity. Until the stock breaks the zones marked below on the chart, it may remain range-bound and choppy. A breach of this range will give traders better clues for directional strategies.
Options overview
The open interest positioning on TCS ahead of its first quarter results has maximum call build-up at 4,000 strike. On the other hand, the put base is spread at multiple strikes from 3,900 to 3,700. Moreover, significant open interest in TCS is also placed at 3,900 strike of both call and put options, pointing at the range-bound activity.
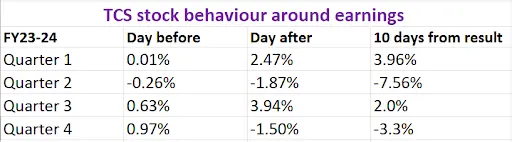
Before moving to strategies, let’s examine how the TCS share price has moved around its earnings announcement in the last four quarters.
How to plan an options strategy for TCS?
With an implied movement of ±4.5% from the options market, traders can strategise using Long and Short Straddles to capitalise on anticipated volatility and price movements.
Disclaimer
Derivatives trading must be done only by traders who fully understand the risks associated with them and strictly apply risk mechanisms like stop-losses. The information is only for educational purposes. We do not recommend any particular stock, securities and strategies for trading. The stock names mentioned in this article are purely for showing how to do analysis. Take your own decision before investing.
About The Author
Next Story


