Technical Analysis
Written by Upstox Desk
Published on October 01, 2025 | 5 min read
You want your invested money to give you the best returns, so why not make smarter investment decisions using technical analysis? Watch our simple and easy-to-understand video from the ‘Learn With Upstox’ series to learn more about technical analysis and how you can use it to your advantage.
Hello and welcome to our educational series - Learn with Upstox.
Here you’ll find theories - from the easiest to the hardest investment concepts, explained in a simple yet practical manner.
In this article - we will talk about technical analysis in depth.
We will learn what technical analysis is and how it is used.
Introduction
Technical analysis involves the study of charts based on historical data. Which means that the stocks have been moving for years, they have been keeping their open, high, low, close, resistance, support and a lot of information like this is available to us. Patterns are traced on this information to do the technical analysis.
The information you’re getting here might not be available in a book or some other platform, because this is a very practical approach. As a trader, I will discuss things which will actually be useful to you. All the components that I’m going to share in this article will have a separate blog in this series.
Technical Analysis
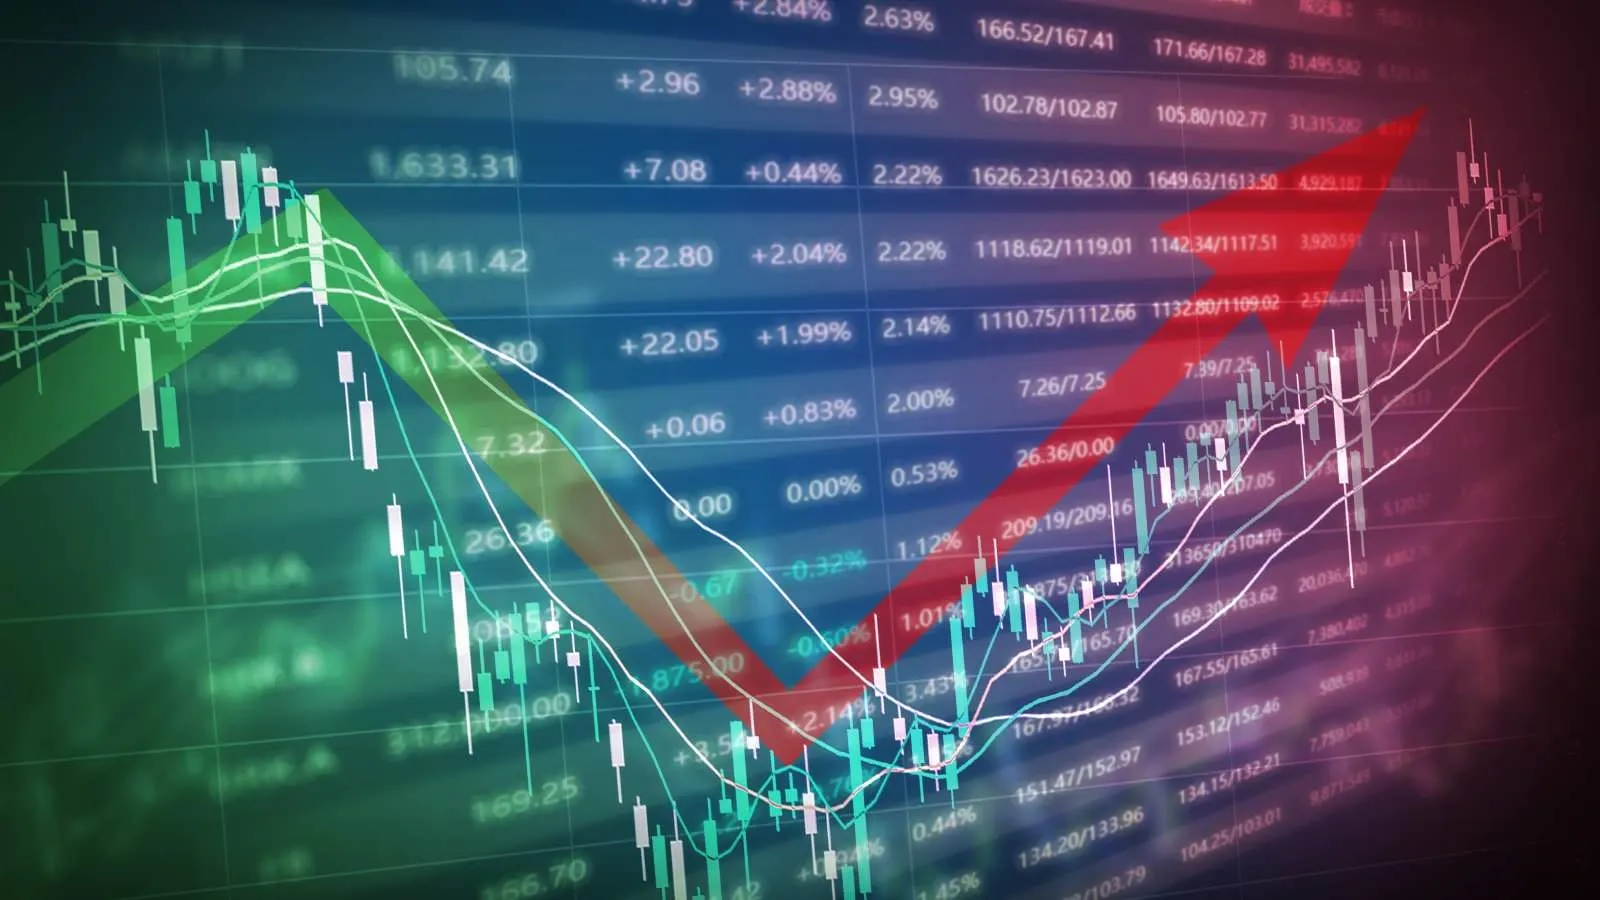
To start with technical analysis, let’s consider a chart.
When we open this chart, we see a lot of red and green lines. These small red and green blocks which we can see are called Candlesticks.
There are many types of candlesticks like open, high, low, close. The green one is called a Bullish candle and the red one is called a Bearish candle.
These candles together make a thing, which is called the Chart Pattern like the double top, double bottom etc. So, a group of candles makes a chart pattern that helps us understand the market structure.
Indicators
A study is done which we call the indicator. Indicators are derived from price and volume.
The best and famous technical analysts have made some indicators like:
- Bollinger Bands
- Supertrend
- Relative Strength Index
- Average Directional Index
- Ichimoku cloud etc
These indicators help us decide when to enter and exit the market.
Trendlines
The next component is called a trendline. Trendline is made up of two words - trend and line.
There are trends like it’s up trend when the market is going up, a downtrend when the market is going down or a sideways trend.
Whenever there is a trending market, up or down, you draw a trendline joining points where the price bounces or jumps and goes up and this is what happens in an Uptrend.
In a Downtrend, the line marks those angles where the market goes down after taking resistance.
This is a trendline. There is another component called the Horizontal line.
Horizontal Line
This is a straight line used to connect price points which are at a similar level. This helps you get a range.
There are more components like the Fibonacci retracement.
Fibonacci Retracement
Fibonacci retracement is a tool, when plotted using top and bottom of a range, provides price levels based on fibonacci ratios.
Data Reading
Next up is data reading. It is a pretty important component related to most others.
When you go on an exchange’s website, you get a lot of types of reports. A lot of data. Like how much trading took place for a stock, what was the turnover, the volume, the open interest etc.
Open Interest
Open Interest is a word that shows the interest of a stock. If some stock has a high open interest, it means that people’s interest in that stock is growing. If the interest is falling, it means that people’s interest in that stock is falling.
Open Interest is the total number of outstanding derivative contracts (futures or options) that have not been settled.
Yet another thing is called the Option Chain which shows the open interests.
Bhavcopy is a file which shows the volume of all of the futures and options.
Which means that when we study all these components together, we can do the technical analysis. It is very useful for intraday trading and short term traders.
On the other hand, fundamental analysis is usually required for long term traders. But even if, fundamentally a stock looks good, we would still need technical analysis to know when to enter and exit. And hence technical analysis is very important for even investors.
But technical analysis and fundamental analysis are both required. One always needs a little bit of knowledge of both.
And that is all for today.If you want to read more about investments, feel free to browse through our blog as we have an entire series dedicated to this. You could also check out our YouTube channel.
Thank you and have a good day!
About Author
Upstox Desk
Upstox Desk
Team of expert writers dedicated to providing insightful and comprehensive coverage on stock markets, economic trends, commodities, business developments, and personal finance. With a passion for delivering valuable information, the team strives to keep readers informed about the latest trends and developments in the financial world.
Read more from Upstox


Upstox is a leading Indian financial services company that offers online trading and investment services in stocks, commodities, currencies, mutual funds, and more. Founded in 2009 and headquartered in Mumbai, Upstox is backed by prominent investors including Ratan Tata, Tiger Global, and Kalaari Capital. It operates under RKSV Securities and is registered with SEBI, NSE, BSE, and other regulatory bodies, ensuring secure and compliant trading experiences.
Related articles

Share Market
How the RBI Defends the Indian Rupee through Strategic Forex Intervention13 min read | Written by Bidita Sen

Share Market
Impact of Rupee Depreciation on the Stock Market3 min read | Written by Subhasish Mandal

Share Market
India's LPG Crisis Is the Wake-Up Call. Renewables Are the Answer6 min read | Written by Pradnya Surana
Share Market
What is the Difference Between Small Gain & Capital Gain?4 min read | Written by Dev Sethia

Share Market
Types of Stocks: Large Cap, Mid Cap, Small Cap Explained5 min read | Written by Pradnya Surana