What is Fibonacci Intraday Trading Strategy & How to Draw

Here is a simple intraday trading setup based on the Fibonacci retracement technique. The chart timeframe for this intraday strategy is 3 minutes.
Interestingly, you can use this setup to ** trade stocks**, equity indices, commodities and or even currencies. Further, you can use any instrument to trade it i.e. cash (equity shares), ** futures or options**. Also, with this strategy, you can trade in a bullish as well as a bearish market.
We will use Fibonacci retracement to look for a trade setup and a candlestick pattern to confirm it. Hence this strategy is going to be a combination of both Fibonacci retracement and a candlestick pattern.
Let’s understand the step-by-step process as to how we analyze and trade this strategy. We already have published an article about using this Intraday Fibonacci strategy to trade bullish or long-only setup**.**
In this article we will talk about how we can use the same strategy to trade bearish or short only setup.
Steps of the setup: We’re analysing the Nifty spot chart in the example below.
Step 1 : Look for a low and a high point in the chart. The price chart should have shown a clear and strong downtrend. Fibonacci Retracement is applied by connecting one high point and one low point. Let's call the high point as A and the low point B. We will look at a price chart on the ** Upstox Pro Web Platform.**
Step 2. Apply the Fibonacci retracement tool. Start with point 1 (high) on the tool and drag your mouse till point 0 (low) and drop it there. Now look for a 61.8% retracement.
Let’s understand step 1 & step 2 with the help of an example.
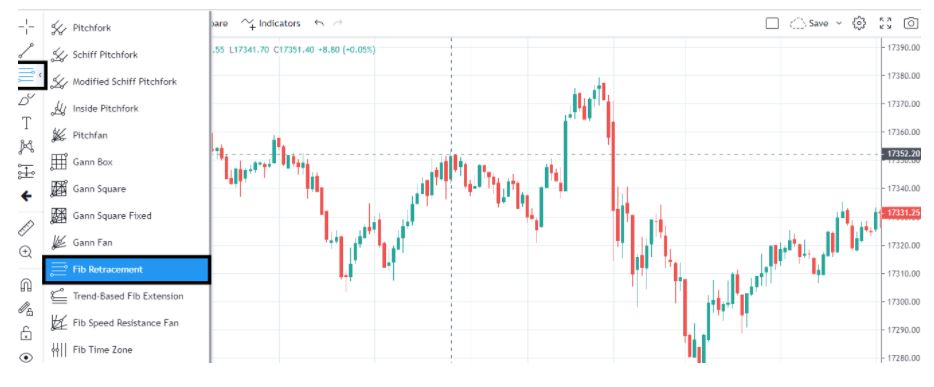
You may want to know where you can find the Fibonacci retracement tool in the chart. Once you open the price chart, on the left-hand side, you can see the list of tools. The third option from the top is where you need to go and click on that option. You will find the ‘Fib Retracement’ tool there.
Now coming back to step 1 & step 2 for connecting the high and low points and finding the fib retracement level of 61.8%
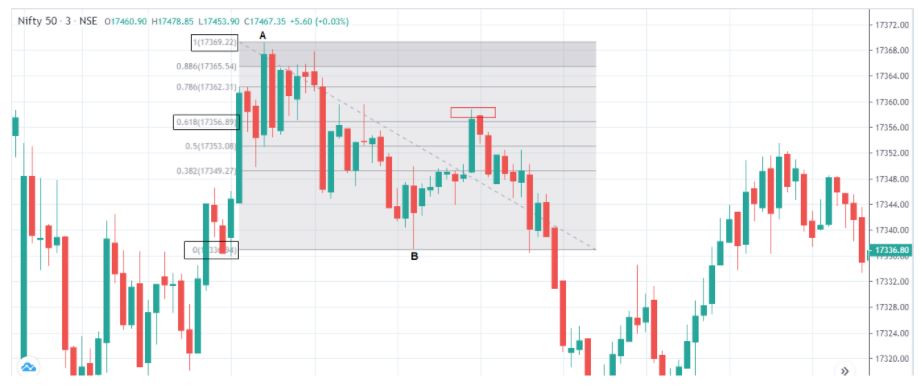
The A point in the chart is the high point and the B point in the chart is the low point. You can see a strong downtrend from point A to point B. Now, we take the Fib retracement tool and connect the points A (high) and B (low).
Once we have connected points A and B, we have to look for 61.8% retracement. Retracement is also referred to as a pullback. In the above context, it is pulling back the downtrend or retracing the downtrend from point B. You can see the Nifty retracing to 61.8% i.e. 17356.89 (marked the level in the red box)
Typically, this level should act as a strong resistance and price should again resume the downtrend from this level.
So, what we have here is the trade setup. Now to find out a trade, price needs to give some confirmation in the form of a candlestick pattern.
Step 3 : At 61.8% fibonacci retracement level, we have to look for a bearish candlestick pattern.
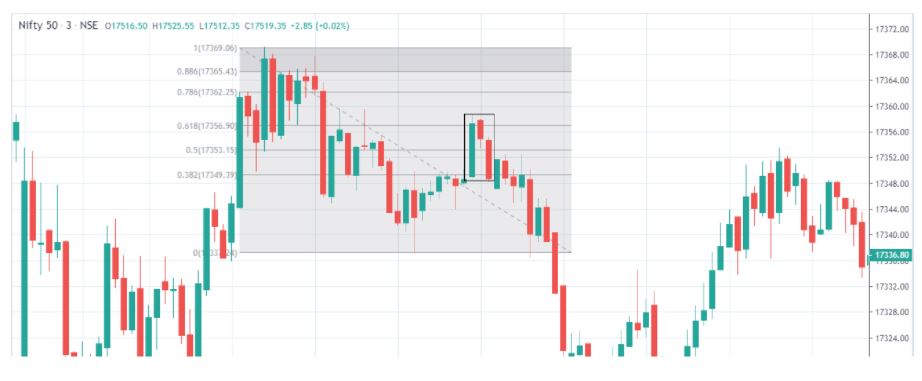
In the above chart, you could see an evening star candlestick pattern marked in a black box. It’s a three candle pattern and somewhat looks like an inverted V shape pattern.
This confirms our analysis. After getting a retracement of Fibonacci 61.8% and a bearish candlestick pattern, we will look to trade this setup. Now that the analysis and confirmation is done, let us see how we can trade the setup with a defined entry, exit and stop loss.
Step 4 : Let's understand with the help of a chart as to what price we enter and when do we exit (target)
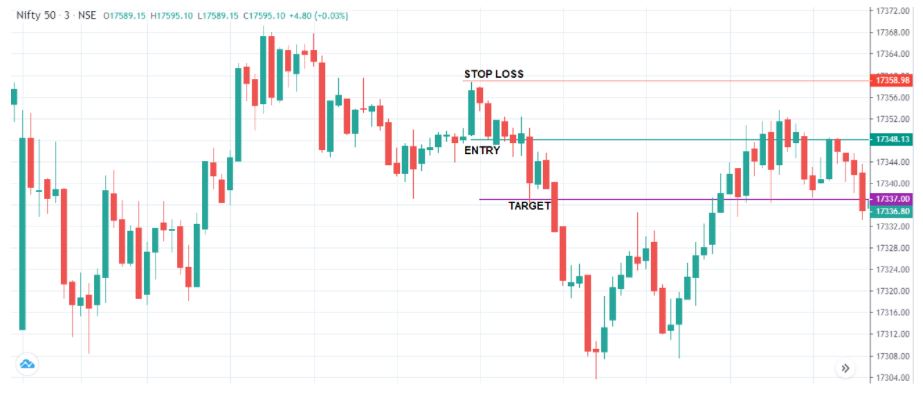
You can see the GREEN line (17348.13), where the evening star pattern was formed at 61.8% level. That is our entry point. We will enter around those levels at 17348. Since Nifty spot can’t be traded, you can look to trade Nifty futures or options. If you choose to trade options, one way to go about it is to buy an ATM (at the money) strike put option. In our example, the market price is 17348 and the nearest strike price seems to be the 17350 put option. Since it’s an intraday trade, you can go for a weekly expiry rather than a monthly expiry contract.
Now, Let’s come to the stop-loss. You can see the RED line (17358.98**)** just marginally above 61.8% retracement level. That's 11 points above the entry point of 17348. If the Nifty doesn’t go down and reverses towards the upward direction and hits 17358.98 (our stop loss) we will take a small loss and exit our position.
Since it’s an intraday and a quick trade, the timeframe being 3 minutes, we will aim for a risk to reward of 1:1. In our example the risk being 11 points, we will aim for a target of 11 points too from our entry price which comes to 17337 (17348
- 11)
You can see the PURPLE line (17337). Once our price hits 17337, we will exit our 17350 put option position.
We hope this intraday short fibonacci strategy was simple and easy to understand. You can try spotting it on charts and see if you are able to identify such setups.
Until then, happy trading!