How Trend Analysis Enables Trading Activities?
Written by Pradnya Surana
Published on December 03, 2025 | 3 min read

Ever wondered how seasoned traders decide when to buy or sell stocks? Well, these decisions aren't any guesswork, but they are an outcome of an applied science called trend analysis.
Behind every trading decision, there is a systematic process of analysing data and identifying patterns. This transforms raw market data into actionable trading decisions.
What is Trend Analysis in Trading?
In stock market investing, trend analysis answers a simple questions like, is this stock generally going up, going down or moving sideways?
It is the practice of examining historical price data to identify patterns and directions in which a stock or market is moving. Just as meteorologists study past weather data to predict future conditions, traders also study past price movements to anticipate where prices might head next.
The Three Types of Trends
Uptrend (bullish)
Prices keep rising, making higher highs and higher lows. This suggests strong buying interest.
Downtrend (bearish)
Prices are generally falling, making lower highs and lower lows. This trend indicates dominance of selling pressure.
Sideways trend (range-bound)
Prices move within a certain range without clear direction. The market is indecisive.
Identifying which trend is active helps traders decide their strategy.
How to Decide Based on Data
The process begins with gathering data. Traders collect historical closing prices, opening prices, high and low points for each trading session. They also examine volume data because high volume confirms trend strength while low volume suggests weakness. The time frame matters too. Daily charts work for swing trading, hourly charts for intraday and weekly charts for long-term positions.
Identifying Trends
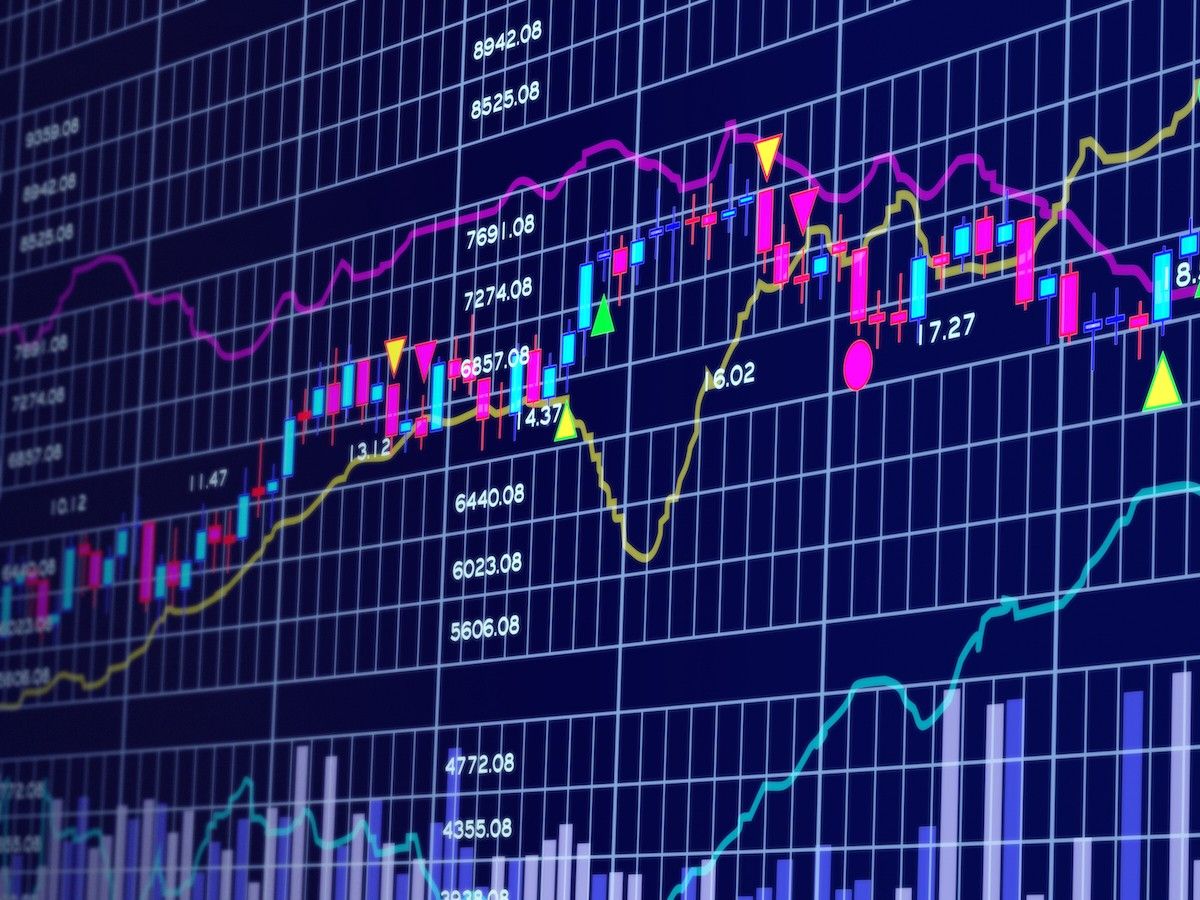
Using collected data, traders identify trends through various methods. Sometimes it's as simple as looking at a price chart. If the line slopes northwards, it's an uptrend. In trend analysis, moving averages are crucial indicators. The average price of stock is calculated for an extended period, like 50 days or 200 days. If the current price is above the moving average, it suggests an uptrend.
Trendlines are also drawn by connecting successive highs and lows. An upward-sloping line indicates an uptrend. There are many other technical indicators which mathematically measure trend strength and direction.
Confirming Before Acting
Smart traders don't decide trades based on a single indicator. They look for confirmation across multiple time frames. If both daily and weekly charts show uptrends, the signal becomes much stronger. Volume confirmation matters too. An uptrend with increasing volume is more reliable. When multiple indicators all suggest the same direction, confidence increases significantly.
Making Trading Decisions
Based on trend analysis, traders make specific decisions. In an uptrend, they buy on dips when the price temporarily falls, hold existing positions and avoid short selling. In a downtrend, they sell or stay away, sometimes short-selling if experienced and wait for reversal signs before buying.
Example,
Let's say you are analysing TCS stock. The current price is ₹3,500 and the 50-day moving average is at ₹3,400. The stock has traded above this average for three weeks, volume has increased 20% and TCS just won a major contract.
The price is making higher highs and higher lows whilst trading above the moving average. A trendline connecting recent lows slopes upward. The weekly chart confirms an uptrend, volume supports the move and the IT sector is overall performing well.
Based on this detailed analysis, a trader might buy TCS with a target of ₹3,700 and a stop loss at ₹3,350. The uptrend suggests further upside, confirmed by multiple indicators.

Trend analysis isn't foolproof. Trends can reverse suddenly when unexpected news breaks. Sometimes what looks like a trend can be just temporary noise. Because trend analysis uses past data, it's always slightly behind current reality. At times, emotional biases are also prevalent, where traders see what they want to see rather than what the data shows.
This is why risk management through stop losses and proper position sizing remains important even when following clear trends.
About Author
Pradnya Surana
Sub-Editor
is an engineering and management graduate with 12 years of experience in India’s leading banks. With a natural flair for writing and a passion for all things finance, she reinvented herself as a financial writer. Her work reflects her ability to view the industry from both sides of the table, the financial service provider and the consumer. Experience in fast paced consumer facing roles adds depth, clarity and relevance to her writing.
Read more from Pradnya


Upstox is a leading Indian financial services company that offers online trading and investment services in stocks, commodities, currencies, mutual funds, and more. Founded in 2009 and headquartered in Mumbai, Upstox is backed by prominent investors including Ratan Tata, Tiger Global, and Kalaari Capital. It operates under RKSV Securities and is registered with SEBI, NSE, BSE, and other regulatory bodies, ensuring secure and compliant trading experiences.
Related articles


Online Trading
What Are High-Yield NCDs? A Beginner’s Guide to Safer Fixed-Income Investing3 min read | Written by Mariyam Sara

Online Trading
Understanding the Put-Call Ratio: A Key Indicator for Market Sentiment and Trading Strategies5 min read | Written by Dev Sethia

Online Trading
Is Forex Trading Legal in India? All You Need to Know About Legalities and Penalties6 min read | Written by Dev Sethia
Online Trading
Understanding Profit After Tax (PAT): What It Means for Investors and Businesses5 min read | Written by Dev Sethia