PG Electroplast Share Price
PG Electroplast Share Price Today
As of 25 Jul 2026, PG Electroplast share price is ₹572.45. The stock opened at ₹570.95, compared to its previous close of ₹576.65. During today's trading session, PG Electroplast share price moved in the range of ₹561.40 to ₹575.90, with an average price of ₹568.65 for the day. Looking at its last 52-week, the stock has touched a low of ₹436.55 and a high of ₹823.50. On the performance front, PG Electroplast share price has increased by 12.17% over the last six months and is down 28.56% on a year-on-year basis.
PG Electroplast Returns Calculator
PG Electroplast Shareholder Returns
PG Electroplast Share Price History
| Name | Mkt Cap Cr | P/E | P/B | ROE | D/E | ROCE | Book Value | Div. Yield | Turnover | EPS(TTM) |
|---|---|---|---|---|---|---|---|---|---|---|
| LG ELECTRONICS INDIA LTD | 1,03,530.00 | 61.57 | 13.54 | 21.98% | 0.06 | 27.56% | 112.93 | 0.00% | 2.91 | 24.83 |
| Dixon Techno | 84,542.50 | 51.42 | 18.08 | 30.76% | 0.08 | 38.12% | 529.76 | 0.07% | 1.14 | 125.44 |
| Havells India | 75,919.30 | 47.18 | 8.14 | 17.88% | 0.03 | 23.02% | 151.00 | 0.81% | 1.60 | 27.19 |
| Voltas | 43,352.50 | 111.82 | 6.59 | 5.74% | 0.09 | 8.54% | 5.28 | 0.31% | 1.23 | 10.31 |
| Blue Star | 33,659.10 | 62.74 | 9.65 | 16.23% | 0.24 | 19.62% | 10.82 | 0.53% | 3.60 | 18.73 |
| Amber Enterprises (I) | 26,199.50 | 115.69 | 5.99 | 4.66% | 0.63 | 8.48% | 868.09 | 0.00% | 1.97 | 41.45 |
| Kaynes Technology | 21,710.50 | 59.67 | 4.57 | 7.66% | 0.07 | 10.97% | 671.25 | 0.00% | 0.47 | 38.30 |
| Crompt Grea Con Elec | 16,249.20 | 0.00 | 4.85 | 10.91% | 0.10 | 19.50% | 4.53 | 1.34% | 2.06 | -3.78 |
| Avalon Technologies | 11,636.90 | 102.98 | 16.12 | 15.65% | 0.05 | 18.01% | 122.60 | 0.00% | 0.99 | 13.41 |
| Whirlpool of India | 9,764.06 | 33.06 | 2.35 | 7.06% | 0.09 | 9.73% | 288.80 | 0.65% | 1.73 | 19.09 |
PG Electroplast Financials
Income Statement · Consolidated
| Particulars | Mar 2025 | Mar 2024 | Mar 2023 | Mar 2022 |
|---|---|---|---|---|
| Revenue | ₹4,869.53 | ₹2,746.50 | ₹2,159.95 | ₹1,111.64 |
| Other Income | ₹35.11 | ₹13.01 | ₹4.27 | ₹4.32 |
| Total Revenue | ₹4,904.64 | ₹2,759.51 | ₹2,164.22 | ₹1,115.96 |
| Total Expenses | ₹4,539.95 | ₹2,583.04 | ₹2,066.67 | ₹1,067.85 |
| Profit Before Tax | ₹364.69 | ₹176.47 | ₹97.54 | ₹49.04 |
| Tax | ₹73.77 | ₹39.45 | ₹20.07 | ₹11.63 |
| Profit After Tax | ₹290.92 | ₹137.01 | ₹77.47 | ₹37.42 |
| EPS - Basic | ₹10.74 | ₹54.73 | ₹35.78 | ₹18.08 |
| EPS - Diluted | ₹10.55 | ₹54.07 | ₹33.77 | ₹17.03 |
Cash Flow · Consolidated
| Particulars | Mar 2025 | Mar 2024 | Mar 2023 | Mar 2022 |
|---|---|---|---|---|
| Profit before tax | ₹364.69 | ₹176.47 | ₹97.54 | ₹49.04 |
| Income before WC changes | ₹505.77 | ₹283.68 | ₹183.16 | ₹98.04 |
| Change in Assets | -₹1,558.77 | -₹365.53 | -₹290.02 | -₹304.03 |
| Change in Liabilities | ₹1,045.29 | ₹300.66 | ₹161.96 | ₹129.10 |
| Change in WC | -₹513.47 | -₹64.87 | -₹128.06 | -₹174.93 |
| Cash flow from Operations | -₹76.59 | ₹188.46 | ₹45.74 | -₹79.43 |
| Cash flow from Investing | -₹1,201.38 | -₹401.33 | -₹172.97 | -₹161.00 |
| Cash flow from Financing | ₹1,329.01 | ₹234.38 | ₹112.05 | ₹256.86 |
| Total Cash Flow | ₹51.04 | ₹21.51 | -₹15.18 | ₹16.43 |
| Cash (Start of the year) | ₹30.18 | ₹8.67 | ₹23.85 | ₹7.42 |
| Cash (End of the year) | ₹81.22 | ₹30.18 | ₹8.67 | ₹23.85 |
Balance Sheet · Consolidated
| Particulars | Mar 2025 | Mar 2024 | Mar 2023 | Mar 2022 |
|---|---|---|---|---|
| Non-Current Assets | ₹1,367.11 | ₹902.22 | ₹599.72 | ₹460.45 |
| Current Assets | ₹3,753.70 | ₹1,405.76 | ₹908.44 | ₹608.07 |
| Total Assets | ₹5,120.81 | ₹2,307.99 | ₹1,508.17 | ₹1,068.53 |
| Current Liabilities | ₹1,975.87 | ₹963.43 | ₹813.64 | ₹548.23 |
| Net Current Asset | ₹1,777.83 | ₹442.33 | ₹94.81 | ₹59.85 |
| Non-Current Liabilities | ₹316.74 | ₹306.47 | ₹298.60 | ₹208.00 |
| Equity Capital | ₹2,828.21 | ₹1,038.08 | ₹395.93 | ₹312.30 |
| Total Equity & Liabilities | ₹5,120.81 | ₹2,307.99 | ₹1,508.17 | ₹1,068.53 |
Income Statement · Standalone
| Particulars | Mar 2025 | Mar 2024 | Mar 2023 | Mar 2022 |
|---|---|---|---|---|
| Revenue | ₹1,486.76 | ₹1,417.72 | ₹1,331.15 | ₹1,035.85 |
| Other Income | ₹47.34 | ₹23.20 | ₹4.61 | ₹5.69 |
| Total Revenue | ₹1,534.10 | ₹1,440.91 | ₹1,335.76 | ₹1,041.54 |
| Total Expenses | ₹1,423.56 | ₹1,337.32 | ₹1,278.87 | ₹998.06 |
| Profit Before Tax | ₹110.54 | ₹103.60 | ₹56.88 | ₹43.56 |
| Tax | ₹25.84 | ₹25.54 | ₹12.68 | ₹10.60 |
| Profit After Tax | ₹84.71 | ₹78.05 | ₹44.20 | ₹32.97 |
| EPS - Basic | ₹3.16 | ₹31.67 | ₹20.42 | ₹15.93 |
| EPS - Diluted | ₹3.10 | ₹31.29 | ₹19.27 | ₹15.00 |
Cash Flow · Standalone
| Particulars | Mar 2025 | Mar 2024 | Mar 2023 | Mar 2022 |
|---|---|---|---|---|
| Profit before tax | ₹110.54 | ₹103.60 | ₹56.88 | ₹43.56 |
| Income before WC changes | ₹113.83 | ₹133.13 | ₹99.95 | ₹85.30 |
| Change in Assets | -₹62.28 | -₹96.03 | ₹120.48 | -₹157.76 |
| Change in Liabilities | ₹25.98 | ₹67.40 | -₹72.74 | ₹36.69 |
| Change in WC | -₹36.29 | -₹28.64 | ₹47.74 | -₹121.07 |
| Cash flow from Operations | ₹47.18 | ₹85.18 | ₹141.51 | -₹38.13 |
| Cash flow from Investing | -₹1,450.64 | -₹453.42 | -₹51.11 | -₹94.77 |
| Cash flow from Financing | ₹1,427.76 | ₹369.75 | -₹100.67 | ₹139.49 |
| Total Cash Flow | ₹24.30 | ₹1.51 | -₹10.28 | ₹6.58 |
| Cash (Start of the year) | ₹5.23 | ₹3.71 | ₹13.99 | ₹7.40 |
| Cash (End of the year) | ₹29.53 | ₹5.23 | ₹3.71 | ₹13.99 |
Balance Sheet · Standalone
| Particulars | Mar 2025 | Mar 2024 | Mar 2023 | Mar 2022 |
|---|---|---|---|---|
| Non-Current Assets | ₹1,424.78 | ₹665.95 | ₹383.30 | ₹358.83 |
| Current Assets | ₹1,423.99 | ₹616.85 | ₹340.57 | ₹464.37 |
| Total Assets | ₹2,848.77 | ₹1,282.80 | ₹723.87 | ₹823.20 |
| Current Liabilities | ₹268.92 | ₹266.52 | ₹249.54 | ₹403.61 |
| Net Current Asset | ₹1,155.08 | ₹350.33 | ₹91.03 | ₹60.77 |
| Non-Current Liabilities | ₹48.55 | ₹72.72 | ₹115.81 | ₹111.57 |
| Equity Capital | ₹2,531.30 | ₹943.56 | ₹358.52 | ₹308.02 |
| Total Equity & Liabilities | ₹2,848.77 | ₹1,282.80 | ₹723.87 | ₹823.20 |

About PG Electroplast
Established in: 2003
Managing Director: Vikas Gupta
PG Electroplast Limited is a flagship company of the PG Group, which was established in 1977. However, PG Electroplast was established in 2003 and has become India’s leading and diversified Electronic Manufacturing Service provider. The company caters to over 50 Indian and global brands and specialises in Original Design Manufacturing (ODM), Original Equipment Manufacturing (OEM) and Plastics Injection Moulding
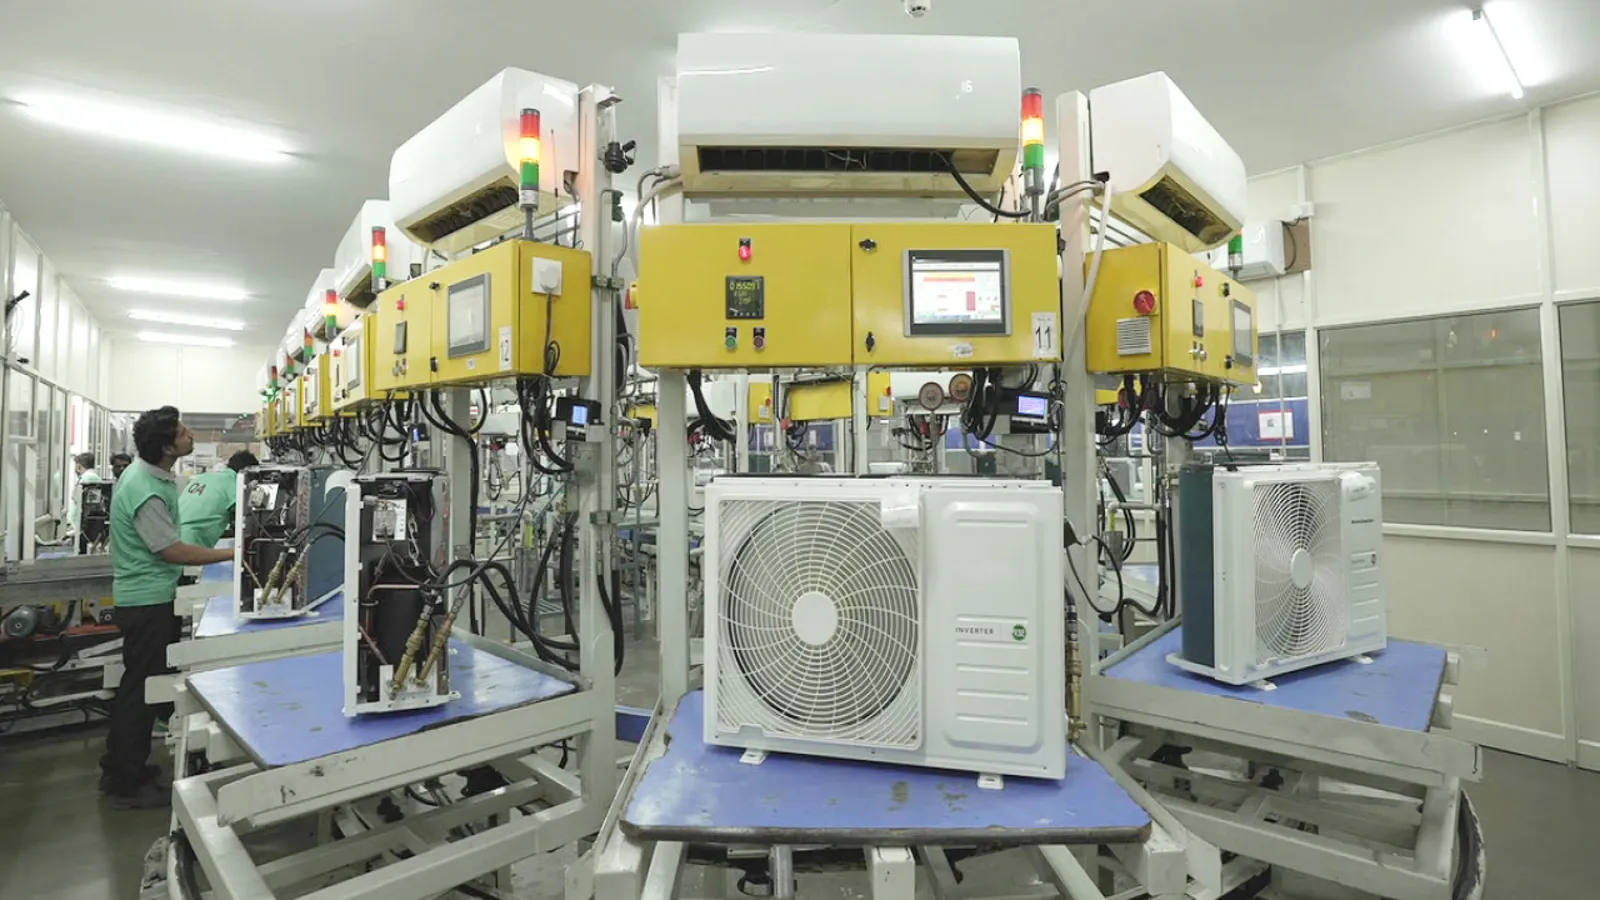
PG Technoplast Pvt Limited, which is a wholly owned subsidiary of PG Electroplast Limited, manufactures air conditioners, coolers, and components used in various consumer durables.
PG Electroplact Limited launched its IPO and went public in September 2011 with a total issue size of around ₹120.65 crores and a final issue price of ₹210 per share. The minimum lot size for application was 30 shares, which required a minimum retail investment of 6,300.
History of PG Electroplast Limited
The PG Group was established in 1977, and it started as a small electronic components manufacturing unit in Delhi. In 1995, a TV was set up in Noida. As colour TVs gained popularity, the company started manufacturing colour TVs and audio products.
In 1999, the company opened a PCB assembly line in Noida. In 2003, PG Electroplast Limited was established, which specialised in Original Design Manufacturing (ODM), Original Equipment Manufacturing (OEM) and Plastics Injection Moulding.
Business Segments of PG Electroplast Limited
The following are the business segments of PG Electroplast Limited.
-
Plastic Moulding This segment focuses on providing high-precision injection moulding. It manages the production of surface-critical components and post-moulding operations such as painting and sub-assembly.
-
Product Business PG Electroplast Limits is an Original Design and Equipment Manufacturer (ODM) for consumer durables and engages in designing, testing and manufacturing finished goods such as air Conditioners, semi-automatic and full automatic washing machines, air coolers, and LED televisions.
-
Electronics The electronics segment focuses on Printed Circuit Board Assembly (PCBA), mobile handset sub-assemblies and other electronic components used in consumer electronics, home appliances and automotive sectors.
-
Tool Manufacturing PG Electroplast Limited operates and manages multiple in-house design and mould manufacturing facilities. These facilities help the company to quickly create prototypes and custom tooling for clients.
Subsidiaries of PG Electroplast Limited
The following are the subsidiaries of PG Electroplast Limited.
-
PG Technoplat Private Limited This is a wholly owned subsidiary of PG Electroplast Limited, which is considered a flagship for expanding the PG Group’s EMS operations and manufacturing of household appliances. The company has entered into an exclusive agreement with Spiro Mobility to manufacture EVs, lithium-ion batteries and other related components in India.
-
Next Generation Manufacturers Private Limited This company is a step-down subsidiary of PG Electroplast Limited, which specialises in manufacturing Air Conditioner components. In January, 2025, the company received significant approval under the Government of India’s Production Linked Incentive (PLI) Scheme for manufacturing home appliances such as washing machines, air conditioners and refrigerators.
-
PG Plastronics Private Limited This is a direct subsidiary of PG Electroplast Limited, engaged in plastics injection moulding and electronic sub-assemblies for the parent company.
-
Goodsworth Electronics Private Limited PG Electroplast Limited entered into a joint venture with Jaina Marketing & Associates and established a company called “Goodsworth Electronics Private Limited. This company is a manufacturing arm for producing LED televisions.
PG Electroplast Financial Highlights
- Revenue: PG Electroplast reported revenue of ₹5,342.81 crore in FY26 vs ₹4,904.64 crore in FY25. It showed an increase of 8.93% on a yearly basis.
- Operating Profit: PG Electroplast reported an operating profit of ₹251.94 crore in FY26 vs ₹364.69 crore in FY25. It showed a decrease of 30.92% on a year-on-year basis.
- Net Profit: PG Electroplast reported a net profit of ₹193.60 crore in FY26 vs ₹290.92 crore in FY25. It showed a decrease of 33.45% on a yearly basis.
PG Electroplast Quarterly Result Highlights
- PG Electroplast reported revenue of ₹1,729.47 crore in Mar 2026, compared with ₹1,421.36 crore in Dec 2025, representing an increase of 21.68% on a quarter-on-quarter (QoQ) basis.
- PG Electroplast reported an operating profit of ₹81.82 crore in Mar 2026, compared with ₹79.12 crore in Dec 2025, representing an increase of 3.41% on a quarter-on-quarter (QoQ) basis.
- PG Electroplast reported a profit of ₹64.20 crore in Mar 2026, compared with ₹60.31 crore in Dec 2025, reflecting an increase of 6.45% on a QoQ basis.
- The earnings per share (EPS) of PG Electroplast stood at ₹10.74 during Mar 2026.
Similar Stocks


FAQs on PG Electroplast Share Price
What is PG Electroplast share price today?
PG Electroplast share price is ₹572.45 as on 24 Jul, 2026, 15:55 IST.
How has the PG Electroplast share price performed in the past?
In the last 1 year, PG Electroplast delivered a return of -28.56%. The PG Electroplast share price hit a high of ₹823.50 and low of ₹436.55.
How much is the Mutual Fund shareholding in PG Electroplast shares?
The Mutual Fund Shareholding in PG Electroplast was 18.65% at the end of Jun 2026.
What is the the 52-week high and low of PG Electroplast shares ?
The 52-week high and low of PG Electroplast share is ₹823.50 and ₹436.55 as of 24 Jul, 2026.
What is the market cap of PG Electroplast?
The market capitalisation of PG Electroplast is ₹16,537.30 Crores as on 24 Jul, 2026.
What are the stock symbols of PG Electroplast?
The stock symbol of PG Electroplast is PGEL on the NSE, 533581 on the BSE, and the ISIN is INE457L01029.
What was yesterday's closing price of PG Electroplast shares ?
PG Electroplast shares closed yesterday at ₹576.65 on NSE & ₹576.70 on BSE
How to buy PG Electroplast shares?
To buy PG Electroplast shares, open a demat account with Upstox and complete the KYC process. Once your account is set up, search for the stock and place your order.
Can I buy PG Electroplast shares on Holidays?
No, shares of PG Electroplast or any other publicly traded company cannot be bought or sold on holidays when the stock exchanges are closed. You can only buy or sell PG Electroplast shares on days when the stock exchanges are open for trading. It's important to check the NSE & BSE holidays calendar, before placing any trades to avoid any inconvenience.
What is the PE and PB ratio of PG Electroplast?
The PE and PB ratio of PG Electroplast is 83.5 and 5.38 respectively, as on 24 Jul, 2026, 15:55 IST.