NLC India Share Price
NLC India Share Price Today
As of 24 Jul 2026, NLC India share price is ₹286.80. The stock opened at ₹287.40, compared to its previous close of ₹290.70. During today's trading session, NLC India share price moved in the range of ₹279.90 to ₹289.25, with an average price of ₹284.57 for the day. Looking at its last 52-week, the stock has touched a low of ₹222.00 and a high of ₹387.80. On the performance front, NLC India share price has increased by 17.64% over the last six months and is up 18.85% on a year-on-year basis.
NLC India Returns Calculator
NLC India Shareholder Returns
NLC India Share Price History
| Name | Mkt Cap Cr | P/E | P/B | ROE | D/E | ROCE | Book Value | Div. Yield | Turnover | EPS(TTM) |
|---|---|---|---|---|---|---|---|---|---|---|
| Adani Power | 4,09,414.00 | 28.16 | 6.60 | 19.76% | 0.93 | 15.08% | 26.47 | 0.00% | 0.38 | 5.67 |
| NTPC | 3,39,917.00 | 12.28 | 1.66 | 13.31% | 1.09 | 8.02% | 180.34 | 2.58% | 0.51 | 23.89 |
| Power Grid Corp | 2,69,113.00 | 16.89 | 2.68 | 15.85% | 1.48 | 8.81% | 107.44 | 4.66% | 0.17 | 17.12 |
| Adani Green | 2,42,604.00 | 105.91 | 11.78 | 9.24% | 1.52 | 6.63% | 90.40 | 0.00% | 0.37 | 3.59 |
| Adani Energy Solution | 2,07,119.00 | 67.01 | 8.15 | 8.98% | 0.53 | 8.82% | 174.12 | 0.00% | 0.10 | 4.75 |
| Tata Power | 1,20,177.00 | 32.28 | 3.12 | 13.59% | 1.26 | 9.58% | 6.82 | 0.66% | 0.32 | 3.52 |
| SIEMENS ENERGY INDIA LTD | 1,18,465.00 | 93.81 | 25.29 | 25.11% | 0.03 | 31.50% | 123.03 | 0.13% | 0.86 | 30.89 |
| JSW Energy | 1,02,152.00 | 41.55 | 2.99 | 7.28% | 0.62 | 7.18% | 150.70 | 0.34% | 0.08 | 4.92 |
| NHPC | 80,621.50 | 19.11 | 1.95 | 9.09% | 1.11 | 5.23% | 39.79 | 2.00% | 0.12 | 3.60 |
| NTPC GREEN ENERGY LIMITED | 76,932.40 | 135.01 | 4.32 | 2.76% | 0.48 | 2.95% | 22.42 | 0.00% | 0.06 | 0.48 |
NLC India Financials
Income Statement · Consolidated
| Particulars | Mar 2025 | Mar 2024 | Mar 2023 | Mar 2022 |
|---|---|---|---|---|
| Revenue | ₹15,282.96 | ₹13,001.33 | ₹16,165.24 | ₹11,947.94 |
| Other Income | ₹1,606.49 | ₹947.14 | ₹1,217.98 | ₹598.02 |
| Total Revenue | ₹16,889.45 | ₹13,948.47 | ₹17,383.22 | ₹12,545.96 |
| Total Expenses | ₹13,258.76 | ₹12,139.71 | ₹13,136.26 | ₹10,677.57 |
| Profit Before Tax | ₹3,696.93 | ₹2,881.64 | ₹2,055.79 | ₹2,603.14 |
| Tax | ₹983.56 | ₹1,014.32 | ₹630.66 | ₹1,488.01 |
| Profit After Tax | ₹2,713.37 | ₹1,867.32 | ₹1,425.13 | ₹1,115.13 |
| EPS - Basic | ₹19.57 | ₹13.47 | ₹10.28 | ₹8.05 |
| EPS - Diluted | ₹19.57 | ₹13.47 | ₹10.28 | ₹8.05 |
Cash Flow · Consolidated
| Particulars | Mar 2025 | Mar 2024 | Mar 2023 | Mar 2022 |
|---|---|---|---|---|
| Profit before tax | ₹3,696.93 | ₹2,881.64 | ₹2,055.79 | ₹2,603.14 |
| Income before WC changes | ₹7,127.14 | ₹5,954.51 | ₹4,257.71 | ₹5,653.09 |
| Change in Assets | ₹2,283.37 | ₹704.21 | -₹1,790.95 | ₹3,624.47 |
| Change in Liabilities | ₹79.40 | -₹555.79 | ₹1,864.18 | -₹664.94 |
| Change in WC | ₹2,362.77 | ₹148.42 | ₹73.23 | ₹2,959.53 |
| Cash flow from Operations | ₹8,977.12 | ₹5,512.49 | ₹4,171.32 | ₹7,746.05 |
| Cash flow from Investing | -₹7,159.56 | -₹3,059.36 | -₹2,498.58 | -₹762.62 |
| Cash flow from Financing | -₹2,196.07 | -₹1,985.08 | -₹1,734.67 | -₹7,001.36 |
| Total Cash Flow | -₹378.51 | ₹468.05 | -₹61.93 | -₹17.93 |
| Cash (Start of the year) | ₹565.47 | ₹97.42 | ₹139.41 | ₹157.34 |
| Cash (End of the year) | ₹186.96 | ₹565.47 | ₹77.48 | ₹139.41 |
Balance Sheet · Consolidated
| Particulars | Mar 2025 | Mar 2024 | Mar 2023 | Mar 2022 |
|---|---|---|---|---|
| Non-Current Assets | ₹49,830.08 | ₹45,663.42 | ₹43,287.57 | ₹42,190.39 |
| Current Assets | ₹8,021.27 | ₹9,278.39 | ₹9,780.13 | ₹7,595.05 |
| Total Assets | ₹57,851.35 | ₹54,941.81 | ₹53,067.70 | ₹49,785.44 |
| Current Liabilities | ₹10,707.29 | ₹7,946.51 | ₹7,076.62 | ₹6,249.25 |
| Net Current Asset | -₹2,686.02 | ₹1,331.88 | ₹2,703.51 | ₹1,345.80 |
| Non-Current Liabilities | ₹25,199.34 | ₹27,629.08 | ₹28,365.42 | ₹27,161.88 |
| Equity Capital | ₹21,944.72 | ₹19,366.22 | ₹17,625.66 | ₹16,374.31 |
| Total Equity & Liabilities | ₹57,851.35 | ₹54,941.81 | ₹53,067.70 | ₹49,785.44 |
Income Statement · Standalone
| Particulars | Mar 2025 | Mar 2024 | Mar 2023 | Mar 2022 |
|---|---|---|---|---|
| Revenue | ₹10,285.78 | ₹10,520.25 | ₹12,955.00 | ₹9,856.48 |
| Other Income | ₹1,201.38 | ₹873.10 | ₹1,240.90 | ₹805.89 |
| Total Revenue | ₹11,487.16 | ₹11,393.35 | ₹14,195.90 | ₹10,662.37 |
| Total Expenses | ₹9,804.40 | ₹9,558.56 | ₹10,166.77 | ₹8,719.31 |
| Profit Before Tax | ₹2,857.83 | ₹2,787.89 | ₹1,724.15 | ₹2,606.42 |
| Tax | ₹957.84 | ₹941.31 | ₹475.91 | ₹1,369.64 |
| Profit After Tax | ₹1,899.99 | ₹1,846.58 | ₹1,248.24 | ₹1,236.78 |
| EPS - Basic | ₹13.70 | ₹13.32 | ₹9.00 | ₹8.92 |
| EPS - Diluted | ₹13.70 | ₹13.32 | ₹9.00 | ₹8.92 |
Cash Flow · Standalone
| Particulars | Mar 2025 | Mar 2024 | Mar 2023 | Mar 2022 |
|---|---|---|---|---|
| Profit before tax | ₹2,857.83 | ₹2,787.89 | ₹1,724.15 | ₹2,606.42 |
| Income before WC changes | ₹4,986.02 | ₹5,072.93 | ₹3,222.49 | ₹4,812.25 |
| Change in Assets | ₹1,874.33 | ₹1,301.18 | -₹1,209.44 | ₹2,266.83 |
| Change in Liabilities | -₹904.13 | -₹677.52 | ₹1,815.55 | -₹219.31 |
| Change in WC | ₹970.20 | ₹623.66 | ₹606.11 | ₹2,047.52 |
| Cash flow from Operations | ₹5,645.04 | ₹5,141.17 | ₹3,822.55 | ₹6,062.36 |
| Cash flow from Investing | -₹4,059.31 | -₹2,144.21 | -₹1,888.17 | -₹122.78 |
| Cash flow from Financing | -₹1,976.07 | -₹2,514.33 | -₹1,986.72 | -₹5,968.42 |
| Total Cash Flow | -₹390.34 | ₹482.63 | -₹52.34 | -₹28.84 |
| Cash (Start of the year) | ₹553.81 | ₹71.18 | ₹123.52 | ₹152.36 |
| Cash (End of the year) | ₹163.47 | ₹553.81 | ₹71.18 | ₹123.52 |
Balance Sheet · Standalone
| Particulars | Mar 2025 | Mar 2024 | Mar 2023 | Mar 2022 |
|---|---|---|---|---|
| Non-Current Assets | ₹30,027.91 | ₹27,710.95 | ₹26,790.80 | ₹27,173.94 |
| Current Assets | ₹6,252.84 | ₹7,441.68 | ₹8,421.26 | ₹6,467.24 |
| Total Assets | ₹36,280.75 | ₹35,152.63 | ₹35,212.06 | ₹33,641.18 |
| Current Liabilities | ₹7,679.01 | ₹4,356.62 | ₹4,397.20 | ₹3,945.32 |
| Net Current Asset | -₹1,426.17 | ₹3,085.06 | ₹4,024.06 | ₹2,521.92 |
| Non-Current Liabilities | ₹11,136.57 | ₹14,802.10 | ₹16,176.00 | ₹15,889.22 |
| Equity Capital | ₹17,465.17 | ₹15,993.91 | ₹14,638.86 | ₹13,806.64 |
| Total Equity & Liabilities | ₹36,280.75 | ₹35,152.63 | ₹35,212.06 | ₹33,641.18 |
About NLC India
NLC India Limited has been a leading player in India’s energy sector for more than six decades. It is one of the largest entities in lignite production. The public sector company primarily operates in two segments: lignite mining and power generation. It’s a major contributor to the thermal and renewable energy requirements of the country.
NLC India Limited was incorporated in November 1956 as Neyveli Lignite Corporation Limited. It was established by the Government of India as a private limited company. In 1986, NLC India Limited was converted into a public limited company.
NLC India Limited’s market capitalisation stood at over ₹32,000 crore as of January 19, 2024. NLC share price has surged more than 330% in the last three years.
NLC India business operations
The registered office of NLC India Limited is located in Chennai. The company has expanded its presence across India, establishing operations in Tamil Nadu, Rajasthan, Uttar Pradesh, Odisha, Jharkhand, Gujarat and the Andaman and Nicobar Islands.
NLC India Limited has three primary business segments: mining operations, covering lignite and coal; power generation, encompassing thermal, solar, and wind; and power trading. The company is actively preparing to enter new business avenues such as green hydrogen and floating solar projects.
NLC India Limited operates three opencast lignite mines with a total installed capacity of 28 million tonnes per annum (MTPA) at Neyveli, Tamil Nadu. Additionally, the company manages one opencast lignite mine at Barsingsar in Rajasthan with an installed capacity of 2.1 MTPA. NLC India Limited oversees an open-cast coal mine at Talabira in Odisha, equipped with an installed capacity of 20 MTPA.
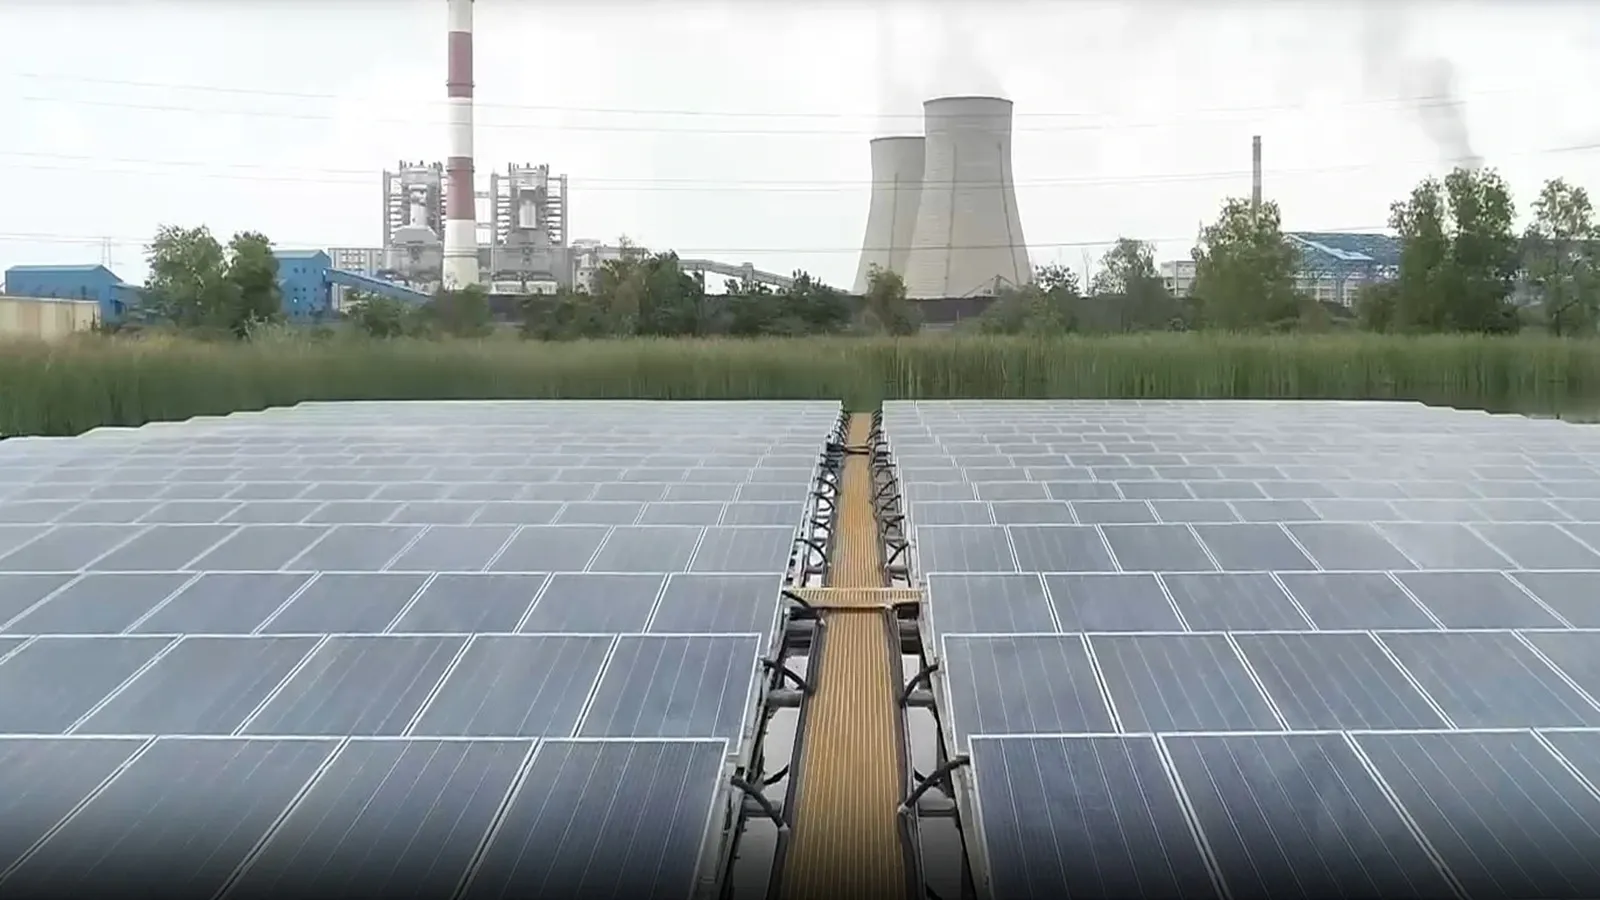
NLC India Limited operates four lignite-based pit-head thermal power stations with a combined capacity of 3390 megawatt (MW) at Neyveli. Additionally, the company manages a 250 MW lignite-based thermal power station (BTPS) at Barsingsar, Rajasthan. NLC India through its subsidiary NLC Tamil Nadu Power Limited (NTPL), a joint venture with TANGEDCO, runs a 1000 MW coal-based thermal power station in Thoothukudi.
NLC India Limited has also expanded to the renewable energy sector. The company operates 1380 MW solar power plants in various districts of Tamil Nadu and the Andaman and Nicobar Islands. The company also manages a 51 MW wind power plant in Tirunelveli district, Tamil Nadu. Notably, NLC India Limited was the first Central Public Sector Enterprise (CPSE) to surpass 1 GW capacity in solar power generation in the country, and it joined the International Solar Alliance (ISA).


NLC India Limited has incorporated a wholly owned subsidiary NLC India Renewables Limited (NIRL) to transfer all the renewable energy assets. The objective of setting up this subsidiary is to focus exclusively on renewable energy.
NLC India Limited is aiming to achieve a total renewable energy capacity of 6031MW by 2030.
NLC India Financial Highlights
- Revenue: NLC India reported revenue of ₹18,466.89 crore in FY26 vs ₹16,889.45 crore in FY25. It showed an increase of 9.34% on a yearly basis.
- Operating Profit: NLC India reported an operating profit of ₹3,875.12 crore in FY26 vs ₹3,696.93 crore in FY25. It showed an increase of 4.82% on a year-on-year basis.
- Net Profit: NLC India reported a net profit of ₹3,769.18 crore in FY26 vs ₹2,713.37 crore in FY25. It showed an increase of 38.91% on a yearly basis.
NLC India Quarterly Result Highlights
- NLC India reported revenue of ₹5,197.22 crore in Mar 2026, compared with ₹4,807.10 crore in Dec 2025, representing an increase of 8.12% on a quarter-on-quarter (QoQ) basis.
- NLC India reported an operating profit of ₹1,517.59 crore in Mar 2026, compared with ₹842.60 crore in Dec 2025, representing an increase of 80.11% on a quarter-on-quarter (QoQ) basis.
- NLC India reported a profit of ₹1,481.39 crore in Mar 2026, compared with ₹723.92 crore in Dec 2025, reflecting an increase of 104.63% on a QoQ basis.
- The earnings per share (EPS) of NLC India stood at ₹19.57 during Mar 2026.
Similar Stocks
FAQs on NLC India Share Price
What is NLC India share price today?
NLC India share price is ₹286.80 as on 24 Jul, 2026, 11:22 IST.
How has the NLC India share price performed in the past?
In the last 1 year, NLC India delivered a return of 18.85%. The NLC India share price hit a high of ₹387.80 and low of ₹222.00.
How much is the Mutual Fund shareholding in NLC India shares?
The Mutual Fund Shareholding in NLC India was 9.46% at the end of Jun 2026.
What is the the 52-week high and low of NLC India shares ?
The 52-week high and low of NLC India share is ₹387.80 and ₹222.00 as of 24 Jul, 2026.
What is the market cap of NLC India?
The market capitalisation of NLC India is ₹40,358.10 Crores as on 24 Jul, 2026.
What are the stock symbols of NLC India?
The stock symbol of NLC India is NLCINDIA on the NSE, 513683 on the BSE, and the ISIN is INE589A01014.
What was yesterday's closing price of NLC India shares ?
NLC India shares closed yesterday at ₹290.70 on NSE & ₹291.05 on BSE
How to buy NLC India shares?
To buy NLC India shares, open a demat account with Upstox and complete the KYC process. Once your account is set up, search for the stock and place your order.
Can I buy NLC India shares on Holidays?
No, shares of NLC India or any other publicly traded company cannot be bought or sold on holidays when the stock exchanges are closed. You can only buy or sell NLC India shares on days when the stock exchanges are open for trading. It's important to check the NSE & BSE holidays calendar, before placing any trades to avoid any inconvenience.
What is the PE and PB ratio of NLC India?
The PE and PB ratio of NLC India is 10.71 and 1.87 respectively, as on 24 Jul, 2026, 11:22 IST.