NCC Limited Share Price
NCC Limited Share Price Today
As of 23 Jul 2026, NCC Limited share price is ā¹137.75. The stock opened at ā¹138.55, compared to its previous close of ā¹139.30. During today's trading session, NCC Limited share price moved in the range of ā¹136.30 to ā¹139.60, with an average price of ā¹137.95 for the day. Looking at its last 52-week, the stock has touched a low of ā¹130.00 and a high of ā¹230.75. On the performance front, NCC Limited share price has declined by 5.82% over the last six months and is down 39.43% on a year-on-year basis.
NCC Limited Returns Calculator
NCC Limited Shareholder Returns
NCC Limited Share Price History
| Name | Mkt Cap Cr | P/E | P/B | ROE | D/E | ROCE | Book Value | Div. Yield | Turnover | EPS(TTM) |
|---|---|---|---|---|---|---|---|---|---|---|
| Larsen & Toubro | 5,29,291.00 | 29.97 | 4.41 | 18.52% | 0.24 | 14.69% | 6.47 | 1.08% | 1.79 | 45.71 |
| RVNL | 46,965.10 | 53.35 | 4.73 | 8.91% | 0.54 | 10.68% | 42.51 | 0.76% | 1.47 | 3.84 |
| ITD Cementation India | 28,168.00 | 14.68 | 3.66 | 28.24% | 0.47 | 32.54% | 3.66 | 0.59% | 3.88 | 34.56 |
| ACME SOLAR HOLDINGS LTD | 26,352.30 | 52.95 | 3.35 | 9.86% | 0.86 | 6.62% | 109.66 | 0.05% | 0.46 | 5.62 |
| IRB Infrastructure Developers | 23,974.80 | 28.53 | 1.12 | 4.06% | 0.74 | 6.02% | 13.72 | 0.65% | 0.18 | 0.82 |
| Kalpataru Power Transmission | 22,902.30 | 17.37 | 2.32 | 14.42% | 0.42 | 17.66% | 2.20 | 1.04% | 2.56 | 48.71 |
| VA Tech Wabag | 13,123.60 | 35.49 | 5.11 | 14.42% | 0.04 | 17.57% | 337.76 | 0.24% | 1.29 | 53.51 |
| KEC International | 13,057.10 | 21.56 | 2.12 | 9.83% | 0.84 | 12.59% | 206.84 | 1.12% | 3.16 | 16.08 |
| Engineers India | 12,817.40 | 18.54 | 4.07 | 21.99% | 0.01 | 28.14% | 54.14 | 2.19% | 1.25 | 11.36 |
| Ircon International | 11,963.40 | 20.52 | 1.83 | 8.97% | 0.02 | 7.95% | 70.50 | 1.47% | 1.01 | 6.58 |
NCC Limited Financials
Income Statement Ā· Consolidated
| Particulars | Mar 2025 | Mar 2024 | Mar 2023 | Mar 2022 |
|---|---|---|---|---|
| Revenue | ā¹22,199.36 | ā¹20,844.96 | ā¹15,553.41 | ā¹11,137.96 |
| Other Income | ā¹155.55 | ā¹125.95 | ā¹147.59 | ā¹70.72 |
| Total Revenue | ā¹22,354.91 | ā¹20,970.91 | ā¹15,701.00 | ā¹11,208.68 |
| Total Expenses | ā¹21,177.30 | ā¹19,882.75 | ā¹14,812.25 | ā¹10,778.97 |
| Profit Before Tax | ā¹1,187.28 | ā¹1,060.91 | ā¹884.85 | ā¹634.68 |
| Tax | ā¹319.03 | ā¹320.50 | ā¹238.64 | ā¹140.65 |
| Profit After Tax | ā¹868.25 | ā¹740.41 | ā¹646.21 | ā¹494.03 |
| EPS - Basic | ā¹13.06 | ā¹11.32 | ā¹9.77 | ā¹7.91 |
| EPS - Diluted | ā¹13.06 | ā¹11.32 | ā¹9.77 | ā¹7.86 |
Cash Flow Ā· Consolidated
| Particulars | Mar 2025 | Mar 2024 | Mar 2023 | Mar 2022 |
|---|---|---|---|---|
| Profit before tax | ā¹1,187.28 | ā¹1,060.91 | ā¹884.85 | ā¹634.68 |
| Income before WC changes | ā¹1,976.66 | ā¹2,182.98 | ā¹1,502.92 | ā¹1,097.04 |
| Change in Assets | -ā¹2,740.86 | -ā¹2,016.23 | -ā¹1,895.88 | -ā¹716.46 |
| Change in Liabilities | ā¹1,622.12 | ā¹1,563.44 | ā¹1,797.28 | ā¹1,220.84 |
| Change in WC | -ā¹1,118.74 | -ā¹452.79 | -ā¹98.60 | ā¹504.38 |
| Cash flow from Operations | ā¹741.70 | ā¹1,359.45 | ā¹1,100.11 | ā¹1,415.55 |
| Cash flow from Investing | -ā¹58.55 | -ā¹318.69 | -ā¹191.56 | -ā¹66.04 |
| Cash flow from Financing | -ā¹246.68 | -ā¹771.22 | -ā¹892.70 | -ā¹1,274.61 |
| Total Cash Flow | ā¹436.47 | ā¹269.54 | ā¹15.85 | ā¹74.90 |
| Cash (Start of the year) | ā¹551.93 | ā¹282.39 | ā¹266.54 | ā¹191.64 |
| Cash (End of the year) | ā¹988.40 | ā¹551.93 | ā¹282.39 | ā¹266.54 |
Balance Sheet Ā· Consolidated
| Particulars | Mar 2025 | Mar 2024 | Mar 2023 | Mar 2022 |
|---|---|---|---|---|
| Non-Current Assets | ā¹3,371.85 | ā¹3,222.46 | ā¹3,304.40 | ā¹3,005.40 |
| Current Assets | ā¹17,634.53 | ā¹14,874.92 | ā¹13,245.72 | ā¹11,452.59 |
| Total Assets | ā¹21,006.38 | ā¹18,097.38 | ā¹16,550.12 | ā¹14,457.99 |
| Current Liabilities | ā¹13,128.03 | ā¹11,115.62 | ā¹9,890.83 | ā¹8,358.14 |
| Net Current Asset | ā¹4,506.50 | ā¹3,759.30 | ā¹3,354.89 | ā¹3,094.45 |
| Non-Current Liabilities | ā¹375.91 | ā¹169.88 | ā¹173.83 | ā¹203.70 |
| Equity Capital | ā¹7,502.44 | ā¹6,811.88 | ā¹6,485.46 | ā¹5,896.15 |
| Total Equity & Liabilities | ā¹21,006.38 | ā¹18,097.38 | ā¹16,550.12 | ā¹14,457.99 |
Income Statement Ā· Standalone
| Particulars | Mar 2025 | Mar 2024 | Mar 2023 | Mar 2022 |
|---|---|---|---|---|
| Revenue | ā¹19,205.30 | ā¹18,314.41 | ā¹13,351.32 | ā¹9,930.03 |
| Other Income | ā¹187.01 | ā¹124.10 | ā¹152.25 | ā¹108.21 |
| Total Revenue | ā¹19,392.31 | ā¹18,438.51 | ā¹13,503.57 | ā¹10,038.24 |
| Total Expenses | ā¹18,325.32 | ā¹17,470.61 | ā¹12,718.61 | ā¹9,575.86 |
| Profit Before Tax | ā¹1,028.36 | ā¹911.35 | ā¹784.96 | ā¹608.02 |
| Tax | ā¹267.27 | ā¹279.87 | ā¹215.75 | ā¹117.90 |
| Profit After Tax | ā¹761.09 | ā¹631.48 | ā¹569.21 | ā¹490.12 |
| EPS - Basic | ā¹12.12 | ā¹10.06 | ā¹9.13 | ā¹8.04 |
| EPS - Diluted | ā¹12.12 | ā¹10.06 | ā¹9.13 | ā¹7.98 |
Cash Flow Ā· Standalone
| Particulars | Mar 2025 | Mar 2024 | Mar 2023 | Mar 2022 |
|---|---|---|---|---|
| Profit before tax | ā¹1,028.36 | ā¹911.35 | ā¹784.96 | ā¹608.02 |
| Income before WC changes | ā¹1,783.05 | ā¹2,047.52 | ā¹1,383.87 | ā¹1,073.29 |
| Change in Assets | -ā¹2,391.54 | -ā¹1,877.06 | -ā¹1,676.94 | -ā¹881.59 |
| Change in Liabilities | ā¹1,485.11 | ā¹1,463.99 | ā¹1,441.49 | ā¹1,277.53 |
| Change in WC | -ā¹906.43 | -ā¹413.07 | -ā¹235.45 | ā¹395.94 |
| Cash flow from Operations | ā¹815.78 | ā¹1,299.40 | ā¹873.13 | ā¹1,295.98 |
| Cash flow from Investing | -ā¹218.83 | -ā¹332.51 | -ā¹132.38 | -ā¹131.06 |
| Cash flow from Financing | -ā¹311.14 | -ā¹705.80 | -ā¹748.73 | -ā¹1,099.19 |
| Total Cash Flow | ā¹285.81 | ā¹261.09 | -ā¹7.98 | ā¹65.73 |
| Cash (Start of the year) | ā¹488.50 | ā¹227.41 | ā¹235.39 | ā¹169.66 |
| Cash (End of the year) | ā¹774.31 | ā¹488.50 | ā¹227.41 | ā¹235.39 |
Balance Sheet Ā· Standalone
| Particulars | Mar 2025 | Mar 2024 | Mar 2023 | Mar 2022 |
|---|---|---|---|---|
| Non-Current Assets | ā¹3,850.69 | ā¹3,693.46 | ā¹3,378.81 | ā¹3,110.71 |
| Current Assets | ā¹15,983.26 | ā¹13,642.56 | ā¹12,220.86 | ā¹10,715.90 |
| Total Assets | ā¹19,833.95 | ā¹17,336.02 | ā¹15,599.67 | ā¹13,826.61 |
| Current Liabilities | ā¹12,189.47 | ā¹10,378.91 | ā¹9,116.30 | ā¹7,868.98 |
| Net Current Asset | ā¹3,793.79 | ā¹3,263.65 | ā¹3,104.56 | ā¹2,846.92 |
| Non-Current Liabilities | ā¹207.70 | ā¹144.42 | ā¹161.47 | ā¹154.46 |
| Equity Capital | ā¹7,436.78 | ā¹6,812.69 | ā¹6,321.90 | ā¹5,803.17 |
| Total Equity & Liabilities | ā¹19,833.95 | ā¹17,336.02 | ā¹15,599.67 | ā¹13,826.61 |
About NCC Limited
NCC Limited is one of the largest listed construction companies in India in terms of revenue, with well diversified activities comprising buildings, transportation, water and environment, irrigation, electricity (transmission and distribution), mining and railways.
The company has a pan-India presence with offices across 9 cities in Ahmedabad, Bengaluru, Chennai, Delhi, Lucknow, Mumbai, Pune, Kolkata and Patna with headquarters in Hyderabad.
NCC took birth as a partnership company in 1978, transformed into a public limited company in 1990 and listed on BSE in 1992. From being a ā¹100 crore revenue company in 2005, the company has gone on to hit a revenue mark of ā¹13,000 crore in 2023.
As of December 21, 2023, NCC Ltd market capitalisation stood at over ā¹10,000 crore. NCC share price has surged more than 218% in the last three years.
Business operations
NCC operates through various business divisions. It has 24 subsidiaries, including step-down subsidiaries, as of March 31, 2023. One of its key subsidiaries is NCC Urban Infrastructure Ltd, whose quality operations span across residential and commercial complexes, townships, SEZs and serviced apartment complexes.
Buildings:
NCCās building division excels in constructing functional industrial and commercial spaces while providing quality housing solutions. The companyās expertise is in spaces like industrial and commercial complexes, housing, IT parks, institutional, sports complexes, hospitals, airports and stadiums.
Transportation:
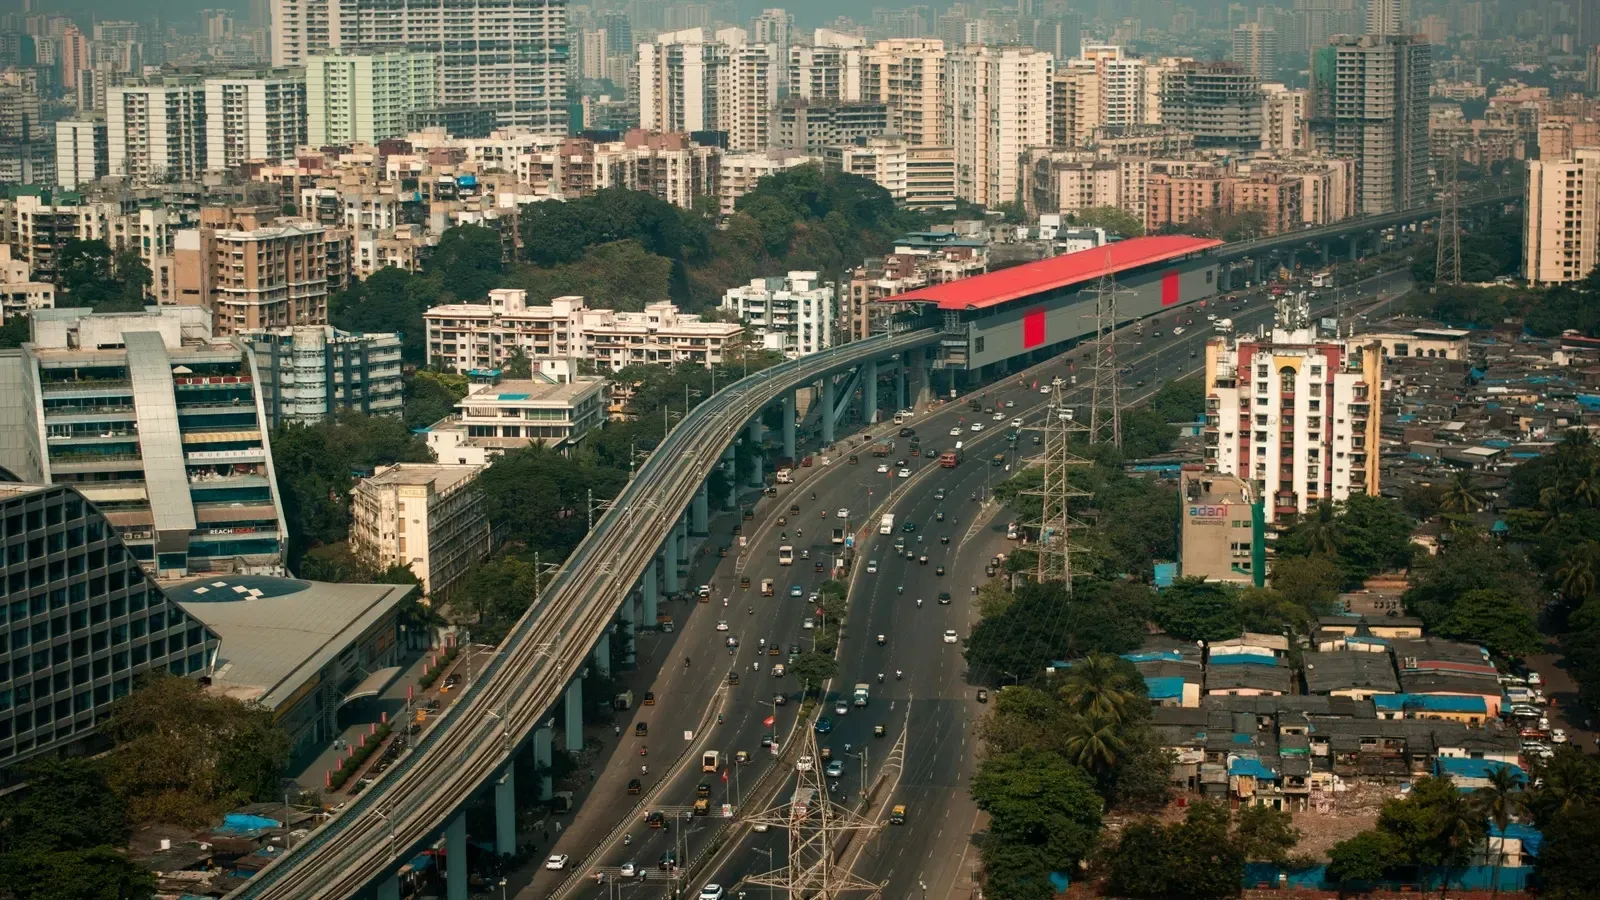
The companyās expertise encompasses the construction of expressways and highways, highway realignment and bypass projects, metro projects, carriageway widening and strengthening, development of road sections, rehabilitation, and up-gradation initiatives, as well as the construction of bridges and flyovers.
Water and environment:
NCC specialises in executing a wide range of projects, including water treatment plants, distribution networks, river intake works, underground drainage systems, lift irrigation schemes, sewage pumping stations and treatment plants. The company has a remarkable track record of successful projects such as the gravity-based water supply system in Amaravati, Maharashtra, which earned a place in the Limca Book of Records.


Electrical (T&D):
NCCās electrical division boasts a wide range of expertise, including design, engineering, erection, testing, and commissioning of EHV/hv/LV (extra high voltage, high voltage and low voltage) substations and transmission lines, high voltage distribution systems and feeder separation schemes.

Irrigation:
NCC undertakes a wide range of projects related to irrigation infrastructure, including major, medium, and minor canals sourced from rivers, groundwater, well-based systems, tanks, and rainwater harvesting initiatives.
Mining:
The mining division is primarily focused on mine developer-cum-operator (MDO) activities, involving the removal of overburden and extraction of coal, lignite, and other minerals from opencast mines across India.
Railways:
The company undertakes railways projects such as dedicated freight corridors, EPC (engineering, procurement and construction) work, overhead electrification (OHE), and signal and telecommunication (S&T).
NCC Limited Financial Highlights
- Revenue: NCC Limited reported revenue of ā¹20,944.40 crore in FY26 vs ā¹22,354.91 crore in FY25. It showed a decrease of 6.31% on a yearly basis.
- Operating Profit: NCC Limited reported an operating profit of ā¹952.16 crore in FY26 vs ā¹1,187.28 crore in FY25. It showed a decrease of 19.80% on a year-on-year basis.
- Net Profit: NCC Limited reported a net profit of ā¹723.96 crore in FY26 vs ā¹868.25 crore in FY25. It showed a decrease of 16.62% on a yearly basis.
NCC Limited Quarterly Result Highlights
- NCC Limited reported revenue of ā¹6,250.98 crore in Mar 2026, compared with ā¹4,900.43 crore in Dec 2025, representing an increase of 27.56% on a quarter-on-quarter (QoQ) basis.
- NCC Limited reported an operating profit of ā¹293.59 crore in Mar 2026, compared with ā¹181.59 crore in Dec 2025, representing an increase of 61.68% on a quarter-on-quarter (QoQ) basis.
- NCC Limited reported a profit of ā¹216.77 crore in Mar 2026, compared with ā¹135.22 crore in Dec 2025, reflecting an increase of 60.31% on a QoQ basis.
- The earnings per share (EPS) of NCC Limited stood at ā¹13.06 during Mar 2026.
Similar Stocks
FAQs on NCC Limited Share Price
What is NCC Limited share price today?
NCC Limited share price is ā¹137.75 as on 22 Jul, 2026, 15:59 IST.
How has the NCC Limited share price performed in the past?
In the last 1 year, NCC Limited delivered a return of -39.43%. The NCC Limited share price hit a high of ā¹230.75 and low of ā¹130.00.
How much is the Mutual Fund shareholding in NCC Limited shares?
The Mutual Fund Shareholding in NCC Limited was 14.13% at the end of Jun 2026.
What is the the 52-week high and low of NCC Limited shares ?
The 52-week high and low of NCC Limited share is ā¹230.75 and ā¹130.00 as of 22 Jul, 2026.
What is the market cap of NCC Limited?
The market capitalisation of NCC Limited is ā¹8,745.90 Crores as on 22 Jul, 2026.
What are the stock symbols of NCC Limited?
The stock symbol of NCC Limited is NCC on the NSE, 500294 on the BSE, and the ISIN is INE868B01028.
What was yesterday's closing price of NCC Limited shares ?
NCC Limited shares closed yesterday at ā¹139.30 on NSE & ā¹139.30 on BSE
How to buy NCC Limited shares?
To buy NCC Limited shares, open a demat account with Upstox and complete the KYC process. Once your account is set up, search for the stock and place your order.
Can I buy NCC Limited shares on Holidays?
No, shares of NCC Limited or any other publicly traded company cannot be bought or sold on holidays when the stock exchanges are closed. You can only buy or sell NCC Limited shares on days when the stock exchanges are open for trading. It's important to check the NSE & BSE holidays calendar, before placing any trades to avoid any inconvenience.
What is the PE and PB ratio of NCC Limited?
The PE and PB ratio of NCC Limited is 12.08 and 1.11 respectively, as on 22 Jul, 2026, 15:59 IST.