Logo

IRB Infrastructure Developers Share Price

NSE: IRB
|
Engineering
₹ 21.30
-₹0.12 (-0.56%)
1D
Last updated 03 Jul, 2026, 15:59 IST

IRB Infrastructure Developers Share Price Today

As of 5 Jul 2026, IRB Infrastructure Developers share price is ₹21.30. The stock opened at ₹21.70, compared to its previous close of ₹21.42. During today's trading session, IRB Infrastructure Developers share price moved in the range of ₹21.25 to ₹21.78, with an average price of ₹21.52 for the day. Looking at its last 52-week, the stock has touched a low of ₹19.15 and a high of ₹24.97. On the performance front, IRB Infrastructure Developers share price has declined by 0.51% over the last six months and is down 13.94% on a year-on-year basis.


₹21.25
0.56% down today
₹21.78
1D LOW
1D HIGH

IRB Infrastructure Developers Returns Calculator

Open
₹21.70
High
₹21.78
Low
₹21.25
Prev. close
₹21.42

Circuit
L
H
₹17.04
₹25.56
52-week
L
H
₹19.15
₹24.97

IRB Infrastructure Developers Shareholder Returns

IRB Infrastructure Developers Share Price History

Mkt Cap Cr
25,871.10

P/E
30.60

P/B
1.20

ROE
4.06%

D/E
0.74

ROCE
6.02%

Div. Yield
0.61%

EPS(TTM)
0.82
Turnover
0.18

EV/EBITDA
10.58

Net Margin
0.00%

Op. Margin
0.00%

ROA
1.57%

Quick Ratio
0.00

Curr. Ratio
1.24
Based on fundamentals, this stock's
Step 1 of 5
Performance
Very Poor
IRB Infra.Devl. has not beaten FD return of 7%
Step 1 of 5
Valuation
Overvalued
IRB Infra.Devl. appears overvalued compared to its peers
Step 3 of 5
Earnings
Neutral
IRB Infra.Devl. earnings growth is positive
Peer Comparison
Peer comparison — key ratios
NameMkt Cap CrP/EP/BROED/EROCEBook ValueDiv. YieldTurnoverEPS(TTM)
Larsen & Toubro5,58,594.0029.974.4118.52%0.2414.69%6.471.08%1.7945.71
RVNL49,415.0056.705.038.91%0.5410.68%42.510.72%1.473.84
ACME SOLAR HOLDINGS LTD27,801.4055.873.549.86%0.866.62%109.660.04%0.465.62
Kalpataru Power Transmission23,442.8017.372.3214.42%0.3617.66%481.020.80%2.5648.71
ITD Cementation India24,582.8014.683.6628.24%0.4732.54%3.660.59%3.8834.56
KEC International13,710.6022.642.239.83%0.8412.59%206.841.07%3.1616.08
Engineers India13,168.7019.054.1921.99%0.0128.14%54.142.13%1.2511.36
VA Tech Wabag13,658.8036.935.3214.42%0.0417.57%338.090.23%1.2953.51
Ircon International12,654.6021.391.918.97%0.027.95%70.501.41%1.016.58
Techno Electric & Engineering12,615.6026.623.0311.40%0.0113.41%361.500.65%0.6746.60

IRB Infrastructure Developers Financials

Full statement

Income Statement · Consolidated

Income Statement · Consolidated — all values in INR Crore
ParticularsMar 2025Mar 2024Mar 2023Mar 2022
Revenue₹7,613.47₹7,409.00₹6,401.64₹5,803.70
Other Income₹418.08₹792.76₹301.67₹551.75
Total Revenue₹8,031.55₹8,201.76₹6,703.31₹6,355.45
Total Expenses₹6,837.18₹6,935.47₹5,519.35₹5,579.60
Profit Before Tax₹6,861.39₹951.44₹1,076.95₹549.63
Tax₹380.71₹345.62₹356.94₹188.24
Profit After Tax₹6,480.68₹605.82₹720.01₹361.40
EPS - Basic₹10.73₹1.00₹1.19₹0.87
EPS - Diluted₹10.73₹1.00₹1.19₹0.87

Cash Flow · Consolidated

Cash Flow · Consolidated — all values in INR Crore
ParticularsMar 2025Mar 2024Mar 2023Mar 2022
Profit before tax₹6,861.39₹951.44₹1,076.95₹549.63
Income before WC changes₹3,148.40₹3,374.66₹3,266.02₹2,789.97
Change in Assets-₹657.61₹708.11-₹1,488.08-₹1,877.08
Change in Liabilities-₹349.07₹197.07₹188.15-₹352.49
Change in WC-₹1,006.69₹905.18-₹1,299.93-₹2,229.56
Cash flow from Operations₹1,971.21₹4,053.79₹1,764.13₹364.11
Cash flow from Investing₹375.36-₹3,644.50-₹650.35-₹1,553.43
Cash flow from Financing-₹719.71-₹477.17-₹860.50₹588.57
Total Cash Flow₹1,626.86-₹67.89₹253.28-₹600.76
Cash (Start of the year)₹232.67₹300.56₹47.28₹648.04
Cash (End of the year)₹1,859.53₹232.67₹300.56₹47.28

Balance Sheet · Consolidated

Balance Sheet · Consolidated — all values in INR Crore
ParticularsMar 2025Mar 2024Mar 2023Mar 2022
Non-Current Assets₹47,987.24₹40,080.88₹35,801.08₹37,439.16
Current Assets₹5,908.74₹4,839.43₹6,965.10₹5,127.46
Total Assets₹53,895.97₹44,920.31₹42,766.18₹42,566.62
Current Liabilities₹3,746.24₹3,909.31₹4,304.48₹2,877.38
Net Current Asset₹2,162.49₹930.12₹2,660.62₹2,250.08
Non-Current Liabilities₹30,323.15₹27,266.50₹25,082.80₹27,123.60
Equity Capital₹19,826.58₹13,744.51₹13,378.90₹12,565.64
Total Equity & Liabilities₹53,895.97₹44,920.31₹42,766.18₹42,566.62

Income Statement · Standalone

Income Statement · Standalone — all values in INR Crore
ParticularsMar 2025Mar 2024Mar 2023Mar 2022
Revenue₹5,063.34₹4,826.03₹4,160.44₹2,599.68
Other Income₹747.10₹1,024.68₹402.88₹475.72
Total Revenue₹5,810.44₹5,850.71₹4,563.31₹3,075.40
Total Expenses₹4,792.33₹4,946.95₹4,104.03₹2,645.49
Profit Before Tax₹5,813.03₹903.76₹459.29₹429.91
Tax₹198.97₹141.37₹87.02₹110.12
Profit After Tax₹5,614.06₹762.39₹372.27₹319.79
EPS - Basic₹9.30₹1.26₹0.62₹0.77
EPS - Diluted₹9.30₹1.26₹0.62₹0.77

Cash Flow · Standalone

Cash Flow · Standalone — all values in INR Crore
ParticularsMar 2025Mar 2024Mar 2023Mar 2022
Profit before tax₹5,813.03₹903.76₹459.29₹429.91
Income before WC changes₹359.67₹593.43₹427.57₹681.36
Change in Assets₹112.52-₹238.40-₹612.09-₹385.18
Change in Liabilities₹5.72₹902.40₹460.67-₹544.57
Change in WC₹118.24₹664.00-₹151.43-₹929.76
Cash flow from Operations₹437.67₹1,148.79₹250.07-₹290.50
Cash flow from Investing₹710.38-₹3,795.07-₹25.70-₹268.51
Cash flow from Financing₹511.99₹2,549.45-₹31.46-₹12.40
Total Cash Flow₹1,660.03-₹96.83₹192.90-₹571.40
Cash (Start of the year)₹102.51₹199.35₹6.44₹577.84
Cash (End of the year)₹1,762.54₹102.51₹199.35₹6.44

Balance Sheet · Standalone

Balance Sheet · Standalone — all values in INR Crore
ParticularsMar 2025Mar 2024Mar 2023Mar 2022
Non-Current Assets₹25,904.20₹18,471.31₹13,144.72₹12,606.33
Current Assets₹4,459.06₹3,471.02₹3,787.98₹2,996.14
Total Assets₹30,363.26₹21,942.33₹16,932.70₹15,602.47
Current Liabilities₹6,960.34₹7,044.25₹5,072.77₹4,027.41
Net Current Asset-₹2,501.28-₹3,573.23-₹1,284.80-₹1,031.28
Non-Current Liabilities₹8,705.10₹5,413.82₹2,907.22₹3,087.72
Equity Capital₹14,697.82₹9,484.26₹8,952.71₹8,487.34
Total Equity & Liabilities₹30,363.26₹21,942.33₹16,932.70₹15,602.47
* All values are in INR Crore
Qty
Bid
63647
21.3
0
0
0
0
0
0
0
0
Ask
Qty
0
0
0
0
0
0
0
0
0
0
Bid Total: 63647
Ask Total: 0
Buy orders: 100%
Sell orders: 0%
Bearish
1
Neutral
6
Bullish
1
Neutral
by SEBI experts
Expert Pick
EXPPICK
Stop-loss
Entry price
Target
Indicator
Value
Verdict

RSI (14)
50.17
Neutral

ATR (14)
0.47
Neutral

STOCH(9,6)
32.35
Neutral

STOCH RSI (14)
12.06
Bullish

ADX(9)
23.02
Bearish

UO(9)
39.82
Neutral

ROC(12)
0
Neutral

WillR(14)
-67.65
Neutral
Period
Simple value
Exponential vaue

5D
21.41
21.36

10D
21.42
21.35

20D
21.16
21.3

50D
21.32
21.26

100D
21.19
21.23

About IRB Infrastructure Developers

IRB Infrastructure Developers logo
ISIN
INE821I01022
Sector Market Cap
₹ 25,871.1 Cr

IRB Infrastructure Developers Limited is an infrastructure development company. It engages in constructing roadways and highways. It was founded in 1998 and is headquartered in Mumbai. Earlier known as IRB Infrastructure Developers Private Limited, the company is a part of the IRB Group.

The market capitalisation of IRB Infrastructure Developers Limited is over ₹27,700 crore as of January 9, 2023. IRB Infra share price has gained over 300% in the last three years.

Business operations

IRB Infra is one of India's largest integrated multinationals in transport infrastructure development for roads and highways. It is at the forefront of the build-operate-transfer (BOT) domain. The company has witnessed many firsts in its journey. These include the first-ever BOT project, overseeing the operations and maintenance of the first expressway project, introducing and listing the first Infrastructure Investment Trust (InvIT) becoming the first Indian company to access offshore bond markets and achieving numerous other groundbreaking feats.

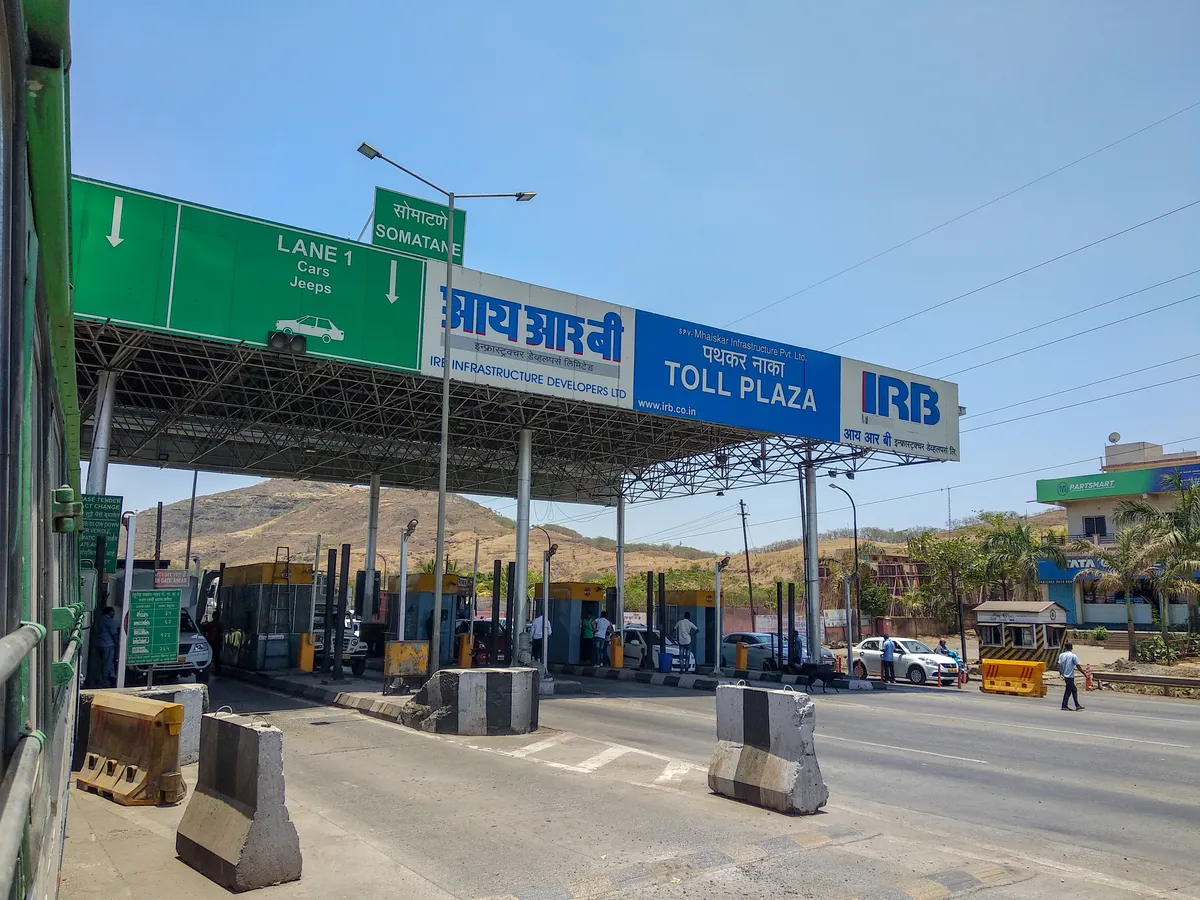
IRB Infrastructure has a significant presence in its sector with 26 highway projects in 12 states. It manages an extensive network of 15,500-lane kilometres in India. Holding a 38% share in India's TOT (toll-operate-transfer) space and a 20% stake in the Golden Quadrilateral Project, the company oversees 64 toll plazas equipped with 736 FASTag-compliant lanes. IRB caters to approximately 1.3 million vehicles daily.

Over the past 25 years, IRB Infra has effectively overseen more than 17,200 lane kilometres of highways. This includes the construction, operation, maintenance, tolling and handover to nodal agencies. Out of these 17,200 lane kilometres, 13,739 are actively managed, operated and tolled, while the remaining 3,461 lane kilometres have been successfully handed back to the nodal agencies. Within the actively managed lane kilometres, 7,156 are operational, with an additional 1,706 undergoing development in the Private InvIT Assets portfolio.

IRB Infra’s key partners include prominent entities like GIC, a sovereign wealth fund based in Singapore, and Cintra, a leading global private developer specialising in transport infrastructure. Cintra operates as a wholly-owned subsidiary of the Ferrovial Group, a firm from Spain with extensive expertise in infrastructure development worldwide.

Its key clients include government bodies such as the Ministry of Road Transport and Highways and the National Highways Authority of India. IRB Infra also collaborates with state-level entities like the Uttar Pradesh Expressways Industrial Development Authority and the Maharashtra State Road Development Corporation. The company also serves the Hyderabad Metropolitan Development Authority of Telangana and partners with government organisations like the Ministry of Civil Aviation and the Maharashtra Industrial Development Corporation in their ventures.

IRB Infrastructure Developers Financial Highlights

  • Revenue: IRB Infrastructure Developers reported revenue of ₹7,853.98 crore in FY26 vs ₹8,031.55 crore in FY25. It showed a decrease of 2.21% on a yearly basis.
  • Operating Profit: IRB Infrastructure Developers reported an operating profit of ₹1,247.82 crore in FY26 vs ₹6,861.39 crore in FY25. It showed a decrease of 81.81% on a year-on-year basis.
  • Net Profit: IRB Infrastructure Developers reported a net profit of ₹850.36 crore in FY26 vs ₹6,480.68 crore in FY25. It showed a decrease of 86.88% on a yearly basis.

IRB Infrastructure Developers Quarterly Result Highlights

  • IRB Infrastructure Developers reported revenue of ₹1,976.89 crore in Mar 2026, compared with ₹1,912.22 crore in Dec 2025, representing an increase of 3.38% on a quarter-on-quarter (QoQ) basis.
  • IRB Infrastructure Developers reported an operating profit of ₹405.61 crore in Mar 2026, compared with ₹295.01 crore in Dec 2025, representing an increase of 37.49% on a quarter-on-quarter (QoQ) basis.
  • IRB Infrastructure Developers reported a profit of ₹296.26 crore in Mar 2026, compared with ₹210.79 crore in Dec 2025, reflecting an increase of 40.55% on a QoQ basis.
  • The earnings per share (EPS) of IRB Infrastructure Developers stood at ₹10.73 during Mar 2026.
Know more
Promoters
30.79%
FII
43.85%
Other DII
5.41%
Retail and other
15.34%
Mutual funds
4.61%
Foreign institutions - FII
Compare against other stocks
IRB Infrastructure Developers logo
IRB Infrastructure Developers
Engineering
Add Stock
Add Another

FAQs on IRB Infrastructure Developers Share Price