Gujarat Mineral Development Corporation Ltd (GMDC) is one of India’s leading mining and mineral processing companies. Owned by the government of Gujarat, GMDC was founded in 1963. It is headquartered in Ahmedabad. GMDC is also recognised as one of the top five organisations in the mining sector based on market capitalisation.
Gujarat Mineral Development Corporation's market capitalisation is over ₹13,900 crore as of January 4, 2024. GMDC share price has gained over 640% in the last three years.
Business operations
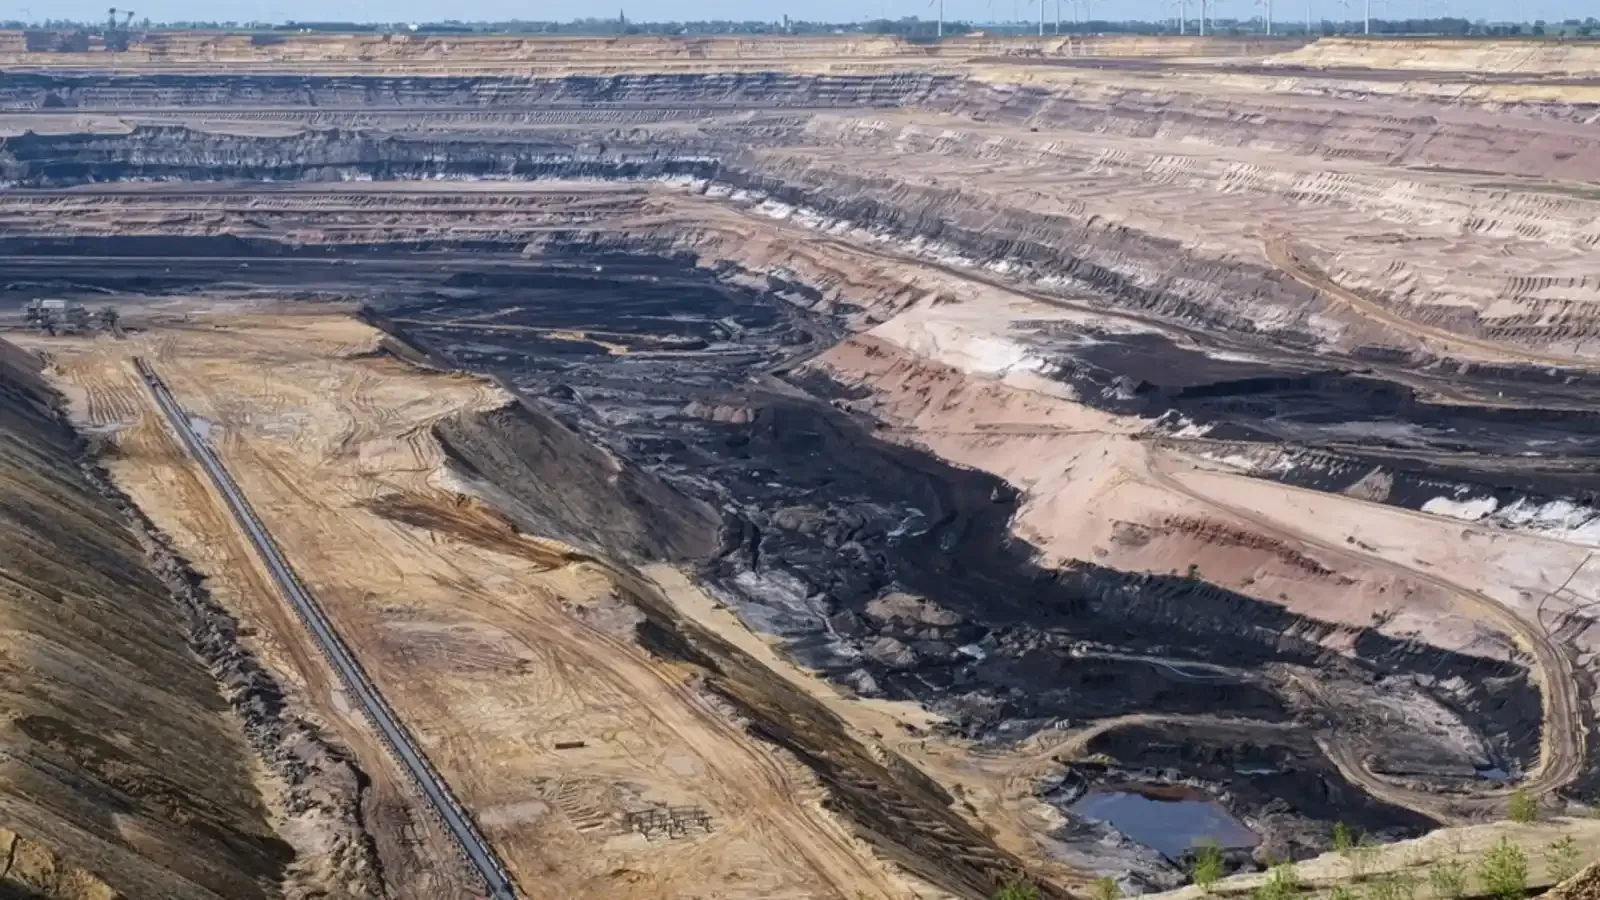
GMDC is involved in the mining and mineral processing business. Its product lineup includes lignite and fluorspars. It has five operational lignite mines located in Kutch, South Gujarat and Bhavnagar regions. GMDC is a leader in exploring and supplying lignite across Gujarat. It extracts lignite from rich deposits throughout the state and supplies it to various thriving industries like textiles, chemicals, ceramics, bricks and captive power.
The company produces two varieties of fluorspar, acid and metallurgical. Fluorspar finds application in industries such as steel and aluminium. GMDC owns a fluorspar mine at Ambadungar in Udepur district. Located in an area lacking manufacturing and industrial facilities, the Ambadungar Fluorspar Mine and Kadipani Beneficiation Plant significantly contribute to employment creation and economic empowerment in the region.
The company also operates in the business segments of power projects and mining projects. It is engaged in exploring bauxite, fluorspar, manganese, silica sand, limestone, bentonite and ball clay. These serve diverse purposes across industries, from producing hydrofluoric acid to manufacturing glass and ceramics and drilling for oil.
GMDC ensures a smooth fulfilment of Gujarat's demand for both plant-grade and non-plant-grade bauxite. These deposits are strategically grouped with several smaller deposits situated close to each other. Currently, it manages nine bauxite mines, eight of which are in the Kutch district (Gadhsisa Group of Bauxite Mines), and one is situated in the region of Devbhumi Dwarka.
GMDC’s manganese mines are located at Panchmahal, Vadodara, Dahod, Bamankuva, Bapotiya, Pani and Salapada. Its silica sand mines are located at Rajpardi in Bharuch.
The company's bentonite mines are in Surkha North, Bhavnagar while limestone mines are located in Kutch region of Gujarat.
GMDC holds a significant presence in the energy sector as well. It has a diverse portfolio comprising thermal power and renewable energy projects in wind and solar power. The company has generated over 2,522,416 MW of green energy to date.
GMDC owns and runs Akrimota thermal power station. Operational since March 2005, it consists of two units generating 125 MW each. This power station utilises lignite as its primary fuel source.
Gujarat Mineral Development Financial Highlights
- Revenue: Gujarat Mineral Development reported revenue of ₹3,077.25 crore in FY26 vs ₹3,199.42 crore in FY25. It showed a decrease of 3.82% on a yearly basis.
- Operating Profit: Gujarat Mineral Development reported an operating profit of ₹1,267.74 crore in FY26 vs ₹888.71 crore in FY25. It showed an increase of 42.65% on a year-on-year basis.
- Net Profit: Gujarat Mineral Development reported a net profit of ₹956.67 crore in FY26 vs ₹679.85 crore in FY25. It showed an increase of 40.72% on a yearly basis.
Gujarat Mineral Development Quarterly Result Highlights
- Gujarat Mineral Development reported revenue of ₹968.94 crore in Mar 2026, compared with ₹662.25 crore in Dec 2025, representing an increase of 46.31% on a quarter-on-quarter (QoQ) basis.
- Gujarat Mineral Development reported an operating profit of ₹234.65 crore in Mar 2026, compared with ₹179.42 crore in Dec 2025, representing an increase of 30.78% on a quarter-on-quarter (QoQ) basis.
- Gujarat Mineral Development reported a profit of ₹194.09 crore in Mar 2026, compared with ₹133.06 crore in Dec 2025, reflecting an increase of 45.87% on a QoQ basis.
- The earnings per share (EPS) of Gujarat Mineral Development stood at ₹21.57 during Mar 2026.