Market News
Week ahead: US Fed interest rate decision, gold prices, US tariff concerns among key market triggers to watch out
.png)
5 min read | Updated on March 16, 2025, 09:40 IST


SUMMARY
In the coming week, traders will closely watch interest rate decisions from the US Federal Reserve and the Bank of Japan, which will shape market trends. Technically, the NIFTY50 index is consolidating between 22,800 and 22,300. A decisive breakout from this range will offer clearer direction.

Crucial support for NIFTY50 is around 21,800 level, while resistance is around 23,300 level. | Image: Shutterstock
Amid weak global signals, markets failed to extend the previous week’s gains and traded within a narrow range. The NIFTY50 index hovered around 22,500 and closed at 22,397, down 0.3%.
The volatility stemmed from U.S. President Donald Trump’s tariff threats which triggered a sharp decline in U.S. indices. However, domestic factors remained positive. India’s retail inflation dropped to 3.75% in February, below the Reserve Bank of India’s 4% target. Additionally, lower crude prices and a sustained decline in the dollar index helped limit losses.
All major sectoral indices ended the week in the red except FMCG and Pharma which were flat. IT (-4.4%) and PSU Banks (-2.4%) were the major losers. Meanwhile, sentiment in the broader markets remained weak as the Midcap 100 index fell 2.1% while the Smallcap 100 index plunged 3.9%.
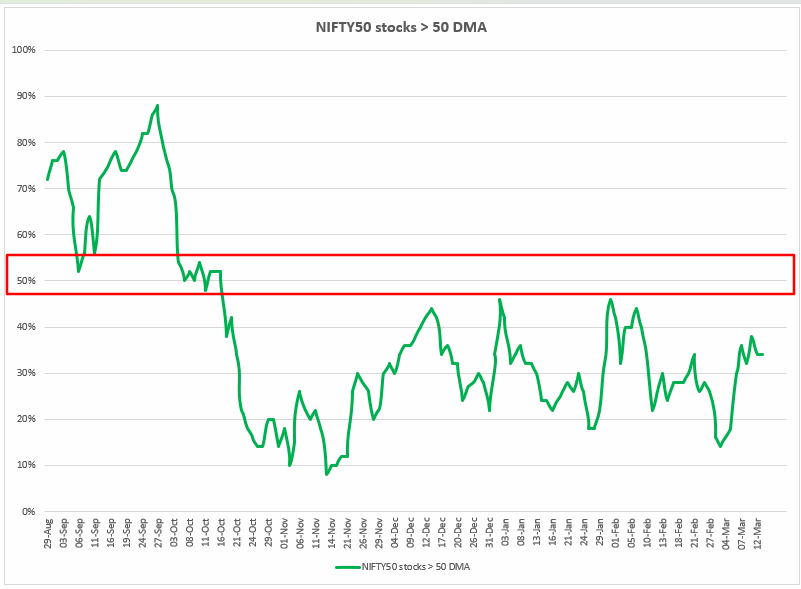
Index breadth
The breadth of the NIFTY50 index remained sluggish as the average 35% of the NIFTY50 stocks traded above their respective 50-day moving average last week. However, it remains below the crucial 50% level, signalling ongoing market weakness. This indicator has failed to break above the 50% level for more than five months.
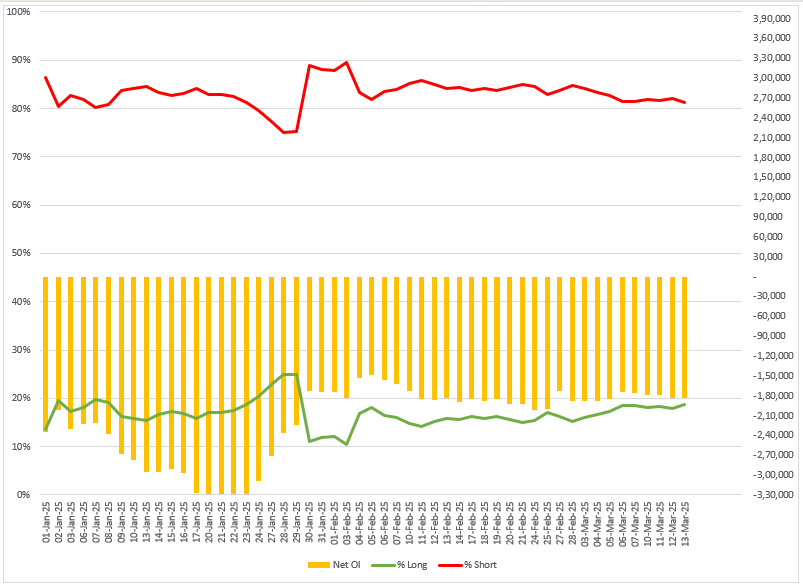
FIIs positioning in the index
Foreign Institutional Investors (FIIs) maintained their stance on index futures, with the long-to-short ratio holding steady at 19:81. This reflects a net open interest (OI) of -1.8 lakh contracts, indicating a predominantly short position.
Since the start of 2025, both the net OI and the long-to-short ratio have favoured short positions. Unless there’s substantial unwinding or short-covering, the broader market trend may remain weak.
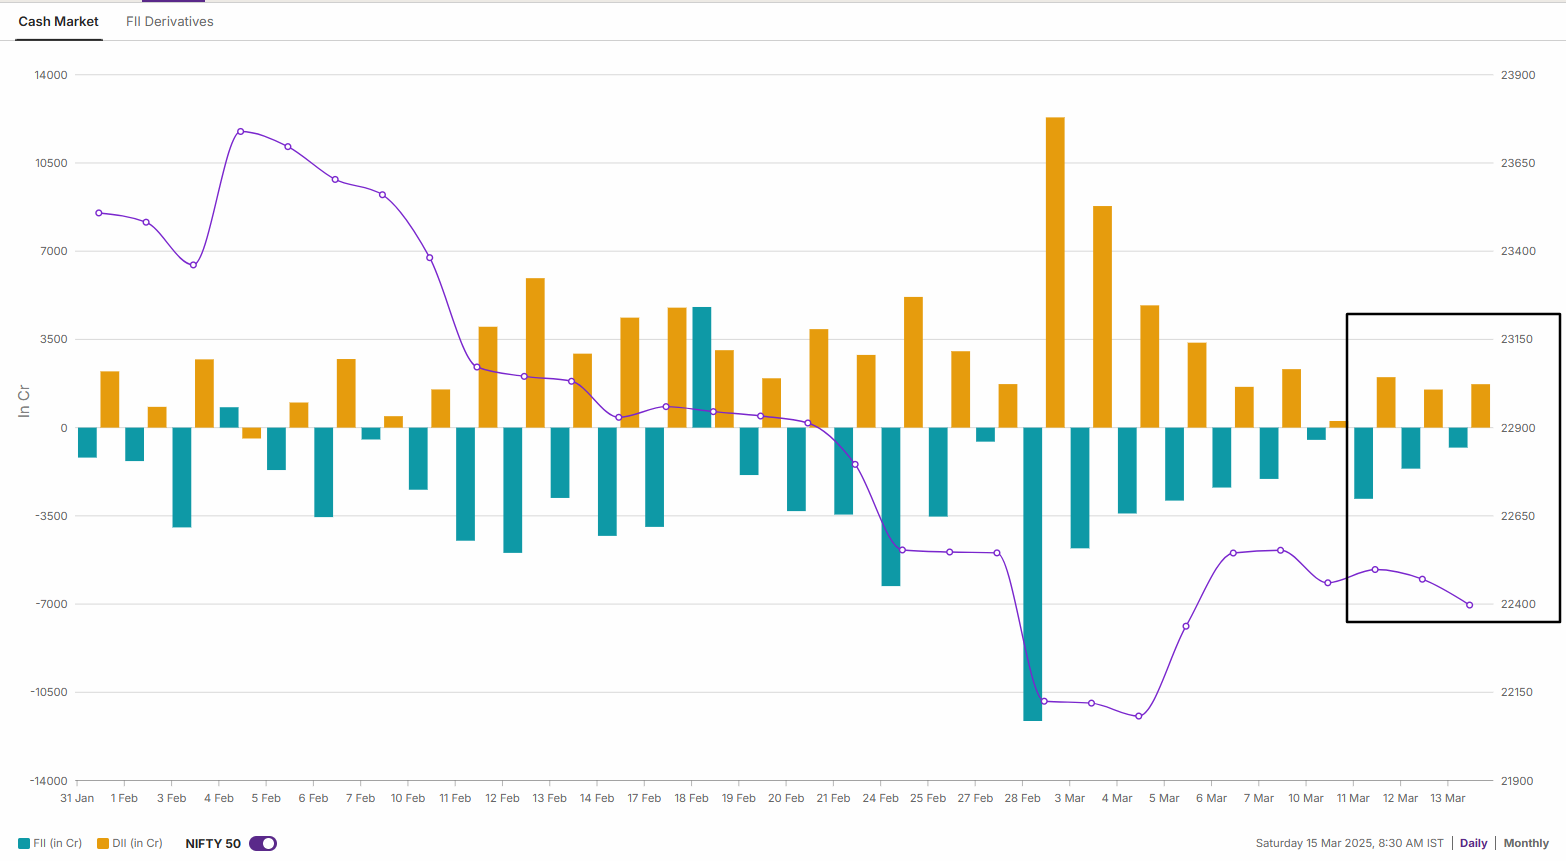
However, the intensity of FII sell-offs in the cash market has eased compared to the last five months. While they remained net sellers, the ₹5,738 crore worth of shares sold marked the lowest weekly figure since October 2025. Meanwhile, Domestic Institutional Investors (DIIs) continued to be net buyers, purchasing shares worth ₹5,499 crore.
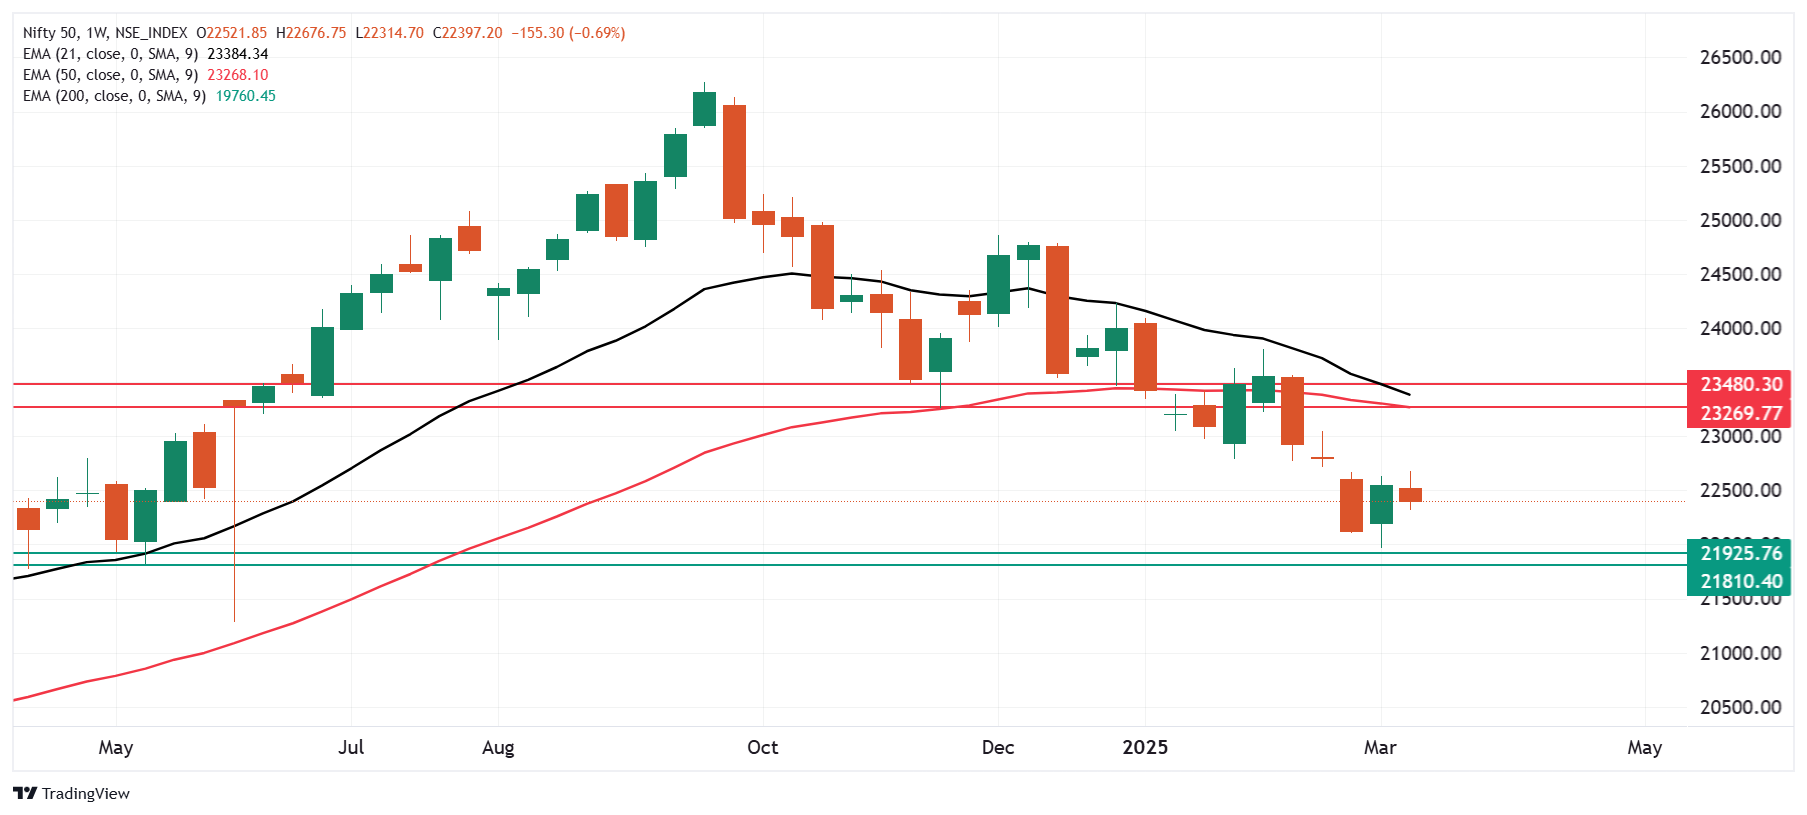
NIFTY50 outlook
The technical structure of the NIFTY50 index remains range-bound as per the weekly chart. It formed a small red candle and failed to close above the previous week’s high, thus failing to confirm the bullish reversal hammer candlestick pattern.
As shown on the chart below, the crucial support for the index remains around 21,800 zone, while the resistance of the index is around 23,300 zone. Within this range, the index may remain volatile and range-bound. A breakout of this range will provide further directional insights.
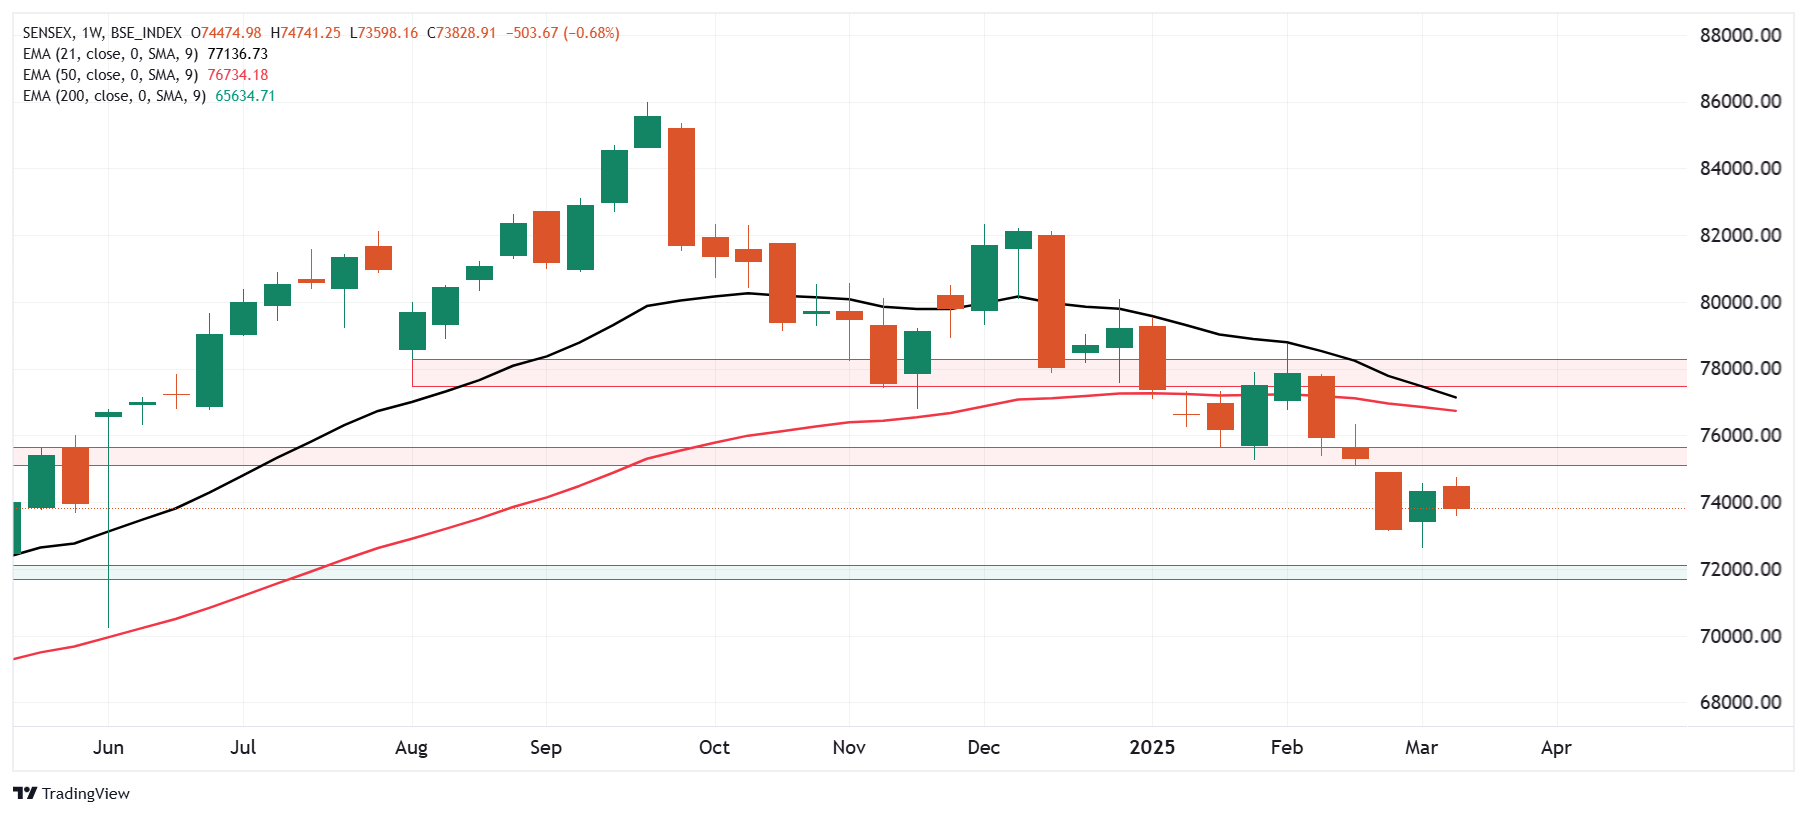
SENSEX outlook
The technical structure of the SENSEX as per weekly chart remained range-bound, consolidating broadly within previous week’s range. It also faced resistance around the 74,800 zone and failed to confirm the bullish hammer candlestick pattern on the weekly chart.
The short-term trend of SENSEX has turned sideways within the broad range of 75,600 and 72,000. A break of this range on a closing basis will provide further directional clues.
In the upcoming sessions, traders should monitor the 22,800 to 22,300 range on a closing basis. A breakout on either side will provide short-term direction. The broader trend remains confined between the 23,300 resistance and 21,800 support levels.
For intraday range updates and revisions to these levels, visit our daily morning trade setup blog, published at 8 AM before the market opens.
About The Author
Next Story


