Market News
Week ahead: US Fed interest rate decision, global cues, and FII action are among key market triggers to watch
.png)
6 min read | Updated on September 16, 2024, 09:13 IST
SUMMARY
All eyes this week will be on the US Federal Reserve as the central bank is poised to cut the interest rates for the first time since 2020. As of Friday, Fed funds futures are pricing in an equal 50% chance of a 25 basis point and 50 basis point cut in rates.
Stock list

US Fed interest rate decision and global cues could impact stock market movement this week
The markets erased the losses of the previous week and hit a new all-time high, invalidating the bearish engulfing pattern that had formed on the weekly chart in the previous week. The NIFTY50 index closed at a record high of 25,356, up 2%.
The strong rally in the indices was largely the result of buying in all sectors, with the exception of Oil & Gas (-2.6%). Consumer Durables (+3.7%) and FMCG (+2.9%) indices saw significant buying.
Meanwhile, the broader markets also ended the week in green, with the NIFTY Midcap 100 index (+2.6%) hitting a new all-time high and Smallcap 100 index advancing over 1%.
Index breadth- NIFTY50
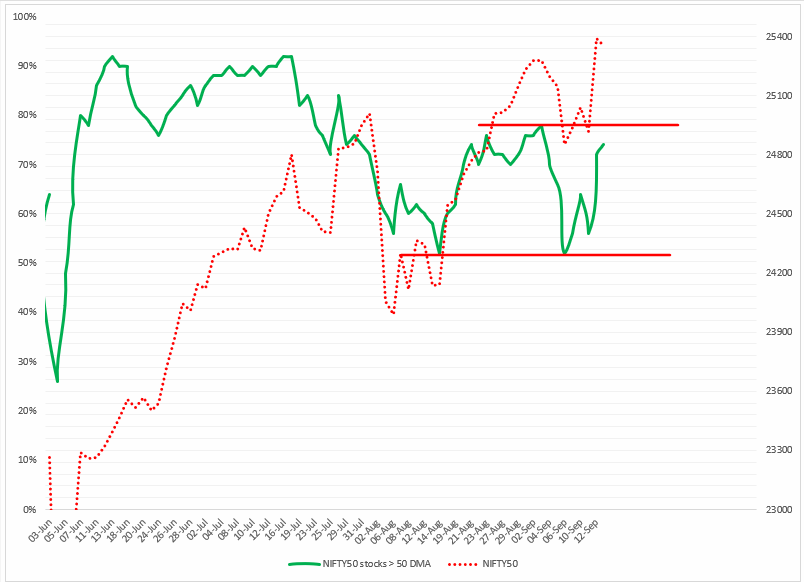
The breadth of the NIFTY50 index showed a strong recovery from its low on the 6th of September, as the percentage of NIFTY50 stocks trading above their respective 50-day moving averages (DMAs) stabilised around the 50% level.
As shown in the chart below, the breadth indicator ended the week with 74% of the NIFTY50 stocks trading above their respective 50 DMAs. In the coming sessions, this reading could continue to rise, possibly reaching the recent high of 78% (highlighted by the red line). Until then, the index's overall trend remains bullish.
FIIs positioning in the index
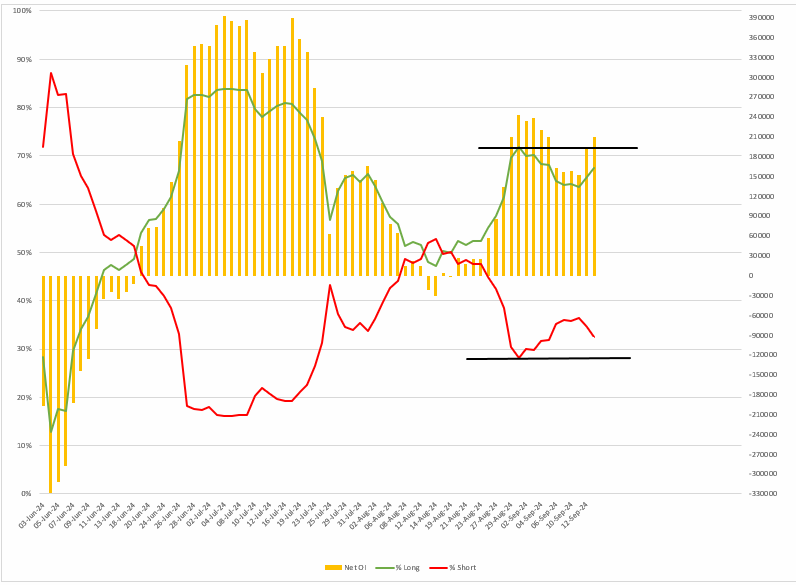
Foreign Institutional Investors (FIIs) started the previous week with a 65:35 long-to-short ratio in index futures. FIIs maintained their long position at 64% till Wednesday 11th and then increased it to 66% by the weekly expiry of NIFTY50 options contracts, triggering a sharp rally of nearly 2%.
F&O - NIFTY50 outlook
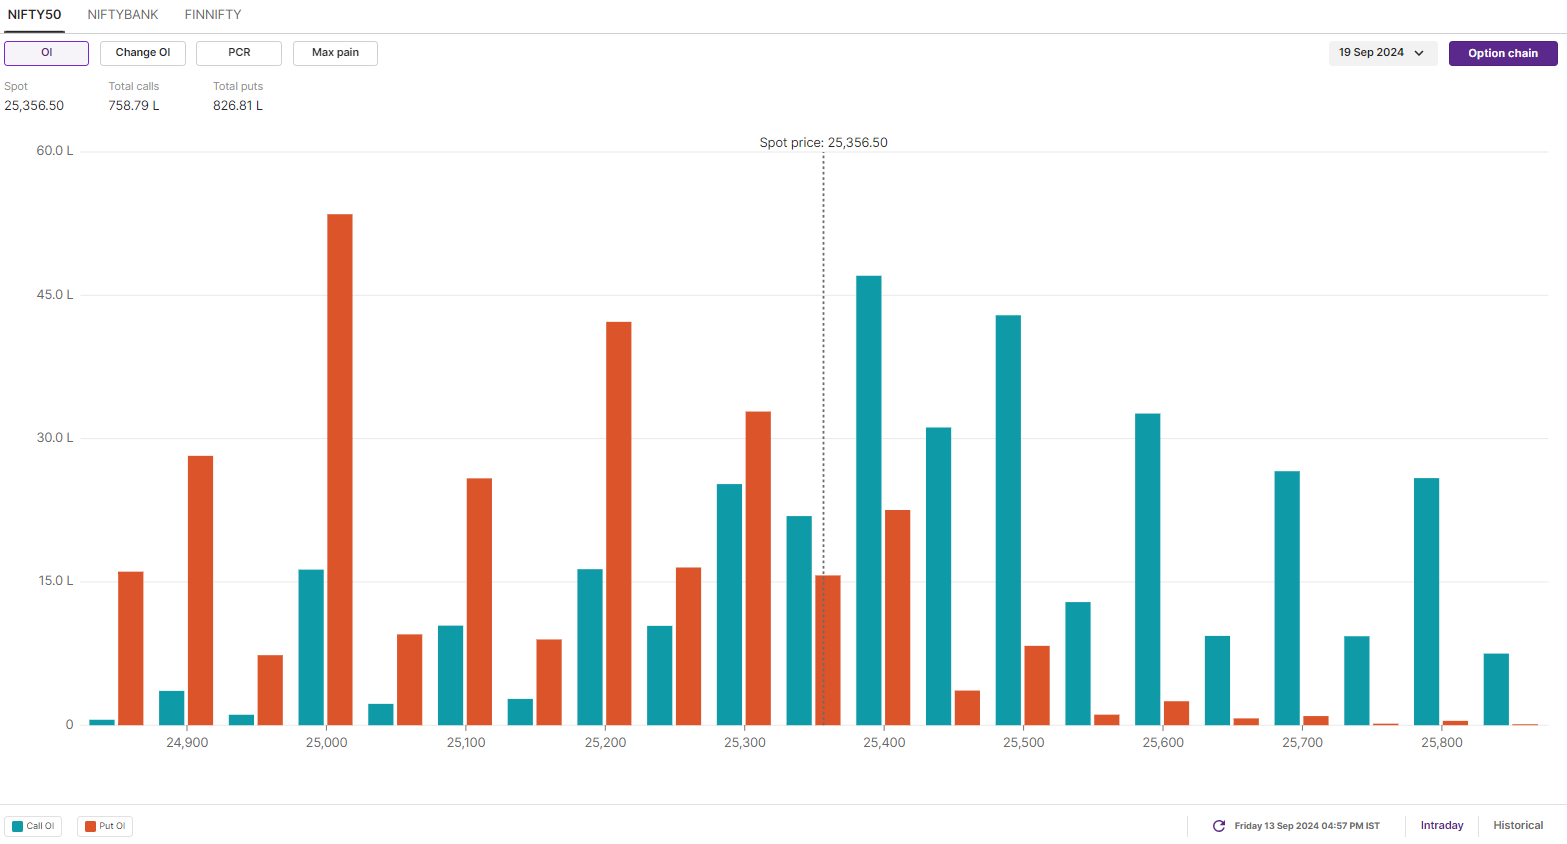
The open interest data for the 19 September expiry has substantial put base at the 25,000 strike, signaling support for the NIFTY50 index around this level. Meanwhile, significant call open interest is seen at 24,400 and 25,500 strikes, indicating pointing resistance at these levels. Additionally, a notable build-up of open interest of both call and put options at the 25,300 strike suggests possible consolidation around this level.
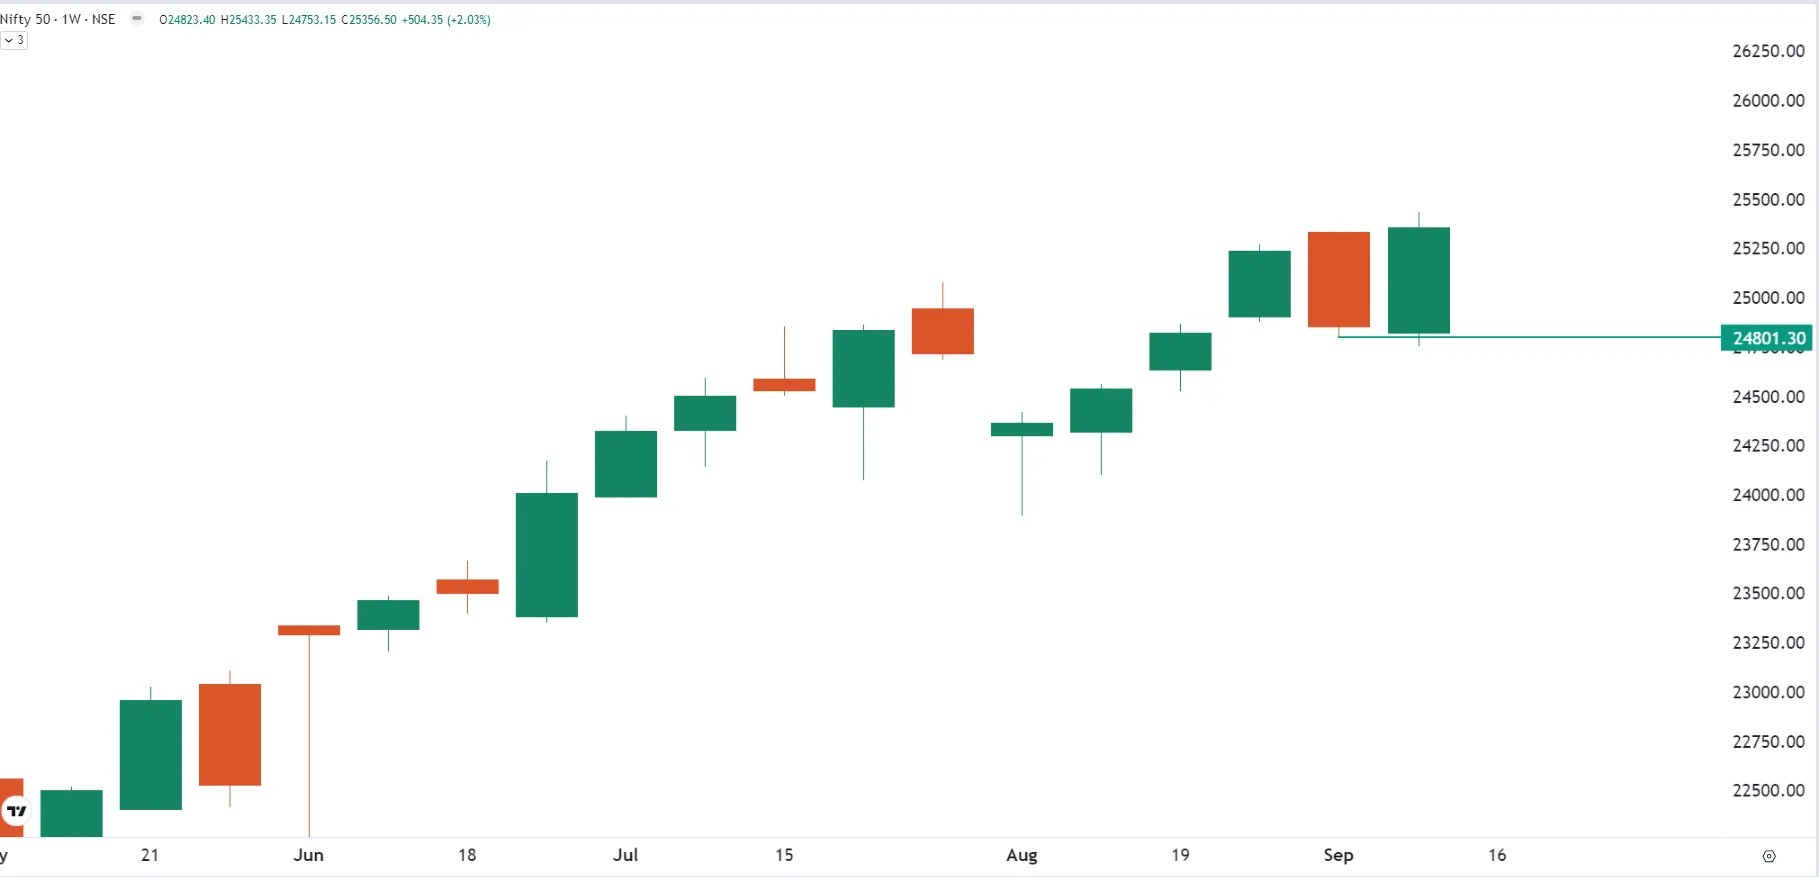
On the technical front, the NIFTY50 index reversed sharply, with the bulls invalidating the previous week's bearish engulfing candle on the weekly chart. On Thursday the 12th, the index surged almost 2%, regaining its previous all-time high and forming a bullish engulfing candle on the weekly chart. This signals strong bullish momentum going forward, with immediate support aroun 24,800 zone. However, if the index closes below the 25,200 level on the daily chart, it may remain range bound.
F&O - BANK NIFTY outlook
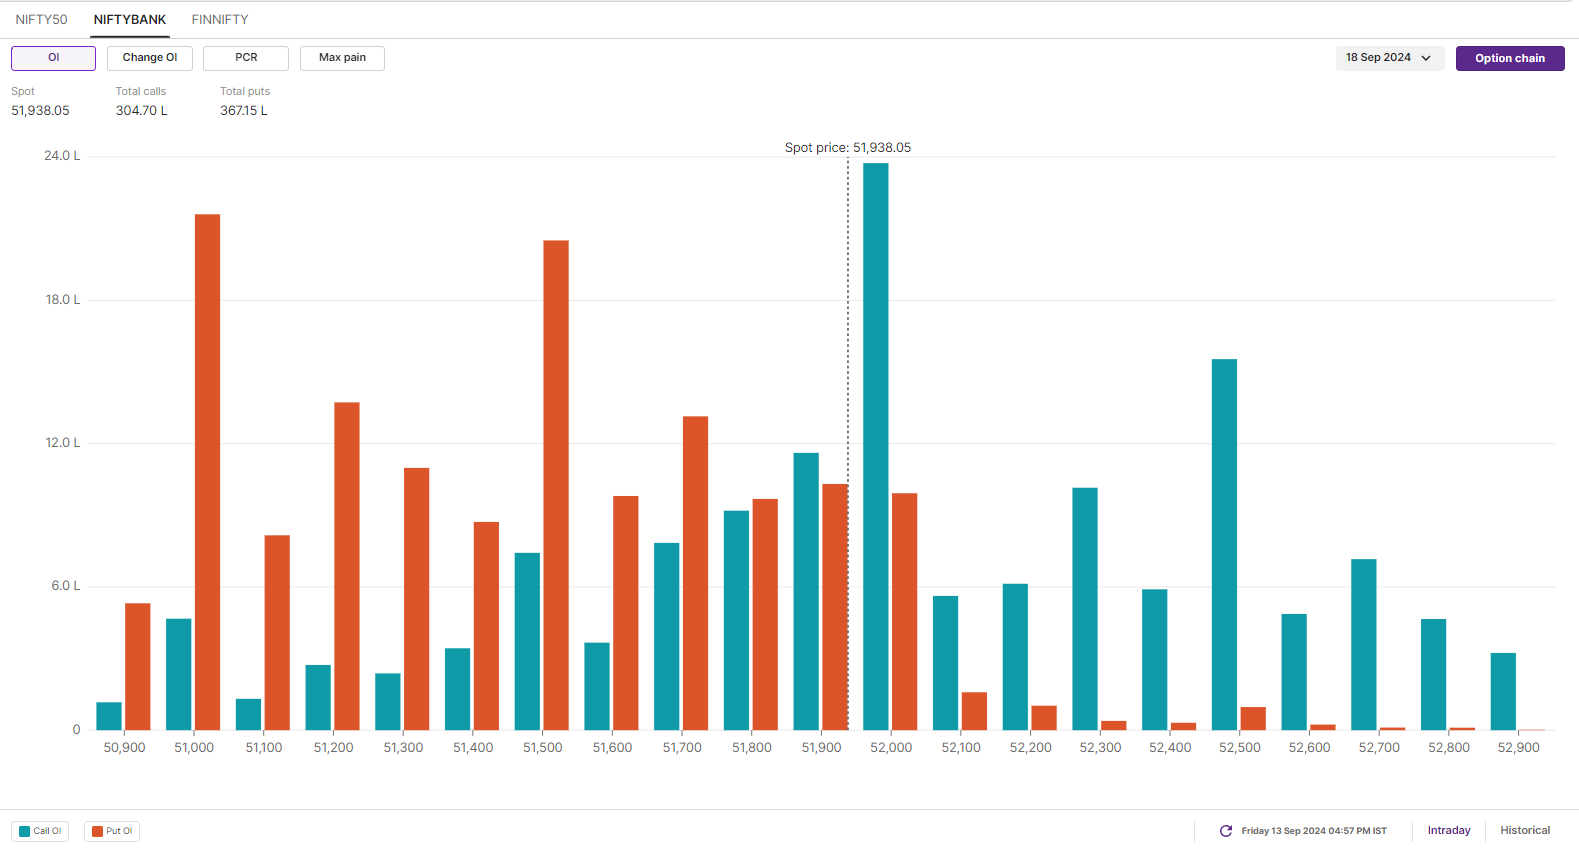
The positioning of the open interest for BANK NIFTY’s 18 September expiry has highest call open interest base at 52,000 strike, pointing at resistance for the index around this zone. On the other hand, the put base is established at 51,000 and 51,500, indicating support at these levels.
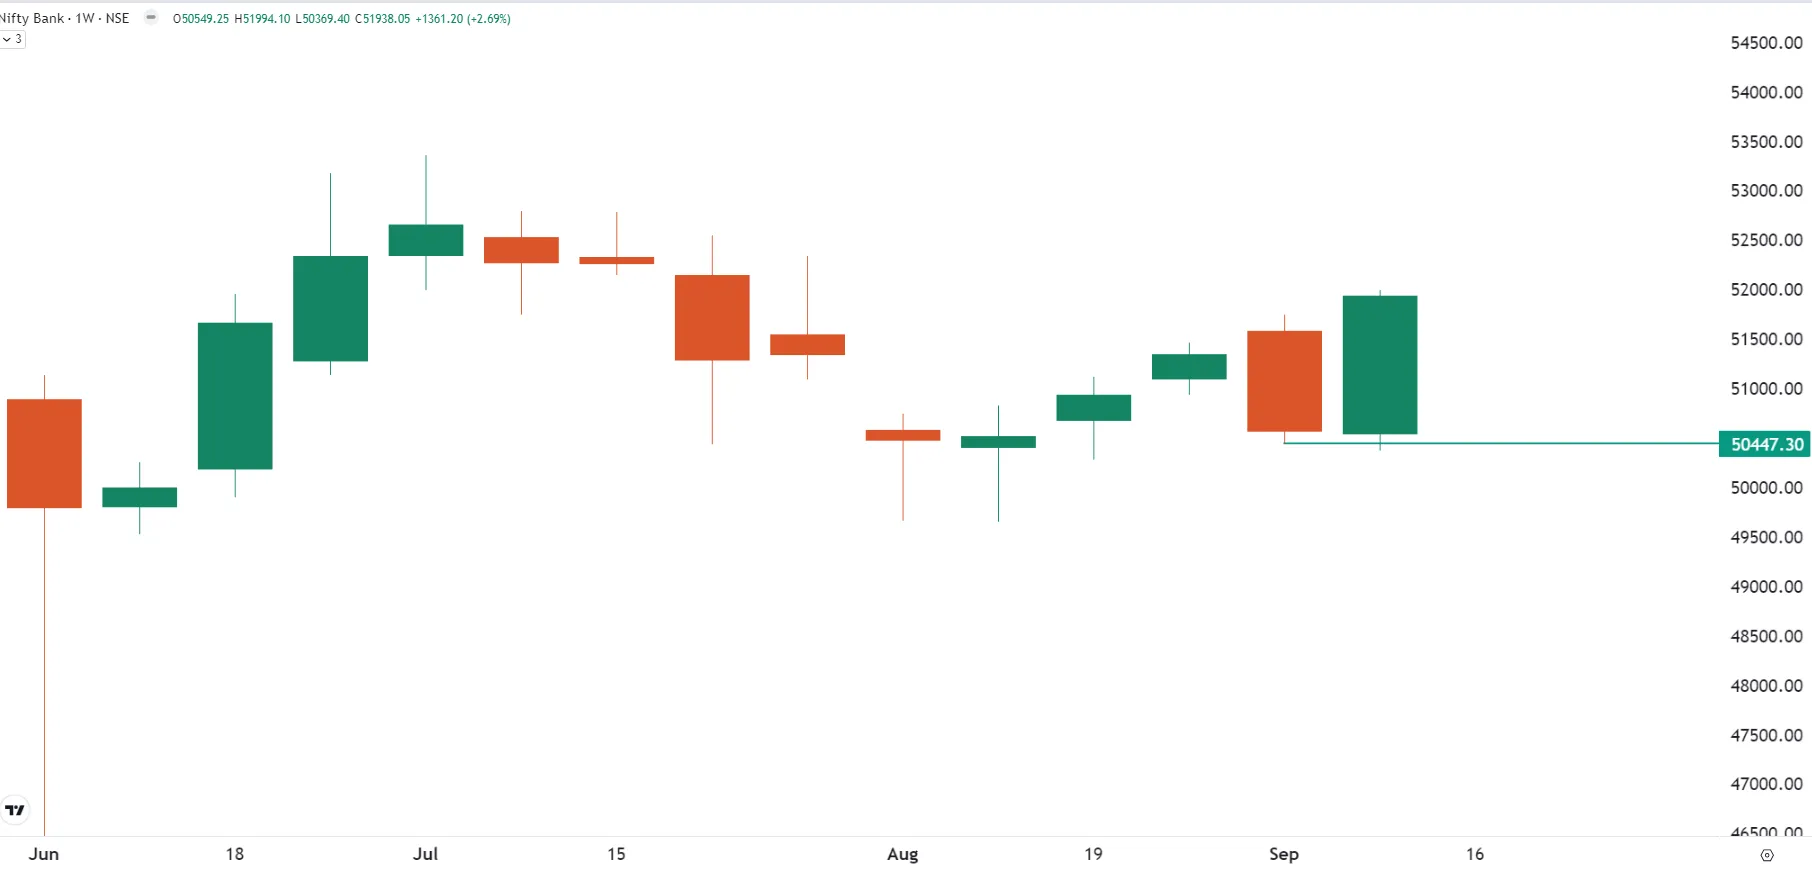
BANK NIFTY also demonstrated strong bullish momentum by forming a bullish engulfing candle on the weekly chart. The index surged nearly 3% and outperformed the benchmark indices. Additionally, BANK NIFTY broke out of a seven-day consolidation on the daily chart, closing above its recent swing high of 51,750.
Going forward, the index has immediate support between 50,500-50,300 zone. As long as index hold this zone on closing basis, the trend is likely to remain positive. On the upside, the resistance is around 52,300 zone. If index breaks this zone, then it may advance towards its previous all-time high.
In addition, the Bank of England and the Bank of Japan will announce their interest rate decisions on 19 and 20 September respectively.
In the upcoming sessions, the NIFTY50 has established an immediate support base around 24,800 zone. As long as the index remains above this level, the bullish trend is likely to continue, with any retracements seen as the buying opportunities. However, if the index falls below the 25,100 level on daily chart, the index may become range-bound and witness sharp bouts of volatility.
To stay updated on any changes in these levels and all intraday developments, be sure to check out our daily morning trade setup blog, available before the market opens at 8 am.
About The Author
Next Story

