Market News
Week ahead: US and India GDP, Reliance AGM and monthly expiry among key factors to watch this week
.png)
7 min read | Updated on August 26, 2024, 07:38 IST
SUMMARY
The broader trend of the NIFTY50 index remains positive, and it may attempt to fill the second bearish gap between the 24,850 and 24,950 zones. However, the index faces immediate resistance near its previous all-time high around 25,100. A close above this level on the daily chart could ignite fresh momentum.
Stock list
The weekly chart of the BANK NIFTY indicates a rebound, with index closing above the previous week’s high and breaking out of a two-week consolidation.
Markets continued their winning streak for the second consecutive week, approaching their previous all-time high. This bullish momentum in benchmark indices was led by positive global cues, including growing expectations of a rate cut in U.S. in September, falling crude oil prices and reduced selling by Foreign Institutional Investors as the dollar index declined.
On 26 August, the markets will react to Fed Chairman Jerome Powell’s speech at the Jackson Hole Symposium. In his Friday address, the Fed chair indicated that the time has come for the policy to adjust, affirming the expectations that the Fed will start lowering interest rates in upcoming meetings.
Meanwhile, broader markets also continued their winning streak for the second consecutive week, closing in the green. The NIFTY Mid cap 100 index gained 1.5%, while the Small cap 100 index surged 3.4%. Sector-wise, all the major indices finished the week in positive territory, except for Real-Estate (-2.9%). The Metals (+3.3%) sector led the gains, followed closely by Consumer Durables (+3.1%).
Index breadth- NIFTY50
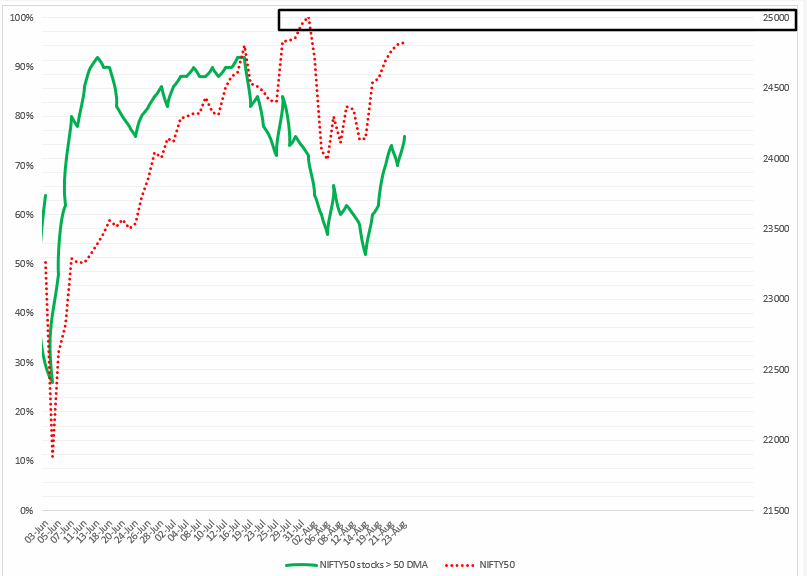
The breadth of the NIFTY50 index remain positive last week, with the percentage of stocks trading above their 50-day moving average (DMA) increasing from 62% to 76%. As of 23 August, about 76% of NIFTY50 stocks are above their 50-DMA, siganlling continued bullish momentum.
However, as the index nears its previous all-time high, traders should be cautious of potential profit booking at higher levels. While the overall trend of the NIFTY50 remains positive, a sustained move of the breadth indicator (NIFTY50 stocks> 50 DMA) above 76% could further fuel bullish momentum. Conversely, weakness in the index may surface if the breadth indicator drops below 70%, as a range between 50% and 70% suggests range-bound activity with increased volatility.
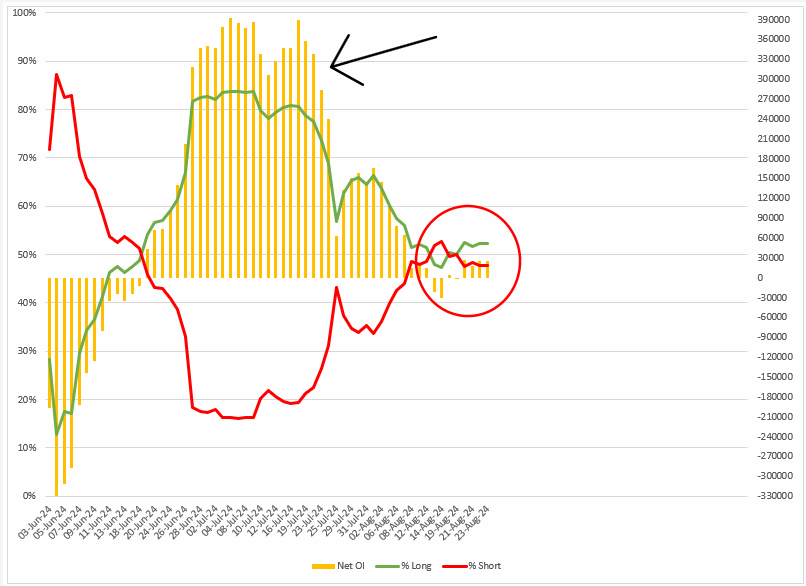
FIIs positioning in the index
Foreign Institutional Investors (FIIs) maintained their neutral and low volume stance in the open interest in the index futures. The FIIs started last week with a long-to-short ratio of 50:50 and maintained their neutrality by moving and maintaining the ratio to 52:48 throughout the week, indicating an indecisive or wait-and-watch stance.
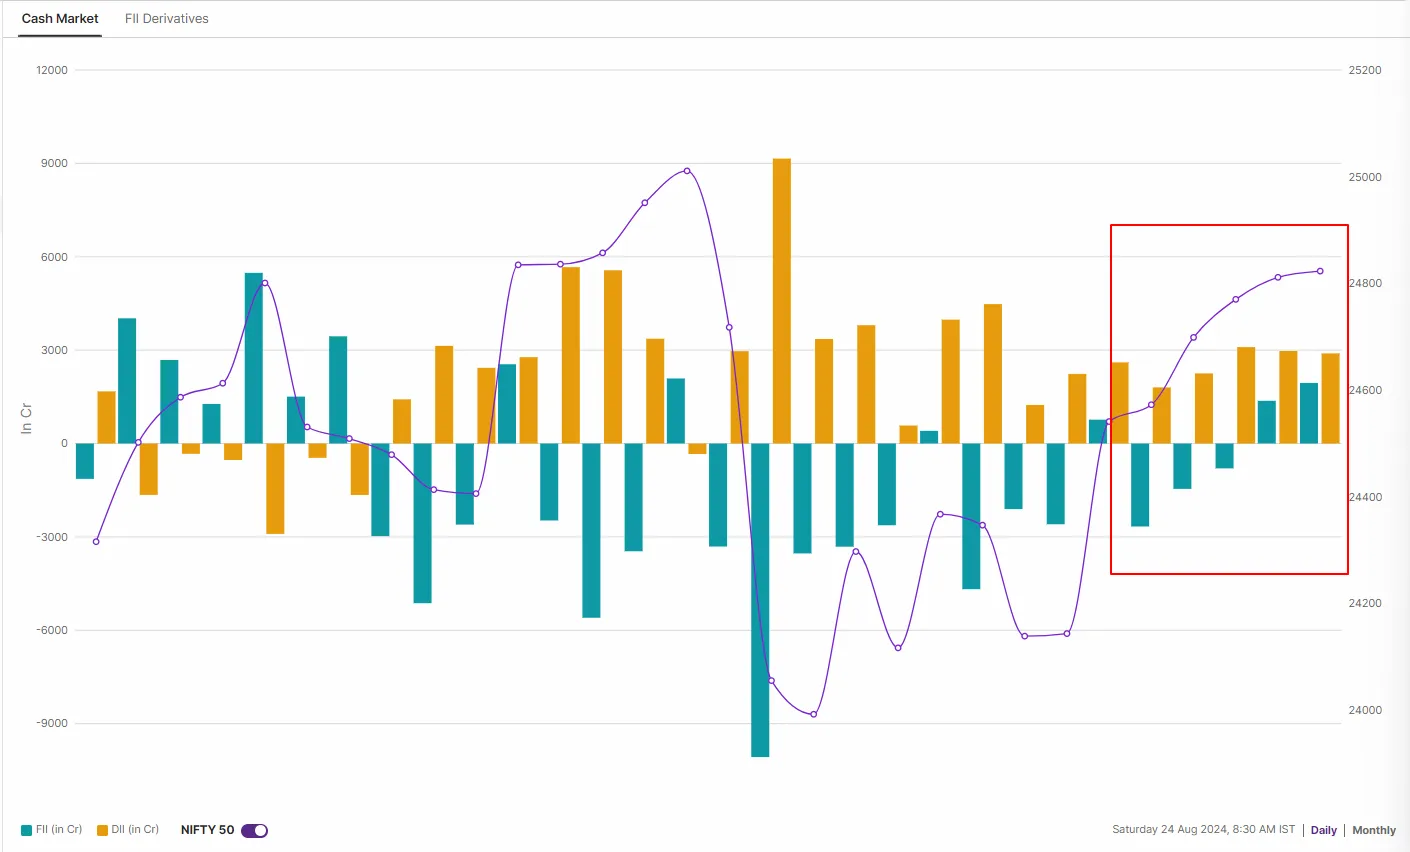
Meanwhile, the neutrality in index futures was reflected in the cash market activity of FIIs last week.The FIIs reduced the quantum of selling in the cash market and sold shares worth ₹1,608 crore on a net basis. On the other hand, domestic institutional investors bought shares worth ₹13,020 crore, taking the net institutional inflow to ₹11,411 crore.
F&O - NIFTY50 outlook
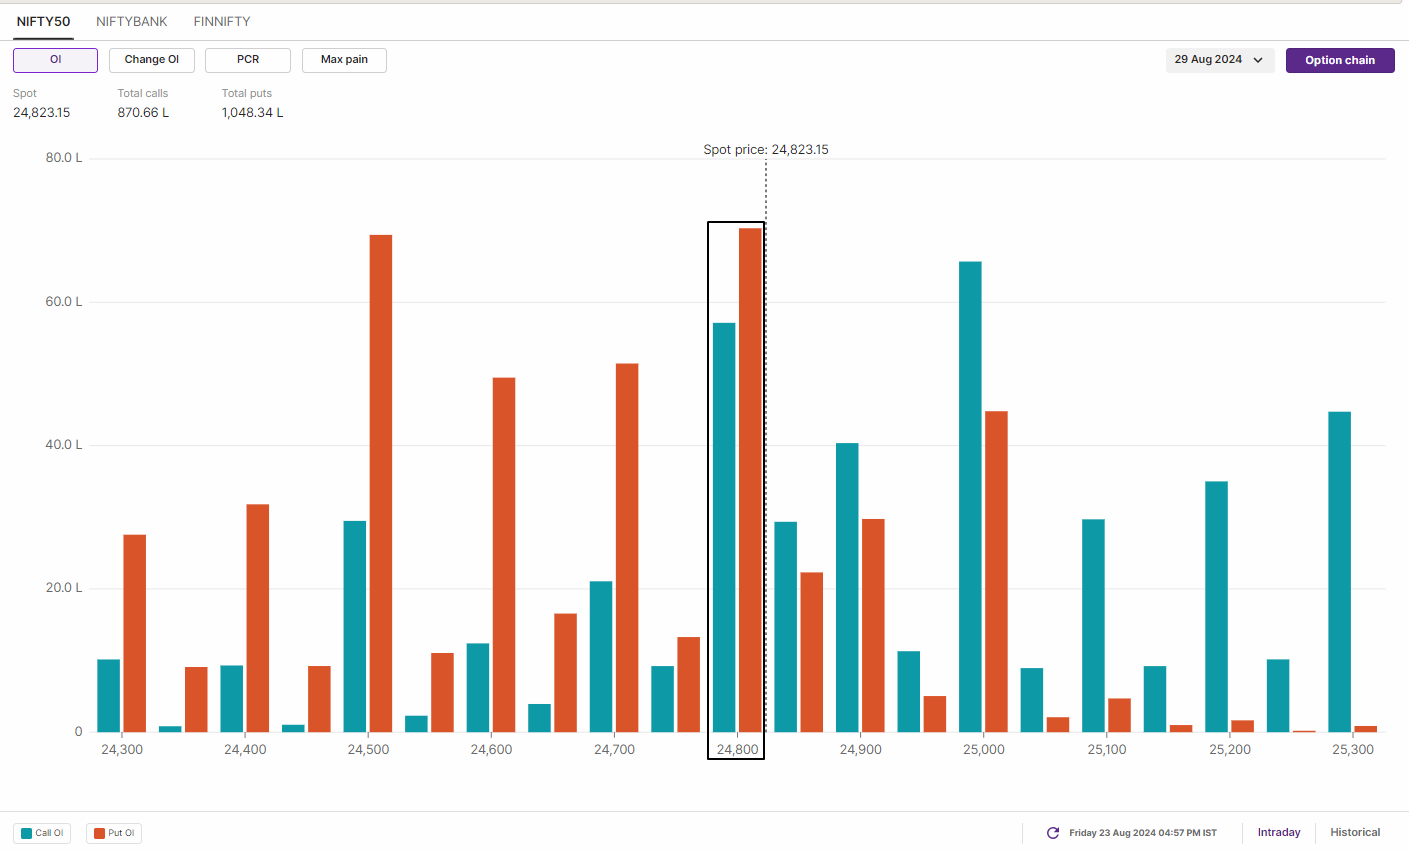
Open interest (OI) data for the monthly expiry of the NIFTY50 shows the highest call OI at the 25,000 strike, while put OI stands at 24,500. These key levels could act as immediate support and resistance levels for the index. Additionally, the index has also witnessed significant call and put option additions at the 24,800 strike, indicating range-bound activity around this level.
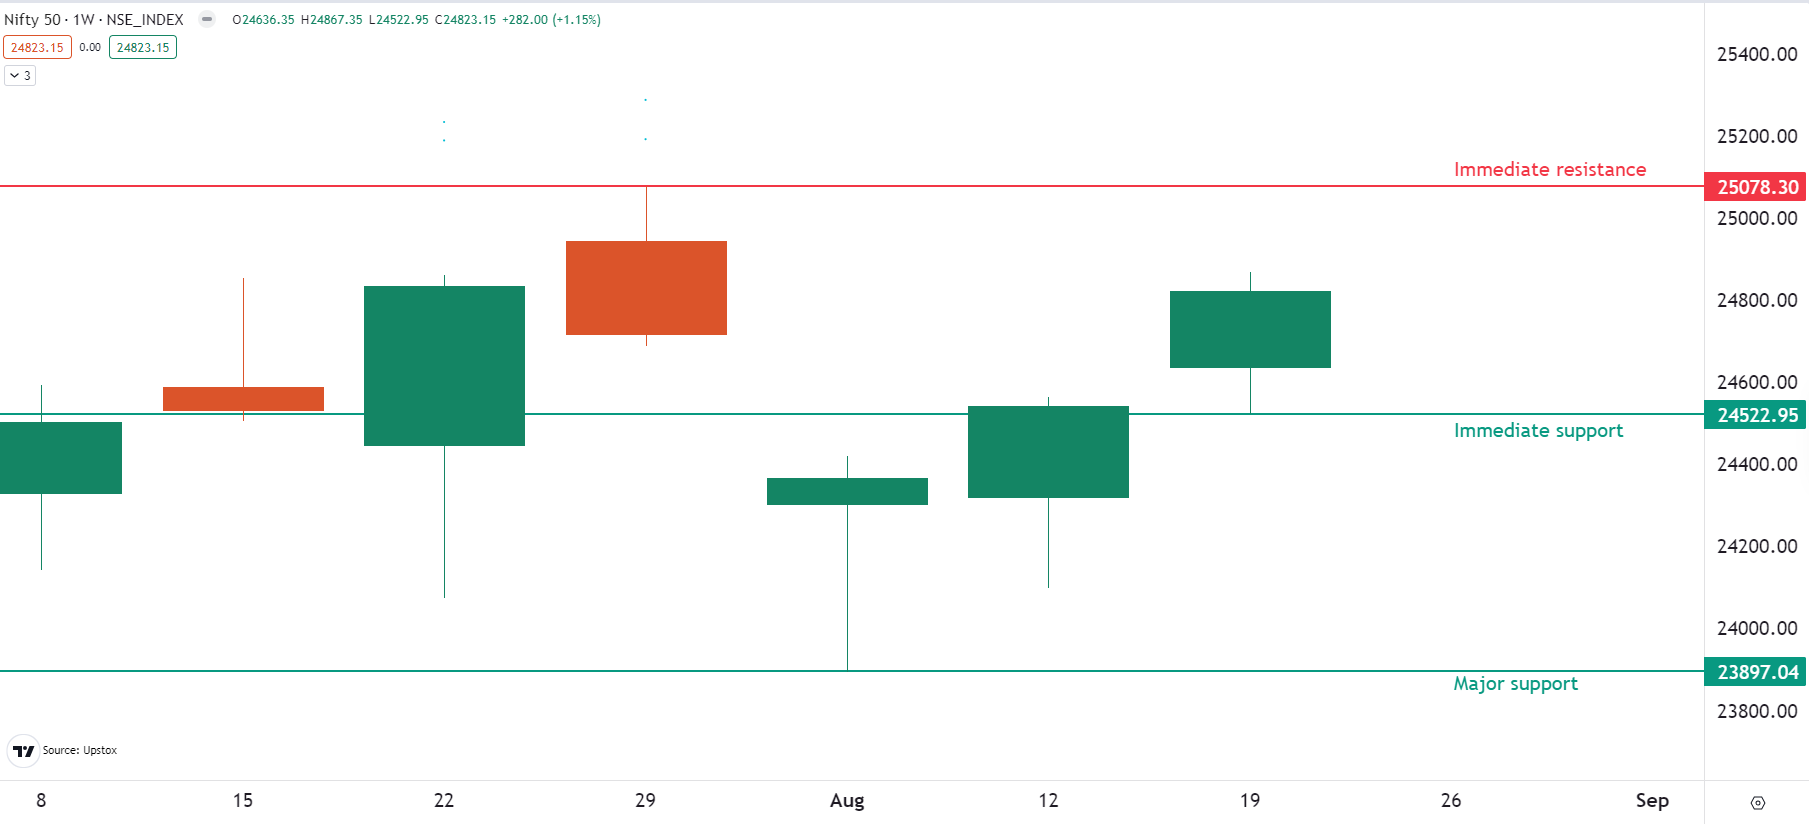
The technical structure of the NIFTY50 index however signals the continuation of the bullish momentum. The index closed above previous week’s high, filling the first bearish gap formed on 5 August. Moreover, the index also reclaimed its 20-day moving average and is currently trading above all key daily moving averages (20 and 50).
While the broader trend of the index remains bullish, it has consolidated its gains around the second bearish gap between the 24,850 and 24,950 zone over the past two days. In the coming week, the index faces immediate support around the 24,500 zone, while the resistance is situated around the 25,100 level. A break above or below these levels could trigger a directional move.
F&O - BANK NIFTY outlook
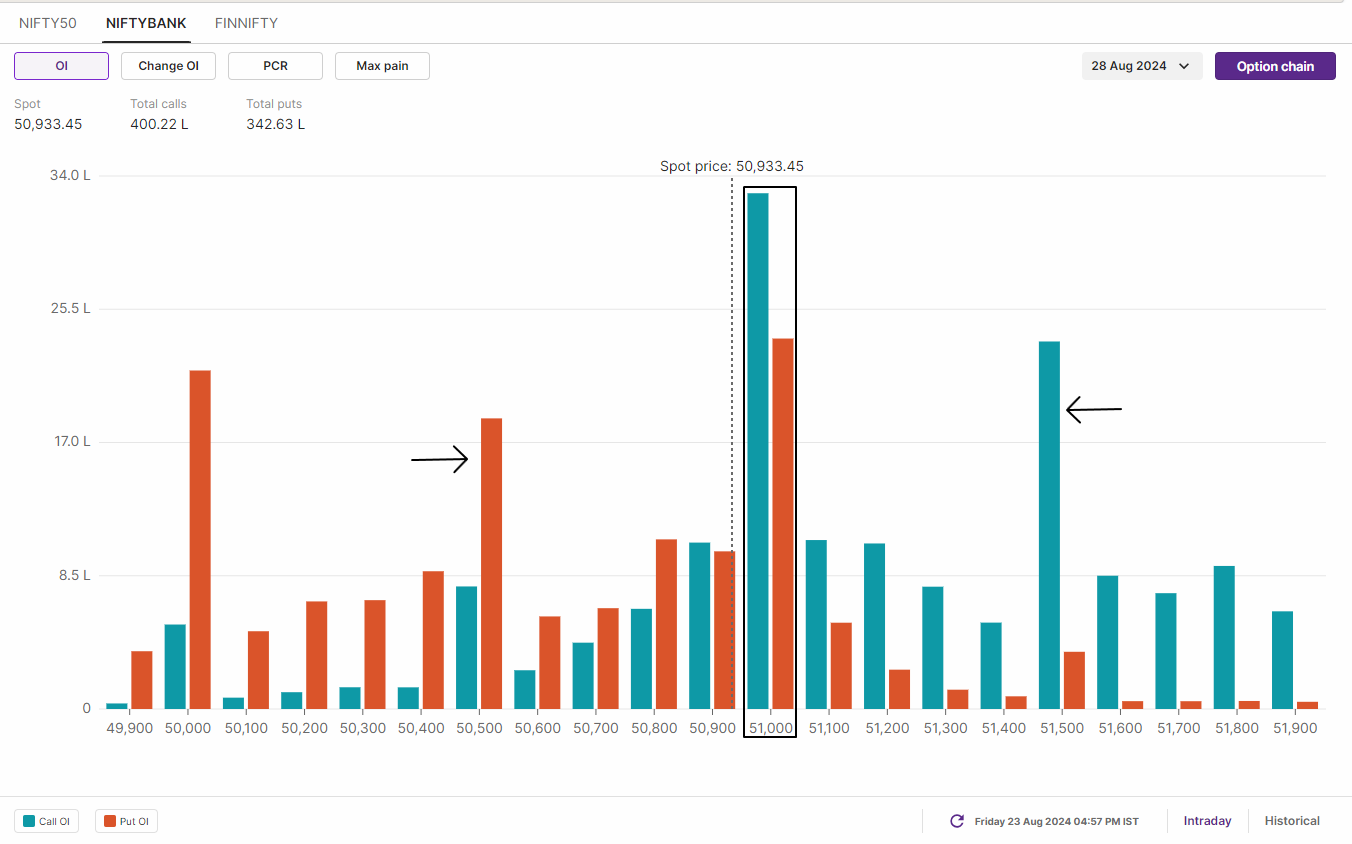
Open interest (OI) positioning on the BANK NIFTY index currently shows range-bound activity around the 51,000 level. The index has the highest call and put OI at the 51,000 level. In addition, the index has also seen significant call additions at the 51,500 strike and put additions at the 50,500 strike. For the monthly expiry, traders expecting a directional move should closely monitor the additions or unwinding of OI at 51,500 call strike and 50,500 put strike.
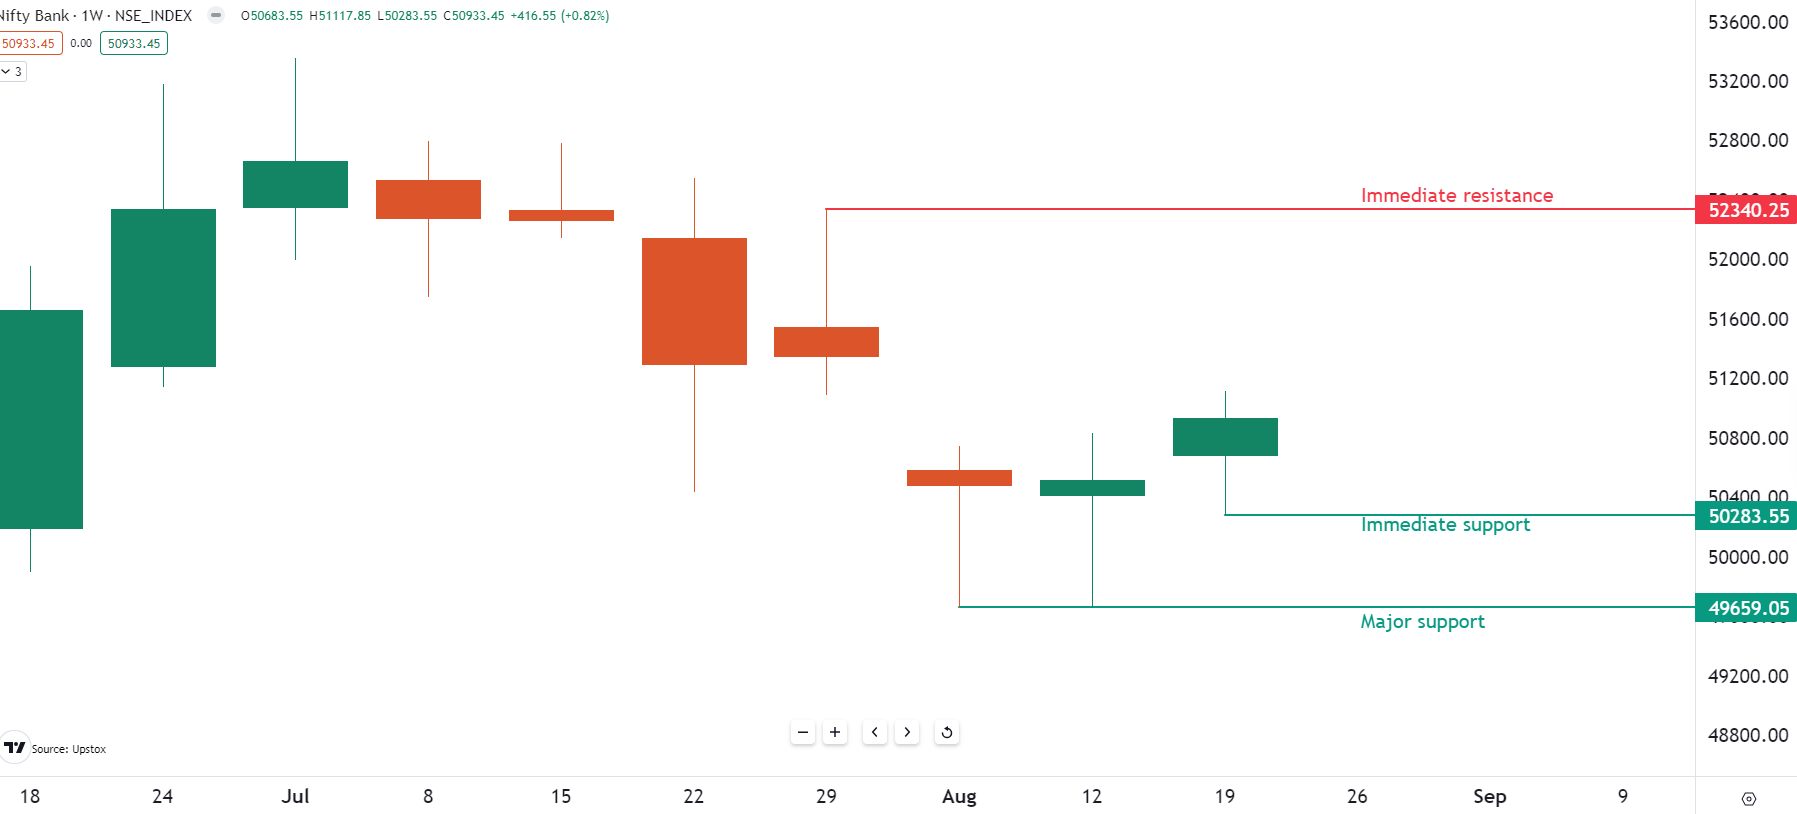
The weekly chart of the BANK NIFTY indicates a rebound, with index closing above the previous week’s high and breaking out of a two-week consolidation. However, it has yet to close above the psychologically crucial 51,000 zone. In the coming week, traders should watch the 51,100 and 50,200 levels closely. A break above or below these levels, whether on on closing or intraday basis, is likely to trigger a directional move in the index.
🗓️Key events in focus: Globally, investors will be watching the revised estimates for second quarter GDP, which will be released on Thursday, along with jobless claims. The main highlight of the week will be the Personal Consumption Expenditures (PCE) index, the Fed's preferred inflation gauge.
On the domestic front, GDP data for April-June (Q1) of FY25 will be released on Friday. The Street is expecting a GDP print in the range of 6-7%, lower than the 7.8% of Q1FY24. However, the Reserve Bank of India in its last meeting lowered its Q1 GDP growth forecast to 7.1% from 7.3%. Auto stocks will also be in focus after August automobiles sales data will be released over the weekend.
🛢️Oil: Crude oil rebounded over 2% on Friday after hitting eight-month low. The sharp rebound comes after the speech of Fed Chair Jerome Powell, anticipating a potential rate cut by the U.S. Fed in its September meeting. The Brent Crude ended at $79 a barrel on Friday, up 2.5%, while the U.S. West Texas Intermediate (WTI) settled at $76, up 2.6%.
Globally, the second quarter results of artificial intelligence major Nvidia, which will be announced on 28 August, Wednesday. The Street will be watching closely for guidance and management commentary. Nvidia shares are up more than 150% year-to-date.
📓✏️Takeaway: In last week's blog, we advised our readers to stay bullish and anticipate that the NIFTY50 index would fill the bearish gap formed on August 5, following the confirmation of the bullish hammer on the weekly chart. The index maintained its bullish momentum and closed the week in the green, aligning with our expectations.
In the week ahead, we expect the NIFTY50 to maintain its positive momentum with immediate support around 24,500, which coincides with its 20-day moving average (DMA). Weakness in the index will only emerge if the index surrenders the 20 DMA on a closing basis. Meanwhile, if the index experiences profit-taking around its all-time high, it could become range-bound between 24,500 and 25,100.
To stay updated on any changes in these levels and all intraday developments, be sure to check out our daily morning trade setup blog, available before the market opens at 8 am.
Disclaimer: Derivatives trading must be done only by traders who fully understand the risks associated with them and strictly apply risk mechanisms like stop-losses. The information is only for consumption by the client, and such material should not be redistributed. We do not recommend any particular stock, securities, or trading strategies. The securities quoted are exemplary and not recommendatory. The stock names mentioned in this article are purely to show how to do analysis. Make your own decision before investing.
About The Author

