Market News
Week ahead: Union Budget 2024, Q1 results, F&O expiry, US GDP among key factors to watch
.png)
7 min read | Updated on July 22, 2024, 08:59 IST
SUMMARY
The NIFTY50 and BANK NIFTY have shown mixed signals on the weekly chart. The NIFTY50 formed a shooting star, a bearish reversal pattern, while BANK NIFTY formed an inside candle, reflecting contraction and further consolidation. However, if the weekly close of NIFTY50 is below last week’s bearish reversal pattern, the index may experience increased volatility.

Union Budget, Q1 results, U.S. GDP and monthly expiry–key market triggers to monitor this week
The markets extended their winning streak for the seventh consecutive week, supported by upbeat quarterly results from IT companies and buying in FMCG stocks. However, the indices witnessed profit booking on Friday, 19 July, ahead of the Union Budget announcement. The NIFTY50 and SENSEX ended the week with minor gains of 0.1% and ended at 24,530 and 80,604.
Meanwhile, the sector rotation was clearly visible as the broader markets remained subdued in comparison with the benchmark peers. The NIFTY Midcap 100 fell 2.2% for the week, while Smallcap 100 index fell 3%.
Sectorally, IT (+2.3%), FMCG (+2.2%), and PSU Banks (+%) witnessed buying momentum, while the Media (-5.3%), Metals (-4.6%), and Consumer Durables (-2.5%) were the big laggards.
Index breadth- NIFTY50
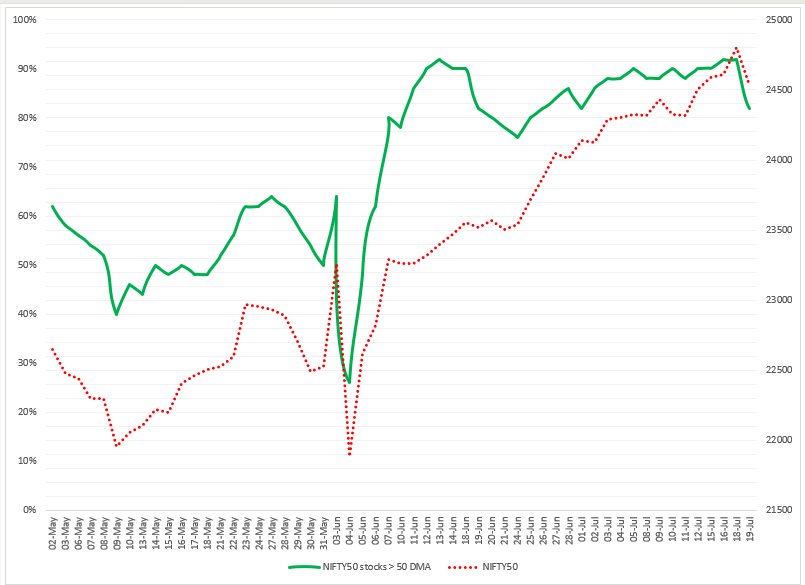
The NIFTY50 index continued its bullish trend from last week, with an average of 89% of NIFTY50 stocks trading above their 50-day moving average (DMA). Our analysis last week showed that the breadth Indicator, which tracks NIFTY50 stocks trading above their 50 DMA, was nearing an all-time high of 92%, warning traders of potential profit-taking at elevated levels.
Except for a partial profit-booking session on the 19 July, the index remained in an uptrend throughout the week. The latest reading of the breadth indicator shows that 82% of the NIFTY50 stocks are trading above their 50 DMA, down 10% from the 18th. Although the overall trend of the index remains bullish, traders should remain cautious of volatility and knee-jerk reactions that could trigger profit-taking ahead of the Union Budget.
FIIs positioning in the index
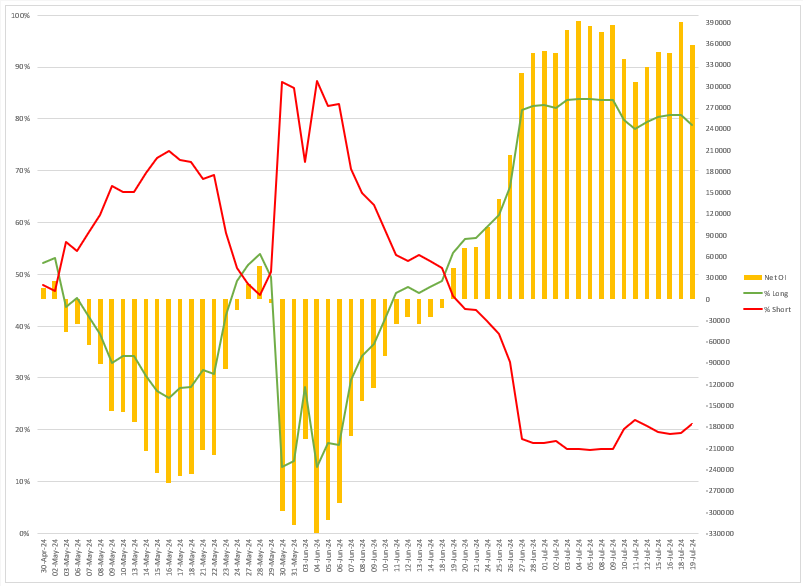
The Foreign Institutional Investors (FIIs) have maintained their net long open interest (OI) in index futures for the fifth consecutive week. They increased their net OI by 9.4% to 3.58 lakh contracts from last week, with a significant uptick seen on the weekly expiry of NIFTY50’s options contracts. Currently, the FIIs long-to-short ratio in index futures stands at 79:21.
In last week’s blog, we observed that FIIs maintained their net long OI in index futures and continued as net buyers in the cash market. We advised traders to monitor the changes in the long-to-short ratio. As a result, the index consolidated its gains and reached a new all-time high as the FIIs increased their net long contracts by 12% a day before the expiry of NIFTY50 contracts.
Meanwhile, FIIs continued to be net buyers in the cash market for the sixth consecutive week, buying shares worth ₹10,945 crore. Domestic institutional investors turned net sellers, and sold shares worth ₹4,226 crore, taking the total net institutional inflow to ₹6,719 crore.
F&O - NIFTY50 outlook
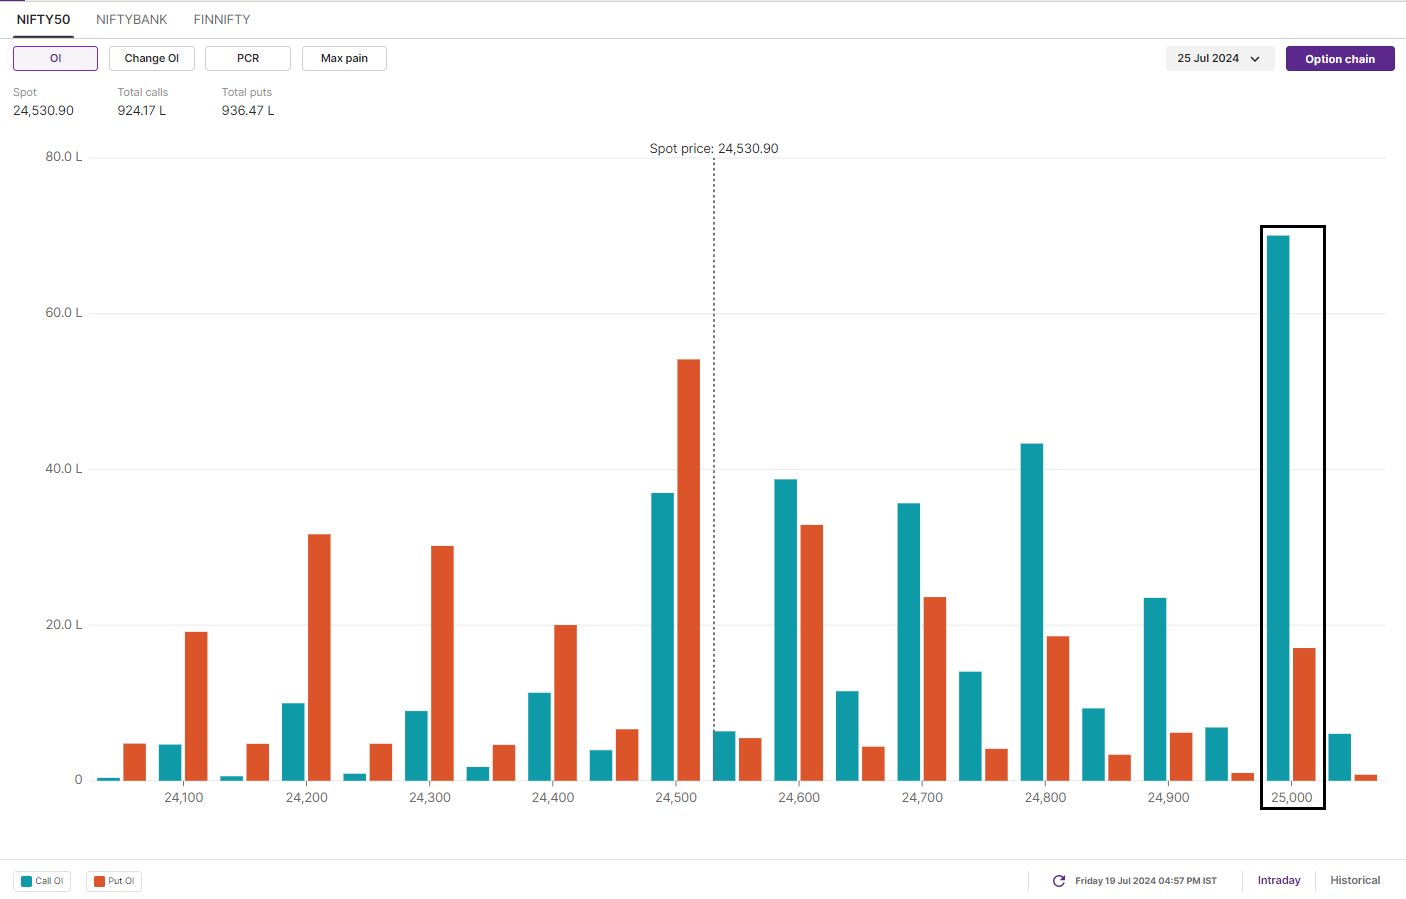
The open interest data for the 25 July expiry shows some notable trends at the key strike prices. A high concentration of call options at the 25,000 level suggests that traders see this as a resistance point. Conversely, the 24,000 level is seen as a strong support zone with a significant number of put options. Interestingly, the 24,500 and 24,600 strikes show significant open interest in both call and put options, suggesting the potential for range-bound movement around this price.
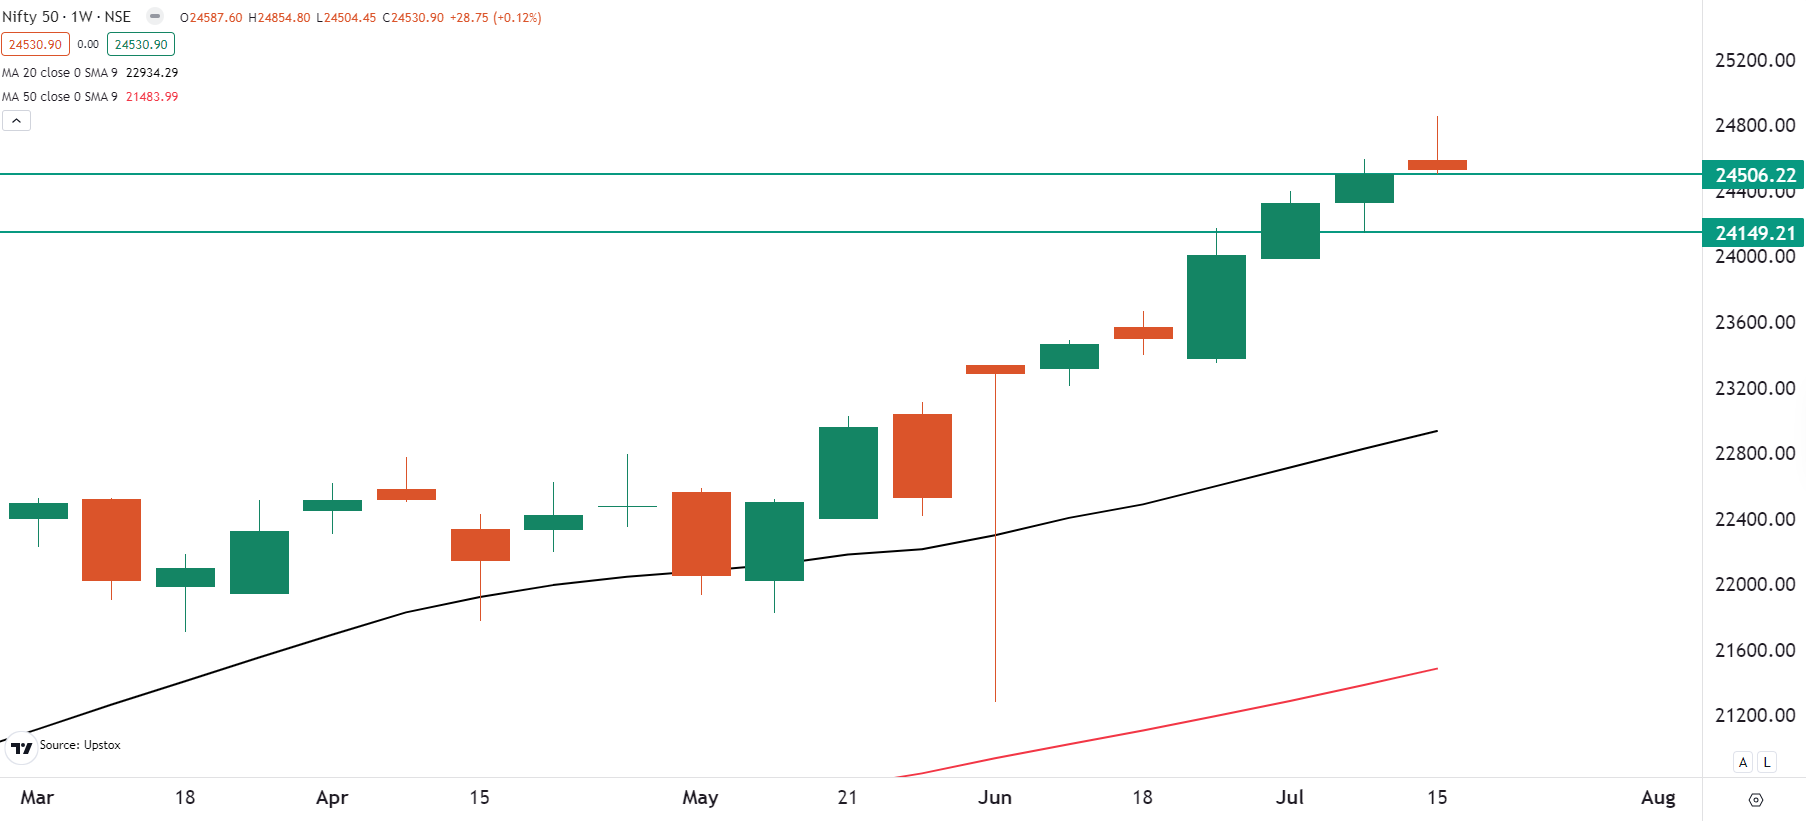
In our blog last week, we said that there is no visible resistance on the charts and that the trend may remain bullish as long as the index holds above the 24,150 to 24,200 zone. The index maintained its bullish momentum throughout the week but formed a bearish candle on Friday, 19 July.
The NIFTY50 has created a shooting star pattern on the weekly chart and a bearish engulfing pattern on the daily chart. Both patterns are typically seen as the bearish reversal signals, but confirmation is needed. If the next candle closes below these reversal patterns, the trend may turn negative. However, if the index closes above these patterns, the bearish signals will be invalidated.
F&O - BANK NIFTY outlook
Ahead of the announcement of Q1FY25 results of HDFC Bank and Kotak Mahindra Bank, traders placed significant call open interest (OI) at 53,000 and 52,500 strikes of BANK NIFTY. This indicates traders expect that the index may face resistance around these levels. On the other hand, the put OI was placed at 52,000 and 51,000 strike, making them as the support.
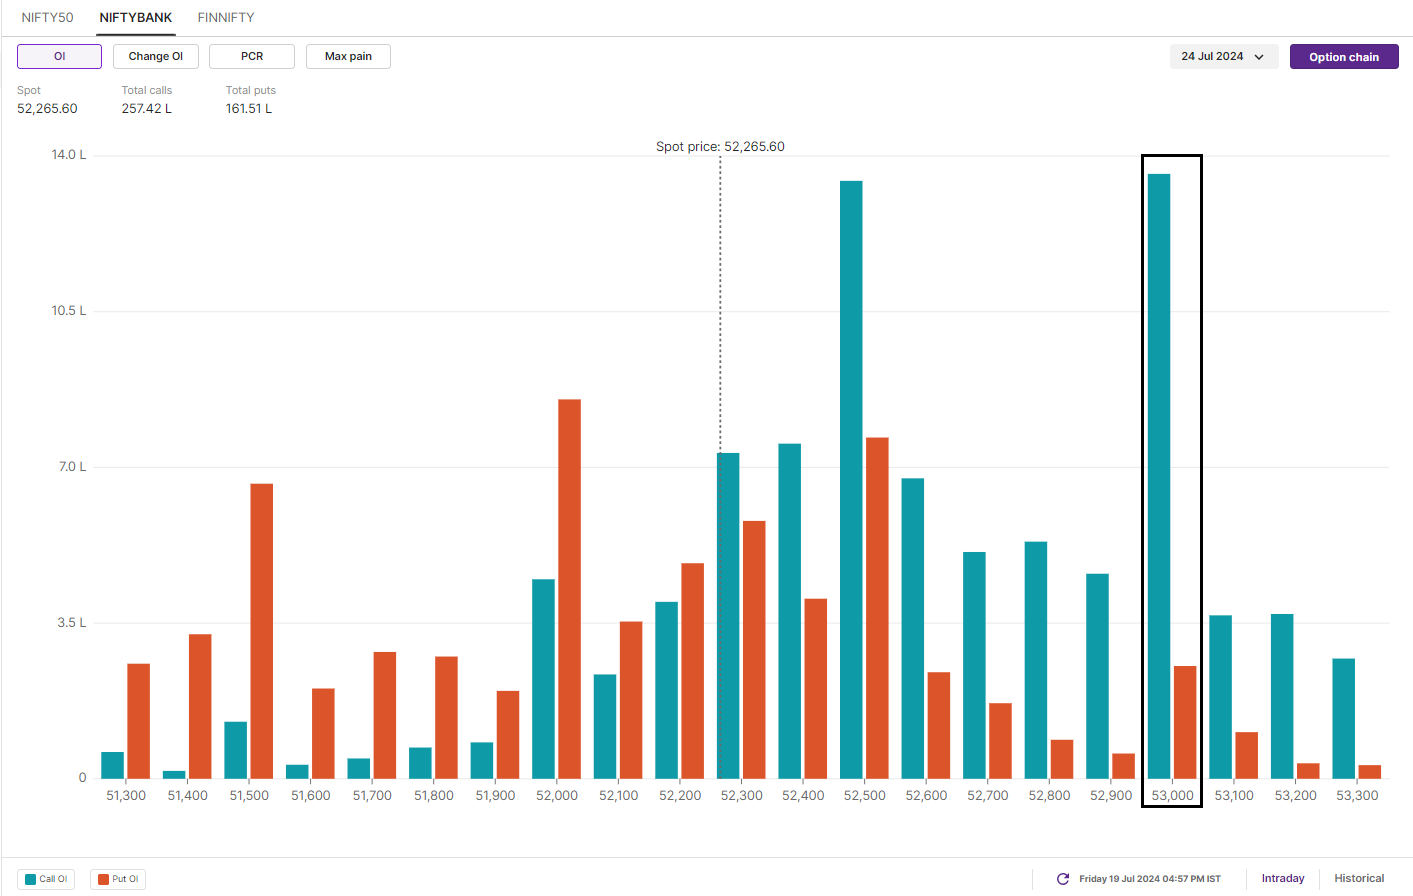
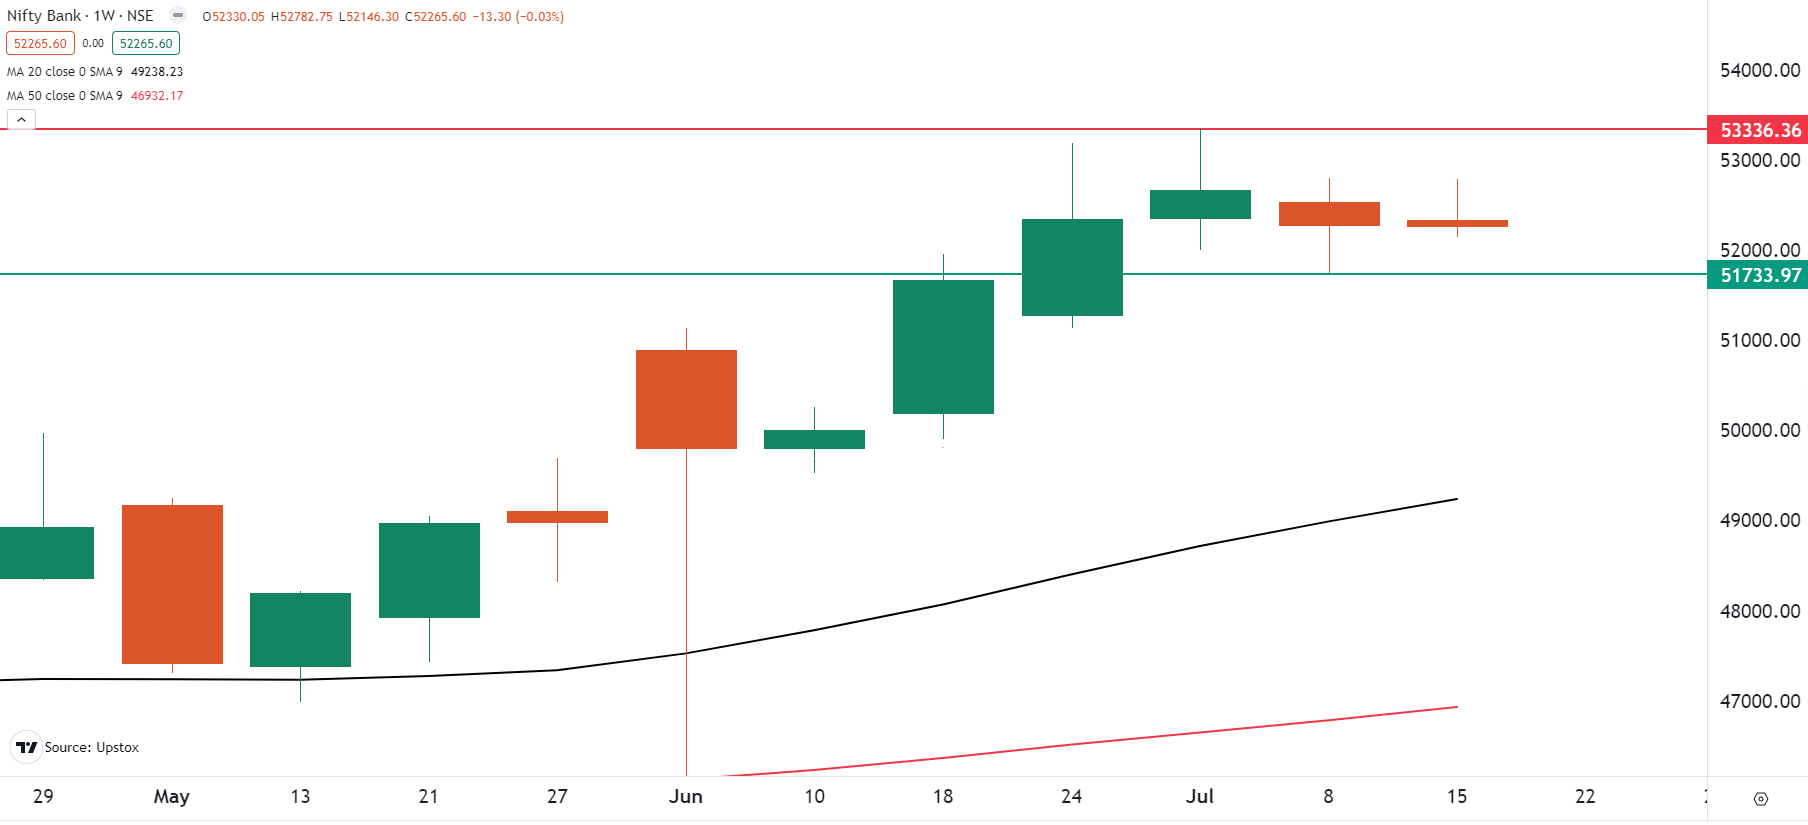
However, with both banks exceeding street estimates, the OI and the technical structure will offer crucial insights on 22 July. The chart below shows that the index has been consolidating within the range we highlighted over the last three weeks, forming an inside candle on the weekly chart.
With the upcoming Union Budget, traders should closely monitor the 51,700 and 53,300 levels. A break above or below these levels on a closing basis will provide directional insights. Until then, the index may remain range-bound and witness volatility.
In the U.S., second-quarter earnings will also be closely watched. Key companies scheduled to report their earnings include Alphabet (Google), Coca-Cola, General Motors, Lockheed Martin, IBM and Tesla.
Globally, investors will also monitor the second-quarter estimates of U.S. GDP, which are expected to be around 1.9% Vs 1.4% in the first three months of 2024.
Additionally, Friday's Personal Consumption Expenditures (PCE) report for June 2024 will be the last inflation report before the Federal Reserve's next meeting. With expectations for a rate cut on the rise, market watchers will be closely analysing this key data. The PCE index is expected to show an increase of 2.4% year-on-year, down from 2.6% in May.
The NIFTY50 index has immediate support around 24,150 and 24,200 zones. As long as the index holds this zone on a closing basis, the trend may remain bullish. However, if the weekly close is below the last week’s bearish reversal pattern, the index may experience increased volatility.
To stay updated on any changes in these levels and all intraday developments, be sure to check out our daily morning trade setup blog, available before the market opens at 8am.
Derivatives trading must be done only by traders who fully understand the risks associated with them and strictly apply risk mechanisms like stop-losses. The information is only for consumption by the client and such material should not be redistributed. We do not recommend any particular stock, securities and strategies for trading. The securities quoted are exemplary and are not recommendatory. The stock names mentioned in this article are purely for showing how to do analysis. Take your own decision before investing.
About The Author
Next Story

