Market News
Week ahead: RBI policy, Q1 earnings, Oil price fluctuations and F&O cues among key factors to watch
.png)
7 min read | Updated on August 05, 2024, 07:57 IST
SUMMARY
Traders will be closely monitoring the outcome of this week's RBI policy meeting amid weak global cues. Rising tensions in the Middle East and a sharp sell-off in US technology stocks are expected to increase volatility. Meanwhile, Q1 earnings will continue to drive stock-specific activity.
Stock list

RBI policy, Q1 earnings, Oil prices, OLA listing among key factors to watch this week
Markets snapped their eight-week winning streak and ended the first week of the August series in the red. The NIFTY50 index hit a fresh record high, crossing the 25,000 mark during the week, but failed to sustain it on a weekly closing basis. The benchmark index ended the week at 24,717, down 0.7%.
The sell-off on Friday, 2 August, was triggered by weak global cues. Weaker-than-expected jobs data in the US and a drop in the Manufacturing PMI reading ignited fears of recessions.
The sector-specific rotation was visible during the week. The Energy (+2.5%) and Pharmaceuticals (+1.3%) indices were the top gainers. In contrast, Realty (-3.7%) and Automobiles (-2.0%) experienced profit-booking and churning.
Meanwhile, the broader markets ended the week on a mixed and flat note. The Midcap 100 index edged up by 0.2%, forming a negative candle on the weekly chart, while the Smallcap 100 index slipped 0.2% and failed to confirm the bullish hammer formed last week.
Index breadth- NIFTY50
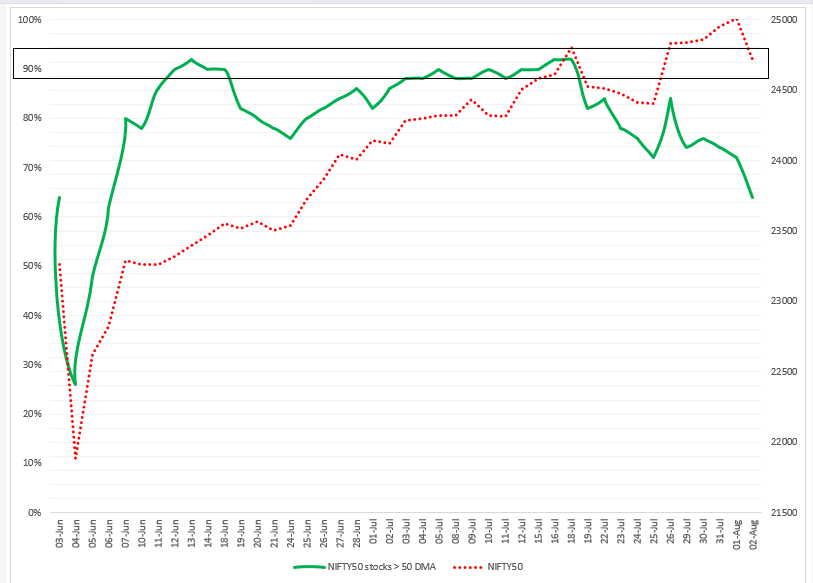
The NIFTY50 index maintained its bullish momentum until 1 August, but signs of cooling began to appear starting Monday, 29 July. This cooling trend was evident as the number of NIFTY50 stocks trading above their 50-day moving average (DMA) decreased from 84% to 64% by the end of the week. This indicated a clear divergence between the broader market breadth.
In our blog last week, we advised our readers to stay cautious about potential profit-booking at higher levels. The green line crossover, which shows the percentage of NIFTY50 stocks trading above 50 DMA on 16 July, suggested that the broader trend may be losing steam after retreating from the overbought zone of 92%. Currently, the breadth indicator has slipped to 64%, indicating potential weakness.
It is crucial to understand that a reading between 50% and 70% usually points to range-bound activity, while a drop below 50% could indicate further market weakness. Therefore, investors can closely monitor these levels for signs of a change in momentum.
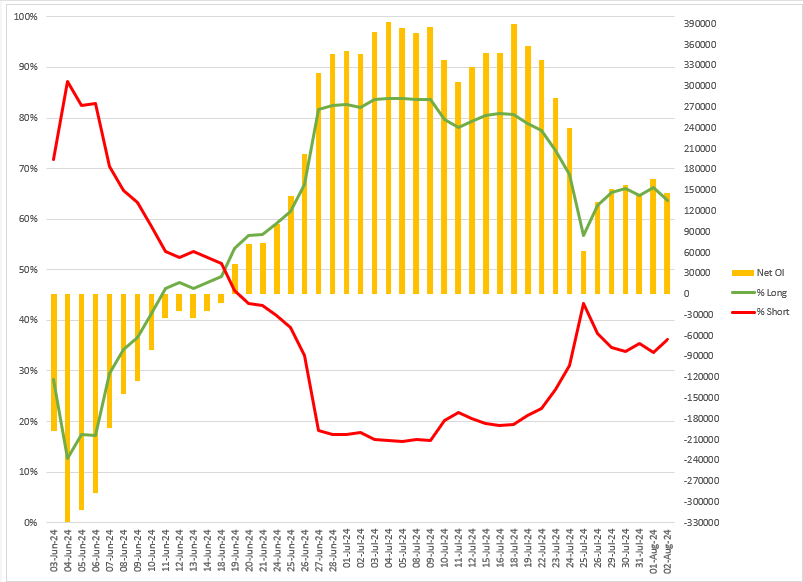
FIIs positioning in the index
Foreign Institutional Investors (FIIs) maintained their bullish bets in the index futures throughout the week. The FIIs current long-to-short ratio of open interest in the index futures stands at 64:36, indicating positive breadth for the index with range-bound activity.
F&O - NIFTY50 outlook
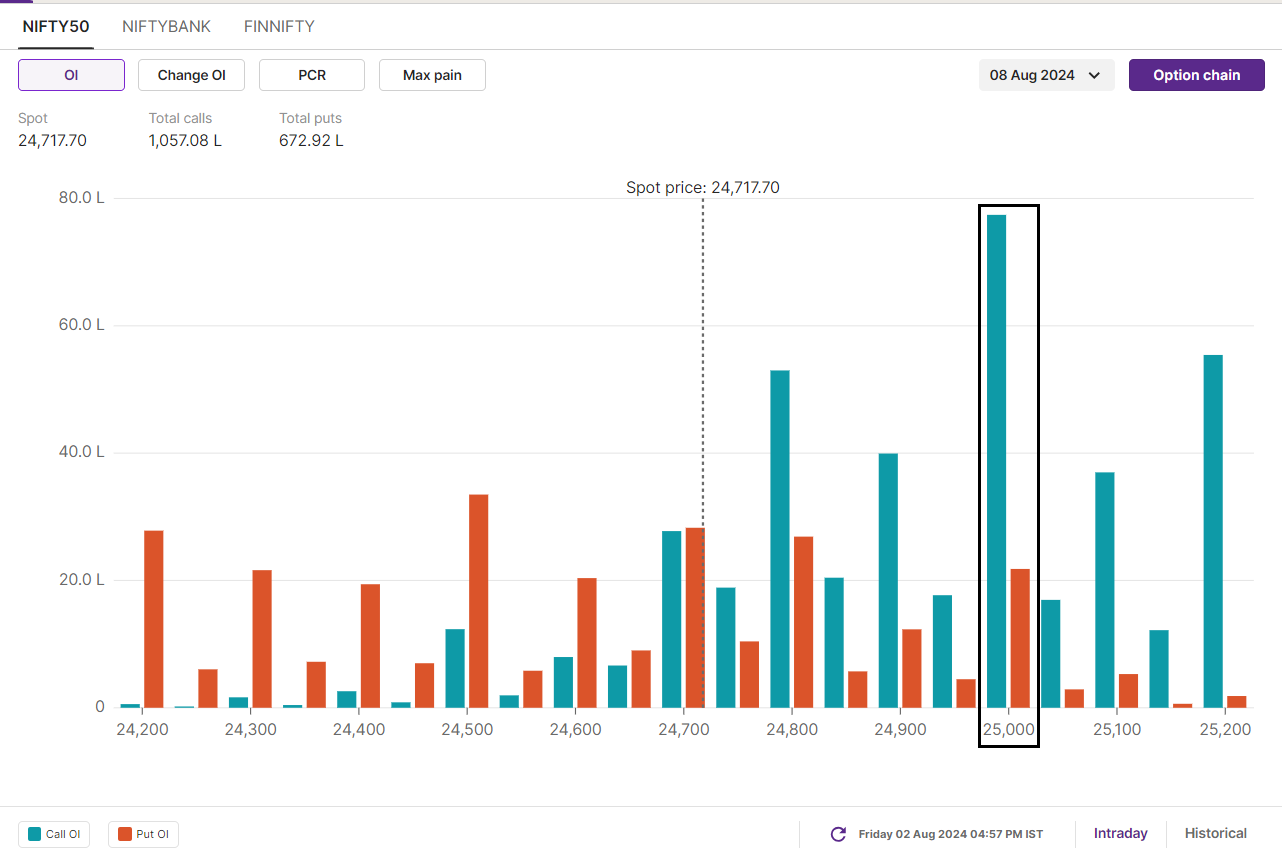
For NIFTY50’s 8 August expiry, there was a notable open interest build-up, with significant call activity at the 25,000 and 24,800 strikes. This suggests that these levels may act as resistance to the index in the coming days. On the other hand, the put base was strongest at the 24,000 strike, indicating key support at this level for the upcoming week’s expiry.
Meanwhile, the overall open interest positioning at the end of the week favoured the call writers. This highlighted a more bearish sentiment among traders.
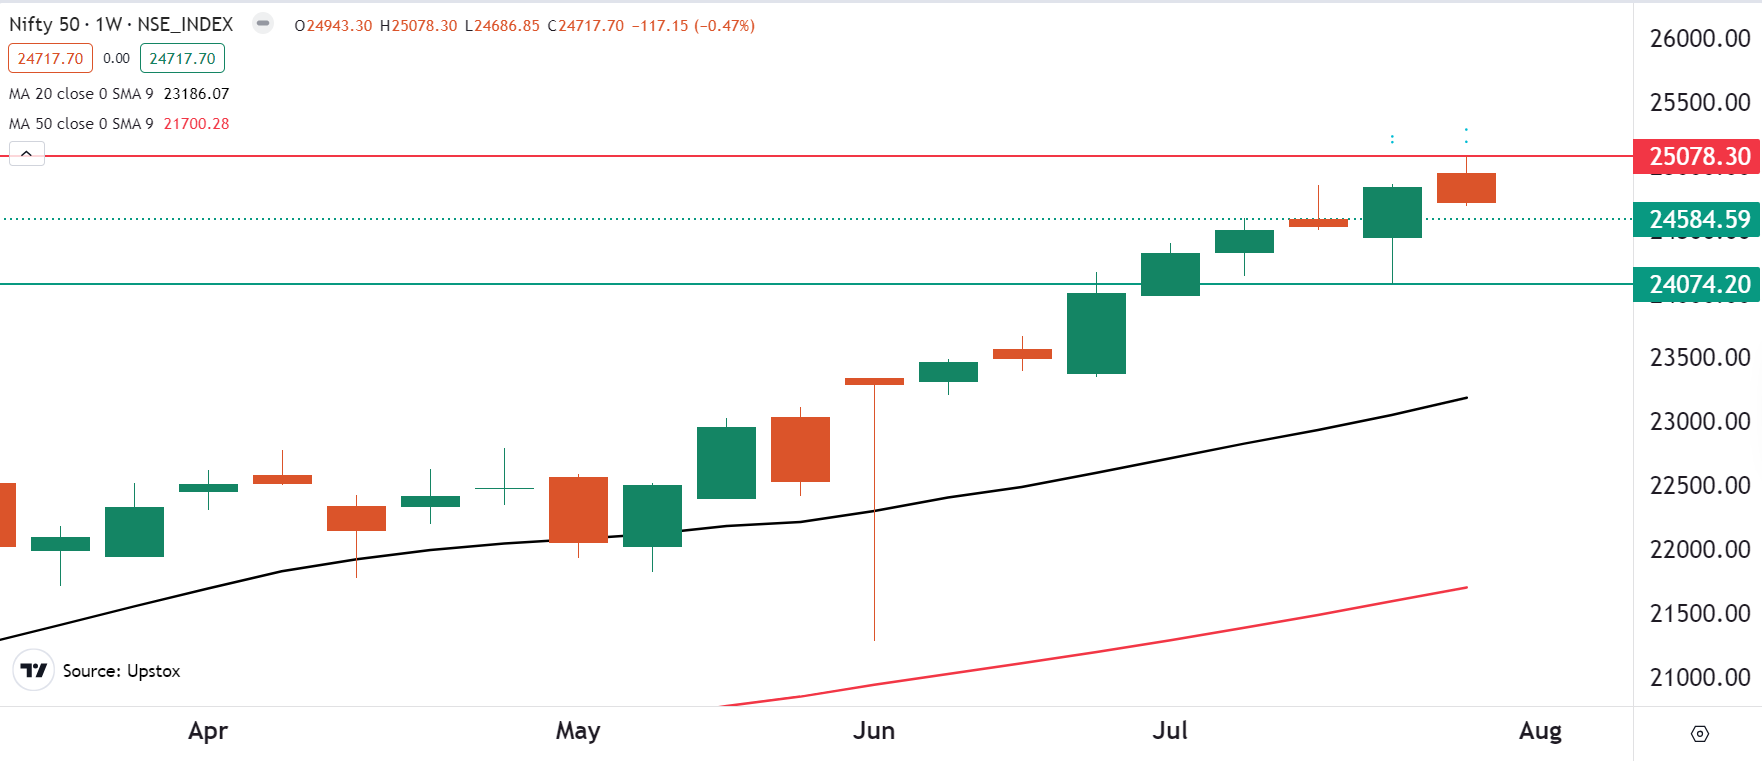
Last week, we clearly maintained the view that the broader outlook of the NIFTY50 index remains buy on dips until it breaches the 24,500 level on a closing basis. In line with our view, the index reached a fresh all-time high and breached the 25,000 mark.
For the upcoming sessions, investors can remain cautious as the index may extend the profit-booking seen on 2 August. The crucial level and the zone to monitor on the daily chart will be 24,400 and 24,500. A close below this zone will indicate further weakness, with the next crucial support between 24,000 and 24,800. On the flip side, the 25,000 to 25,200 zone will act as immediate resistance.
F&O - BANK NIFTY outlook
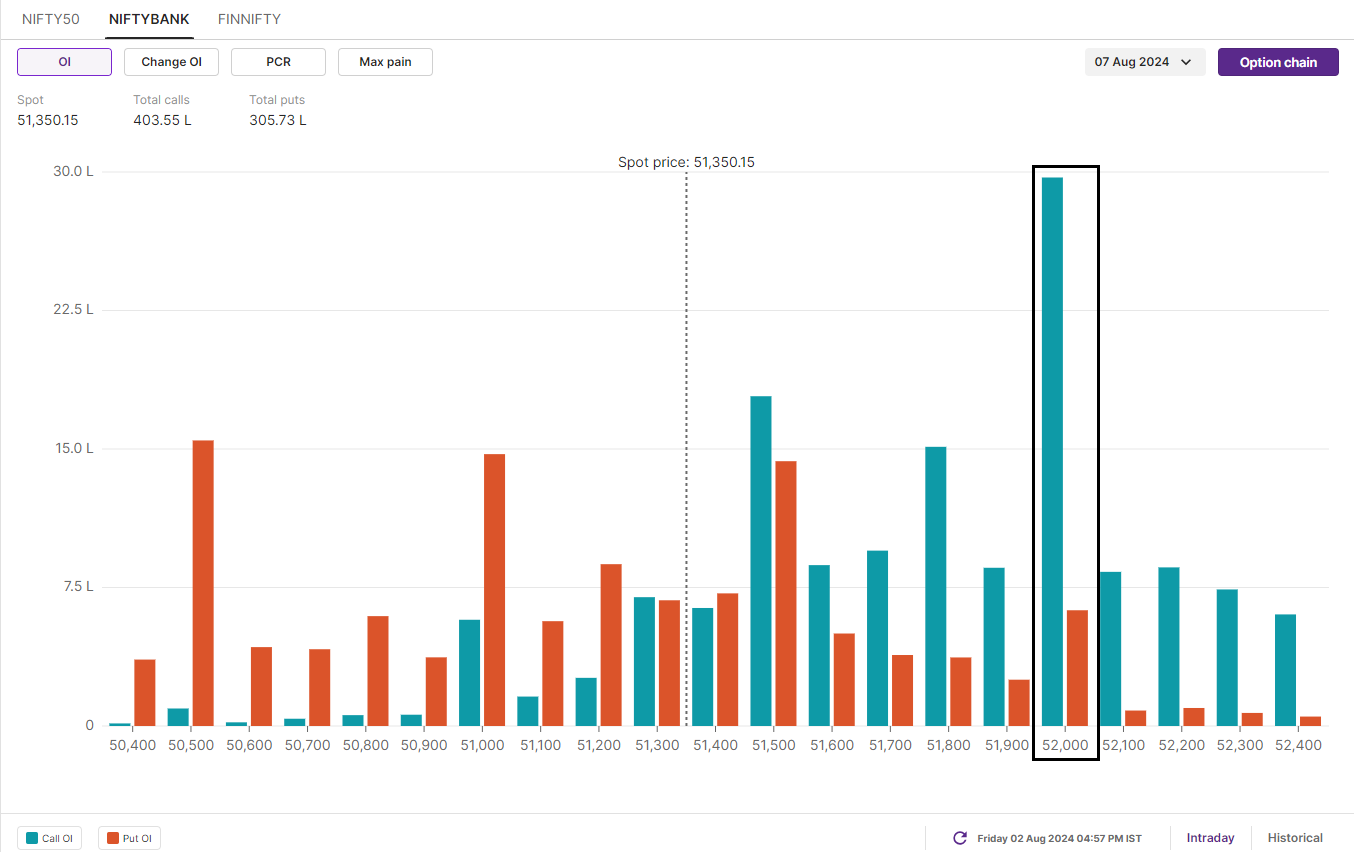
The open interest analysis for BANK NIFTY’s 7 August expiry shows the highest call base at 52,000 and 53,000 strikes, indicating resistance for the index around these levels. Conversely, the put base was established at 51,000 and 50,500 strikes, pointing to support around these levels.
The BANK NIFTY index consolidated between its 20 and 50-day moving averages (DMAs) throughout the week, ending the week flat. The index narrowed its range and formed an inside candle on the weekly chart.
For the coming week, directional traders should watch for the breach of the 52,500 and 50,400 zones. A decisive move above or below this area will provide directional clues. However, if the index fails to break this range, it may consolidate around the 51,500 level.
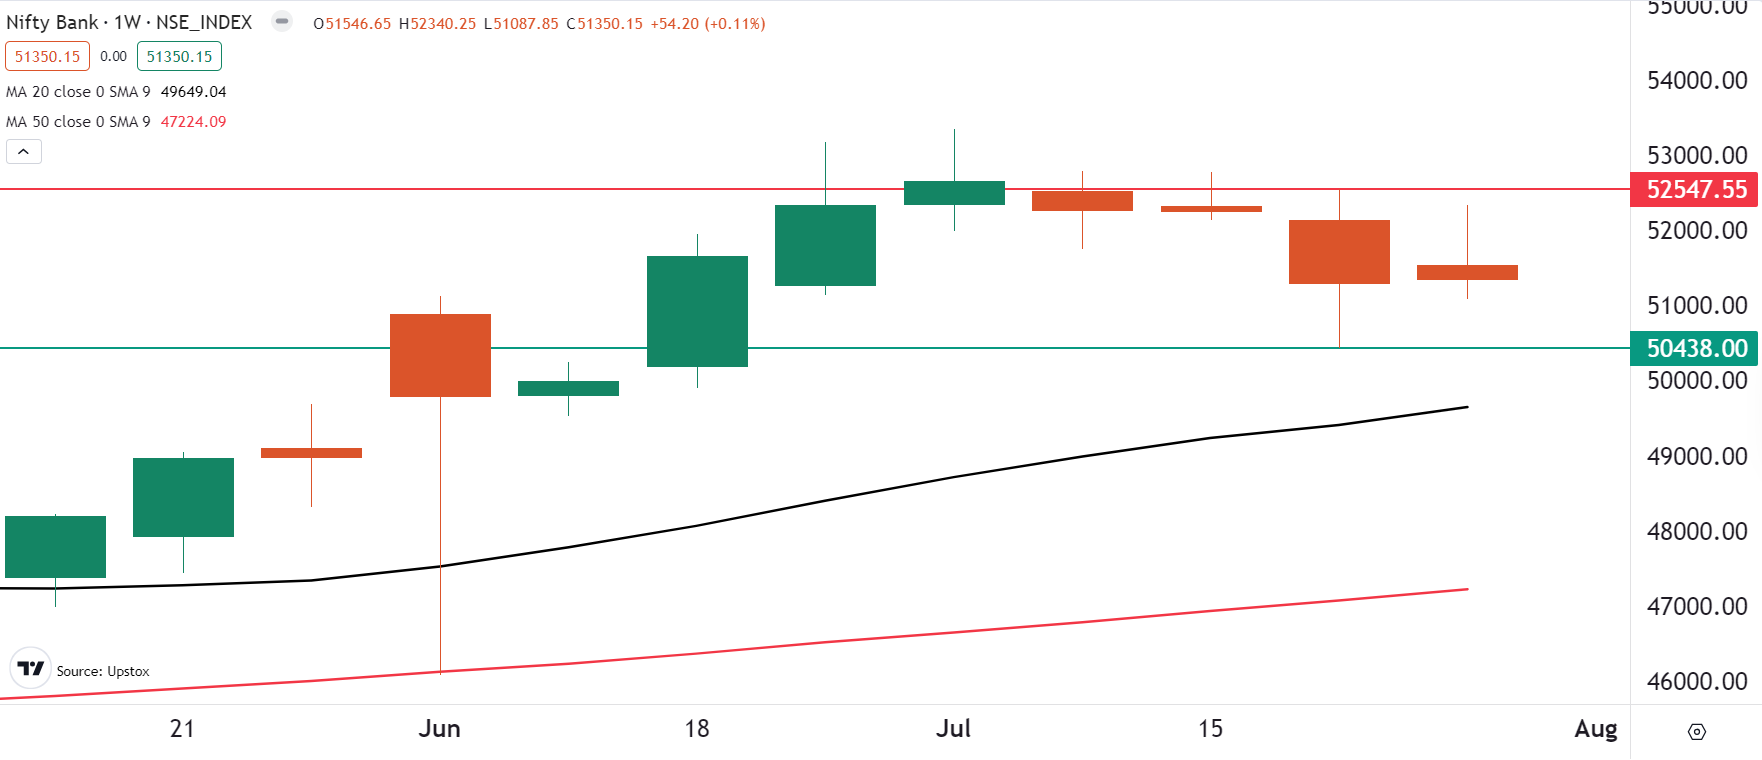
Moreover, the index formed a negative candle on the weekly and daily charts and ended Friday’s session below the previous two sessions, indicating weakness. The next major support for the index is at its 20-day moving average (around 25,600). Experts believe that until the index closes below the 20-DMA, the trend may remain range-bound. However, a close below this level will indicate further weakness.
To stay updated on any changes in these levels and all intraday developments, be sure to check out our daily morning trade setup blog, available before the market opens at 8 am.
Derivatives trading must be done only by traders who fully understand the risks associated with them and strictly apply risk mechanisms like stop-losses. The information is only for consumption by the client, and such material should not be redistributed. We do not recommend any particular stock, securities, or trading strategies. The securities quoted are exemplary and not recommendatory. The stock names mentioned in this article are purely to show how to do analysis. Make your own decision before investing.
Next Story


