Market News
Week ahead: Q3 earnings, US jobs data, FOMC minutes, and ITC Hotels demerger among key market triggers to watch
.png)
7 min read | Updated on January 05, 2025, 23:02 IST
SUMMARY
Third-quarter earnings, the FOMC minutes from the U.S. Federal Reserve’s December meeting, and the Non-Farm Payrolls data will influence the market trend in the coming week. Traders are advised to watch the price range established on January 2 closely. A breakout above or below this range could offer key insights into the market's next direction.
Stock list

Q3 earnings season begins next week, with Tata Consultancy Services (TCS) set to announce its results on January 9.
The benchmark NIFTY50 ended the year on a strong note, marking its ninth consecutive year of positive returns. Building on last week's gains, the index maintained its upward momentum, rebounding from the support of its 200-day EMA and ending its second consecutive week in positive territory. The sharp gains were led by strong auto sales numbers and robust GST collections.
Except for Real-Estate (-2.4%), all major sectoral indices ended the week in positive territory. Consumer Durables (+4.0%), Automobiles (+3.9%) and Oil & Gas (+3.4%) led the gains. Meanwhile, the broader markets continued their upward trajectory for the second consecutive week, with the NIFTY Midcap 100 and Smallcap 100 indices both gaining over 1%.
Index breadth
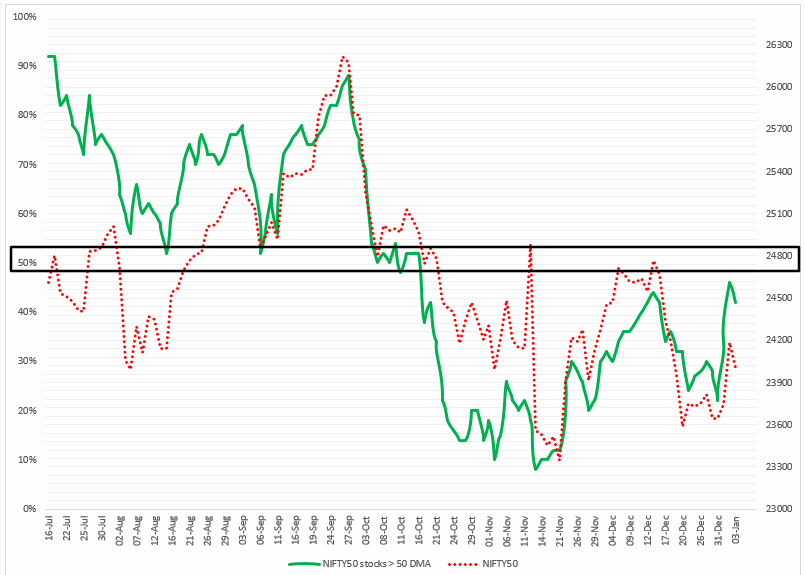
Foreign Institutional Investors (FIIs) turned net buyers during the weekly expiry of NIFTY50 options contracts, triggering a short-covering rally. This momentum was reflected in the breadth indicator, which measures the percentage of NIFTY50 stocks trading above their 50-day moving average (DMA). The indicator surged by over 10%, rising to 46%. By Friday, 42% of the index constituents were trading above their 50 DMA.
In last week’s blog, we emphasised to our readers that the broader trend might remain weak unless the breadth indicator reclaims the 50% threshold, a level it has failed to surpass for the past two months. Looking ahead, if the indicator crosses and sustains above 50% in the upcoming week, the index could see further upside momentum.
FIIs positioning in the index
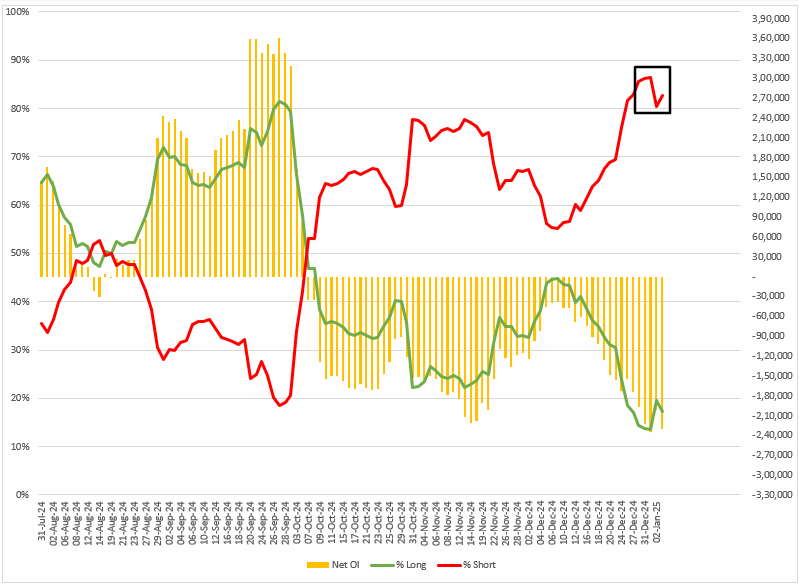
The FIIs began the January series with a long-to-short ratio 14:86 in index futures, reflecting their strongest tilt toward short positions since June 2024. In our previous week’s blog, we pointed out to our readers that with a significant short build-up in the index futures, traders should monitor the change in the open interest (OI) and the reading of the long-to-short ratio for better directional clues.
Last week, FIIs trimmed their net short open interest (OI) and adjusted the long-to-short ratio to 20:80 during the weekly expiry of NIFTY50 options contracts, fueling a short-covering rally on the index. For the upcoming sessions, the long-to-short ratio stands at 17:83, with a net open interest of -2.29 lac contracts on index futures, indicating weakness.
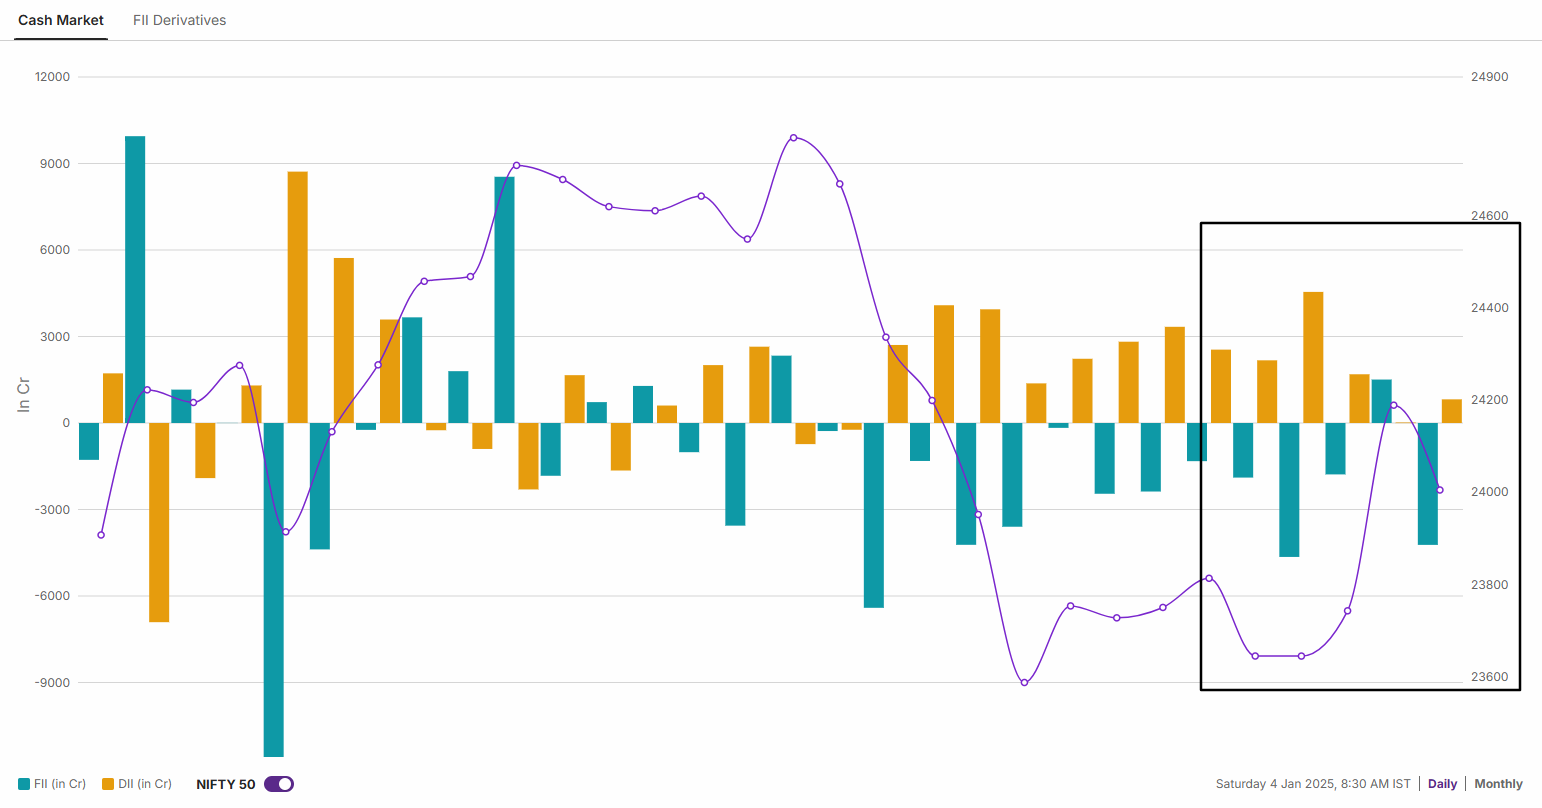
In the cash market, FIIs were net sellers throughout the week, except on the day of the weekly expiry, offloading shares worth ₹11,041 crore. In contrast, Domestic Institutional Investors continued their buying streak, acquiring shares valued at ₹9,253 crore.
NIFTY50 outlook
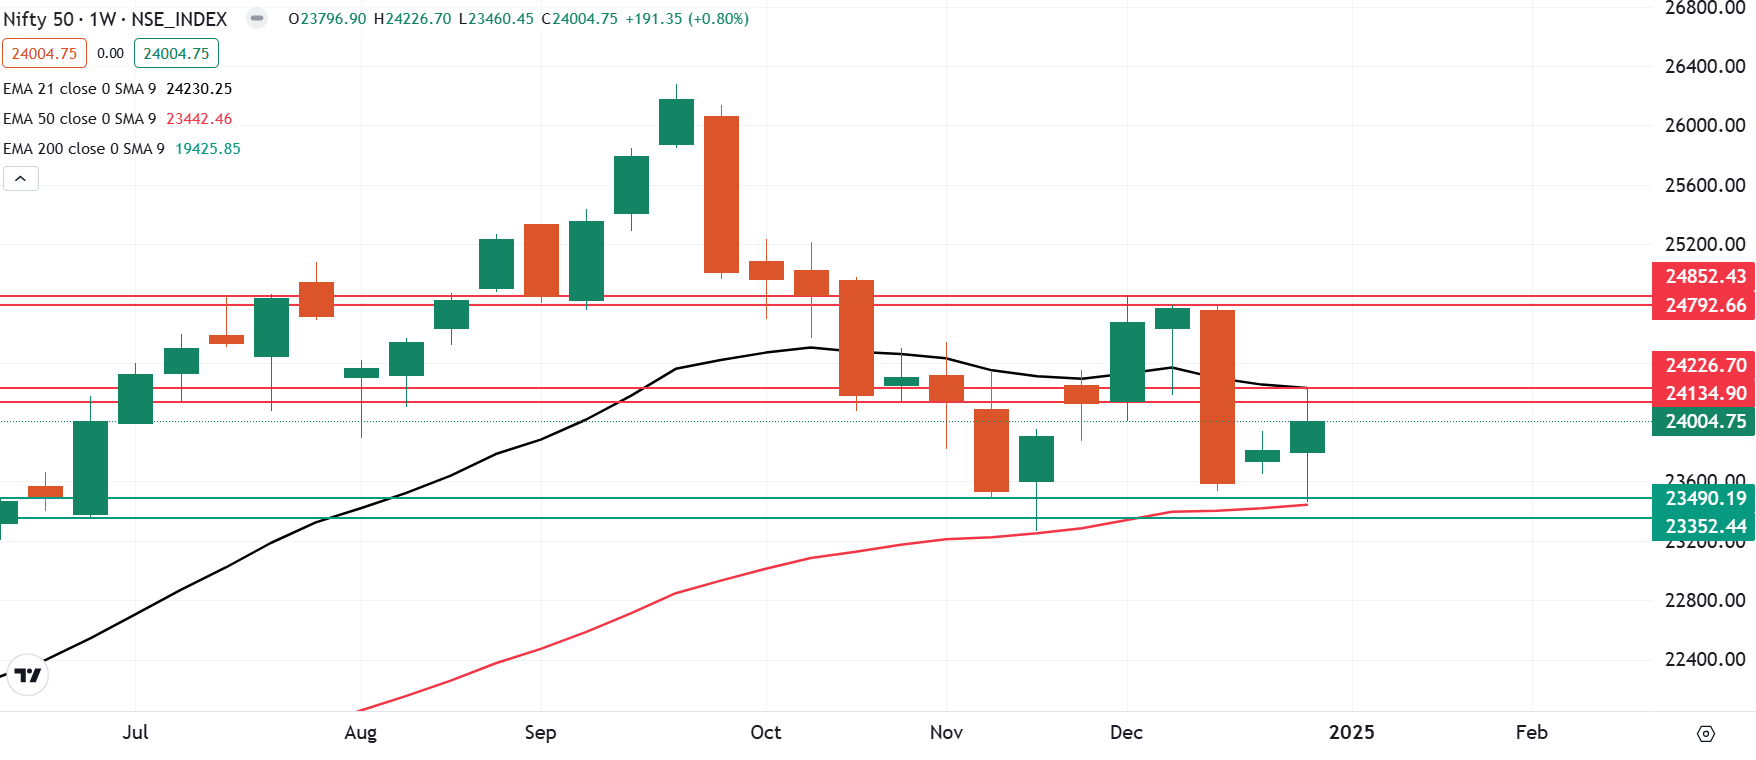
The NIFTY50 index traded within a broad range of over 3% last week, oscillating between its 21 and 50 weekly exponential moving averages (EMAs). After an initial dip, the index rebounded from the support of the 50-week EMA and reclaimed the 24,000 level on a closing basis.
Despite the sharp swings in both directions, the index remains confined between its 21 and 50 weekly EMAs. Unless it decisively breaks this range on a closing basis on the daily chart, the trend is likely to remain range-bound with continued volatility in both directions.
SENSEX outlook
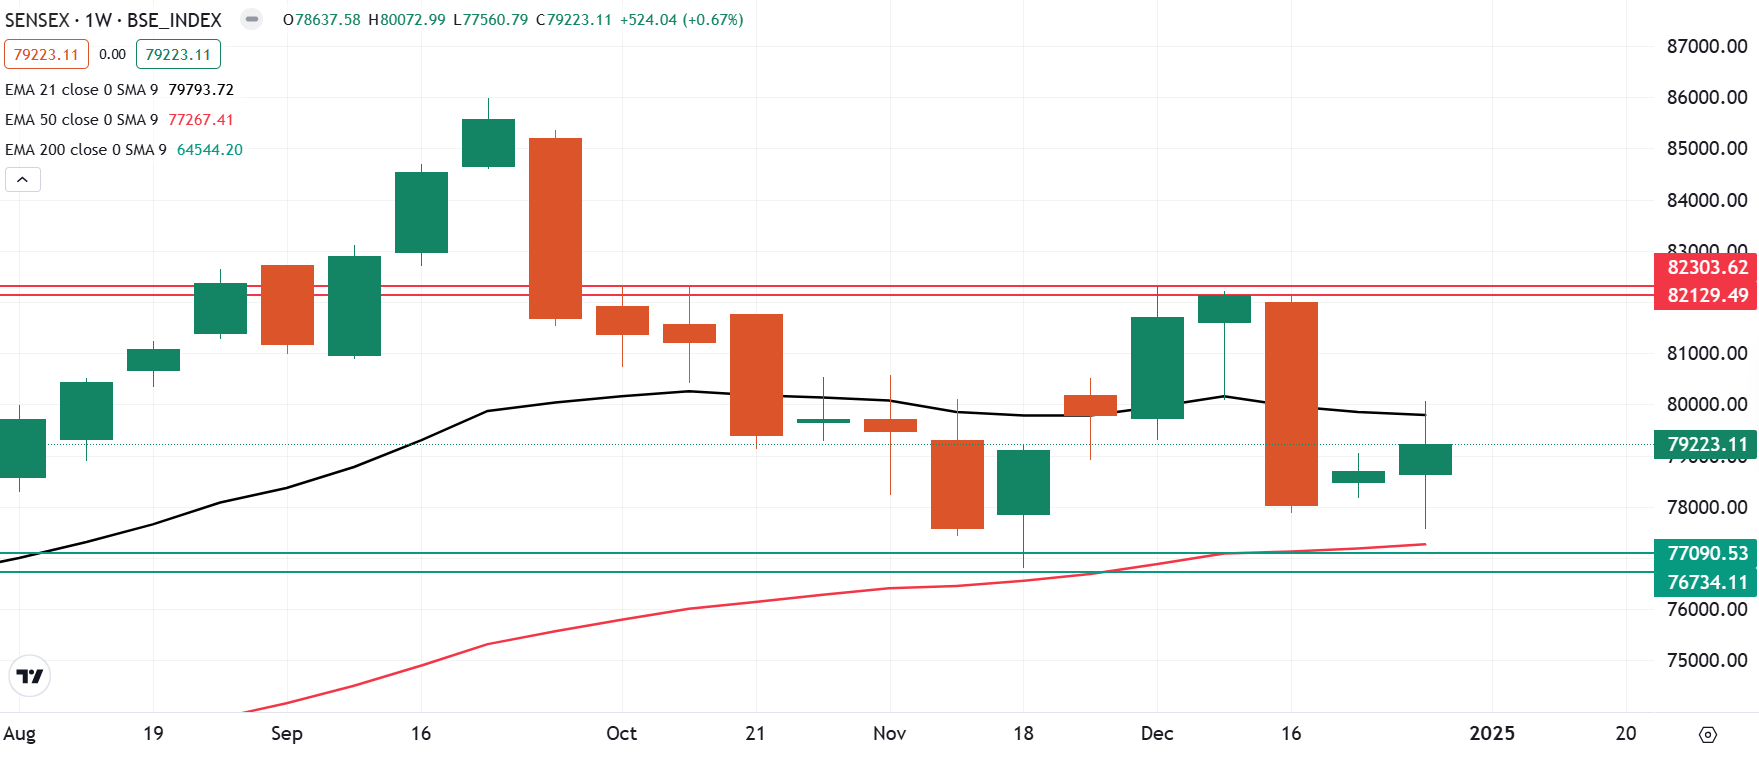
The SENSEX also performed on similar lines and extended the winning momentum for the second consecutive week. The index formed a spinning top pattern on the weekly chart, reflecting indecisions among the buyers and sellers around current levels.
A spinning top has a small body with long upper and lower shadows, suggesting that both buyers and sellers tried to push the price but failed to sustain it on a closing basis. For the coming week, traders can monitor the high and the low of the indecision pattern. A close above or below these levels on the daily chart will provide further directional clues.
The share price of ITC Hotels will be determined during a special pre-open session on January 6, based on ITC's closing price on January 3 and its adjusted opening price on the record date.
Additionally, market sentiment was boosted by China’s announcement of looser monetary policies for 2025 and fresh stimulus measures unveiled this week. These developments propelled crude prices to their highest levels in two months. The Brent Crude Futures jumped 4.5% to $76 a barrel, while West Texas Intermediate of the U.S. rose 5.3% to $74 a barrel.
For the week ahead, traders should watch the broad range of 23,750 to 24,250, a span of approximately 500 points. A decisive close above or below this range could signal a directional move. However, as long as the index remains within this range, the trend will likely stay sideways with intermittent volatility.
For intraday range updates and revisions to these levels, visit our daily morning trade setup blog, published at 8 AM before the market opens.
About The Author
Next Story

