Market News
Week ahead: FOMC minutes, Jackson Hole Symposium, FII activity and F&O trends to watch this week
.png)
6 min read | Updated on August 19, 2024, 07:24 IST
SUMMARY
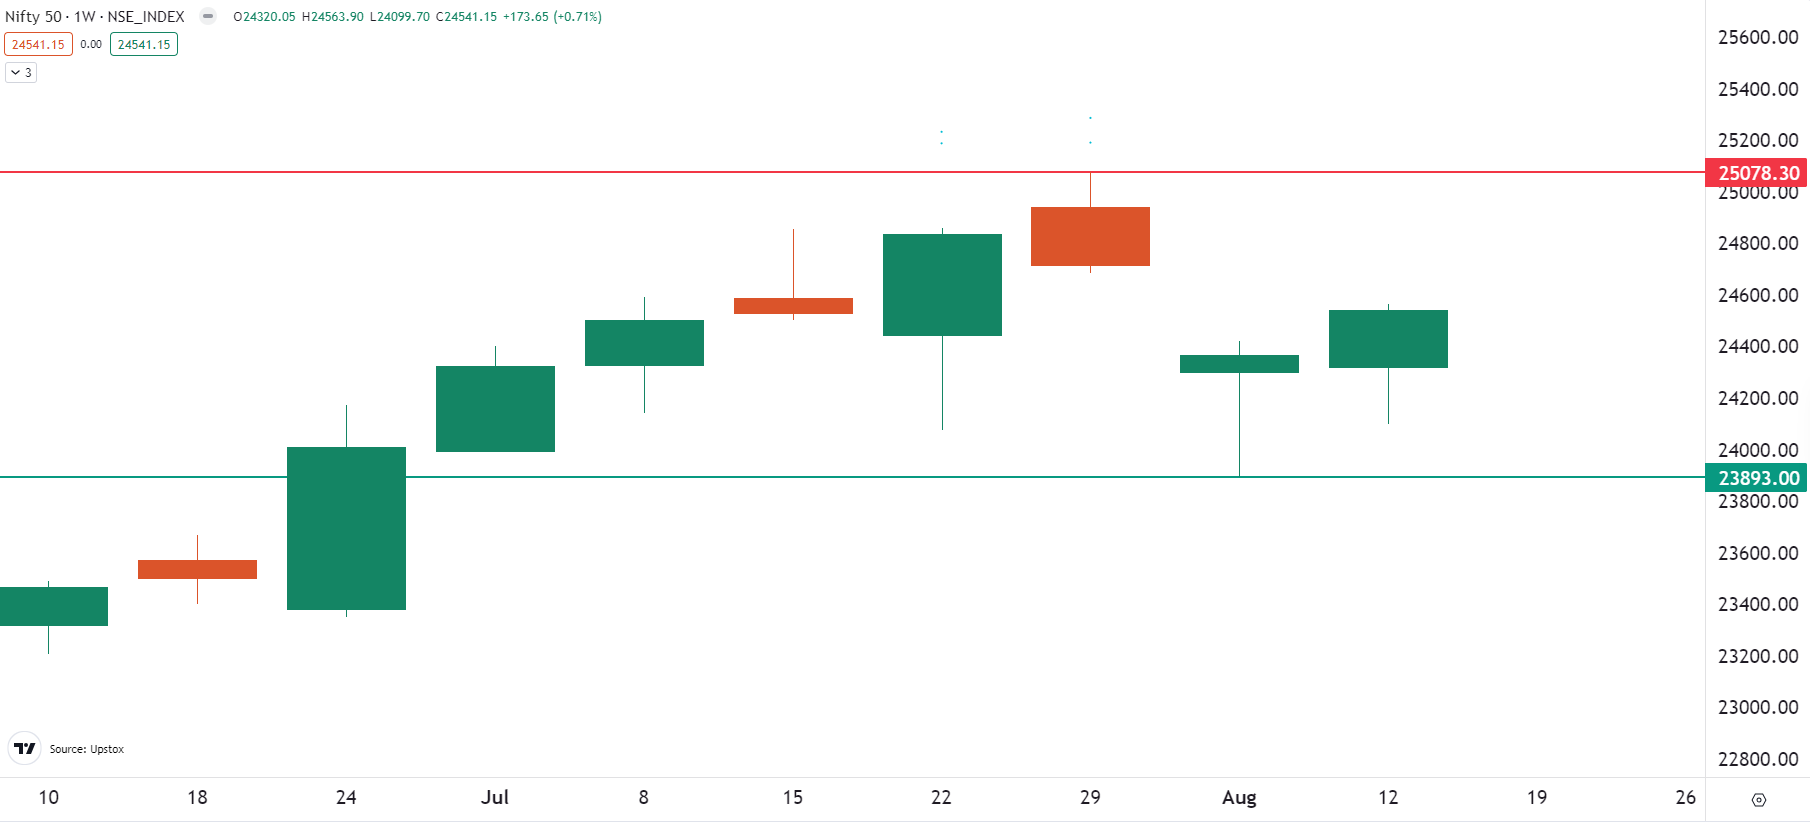
The NIFTY50 closed above the previous week's high, confirming the hammer candlestick pattern. This suggests that the index may attempt to close the bearish gap formed on 5 August, with potential movement up to 24,700.
Stock list

FOMC minutes, Jackson Hole Symposium, PMI data are among key things to watch this week
Market sentiment rebounded during the week ending 16 August, as the benchmark indices broke a two-week losing streak thanks to a strong recovery on Friday. Positive global cues, including reduced concerns about a US recession, expectation of a potential Fed rate cut in September, and the stabilising of the Japanese Yen, contributed to the uplifted market mood.
The broader markets also snapped a two-week losing streak, with NIFTY Midcap 100 index (+0.8%) closing above the previous week’s high, while the Smallcap 100 index (+0.1%) also ended the week flat.
Sectorally, IT (+4.7%) and Consumer Durables (+3.5%) advanced the most during the week, while PSU Banks (-2.1%) and Energy (-1.0%) witnessed selling pressure.
Index breadth- NIFTY50
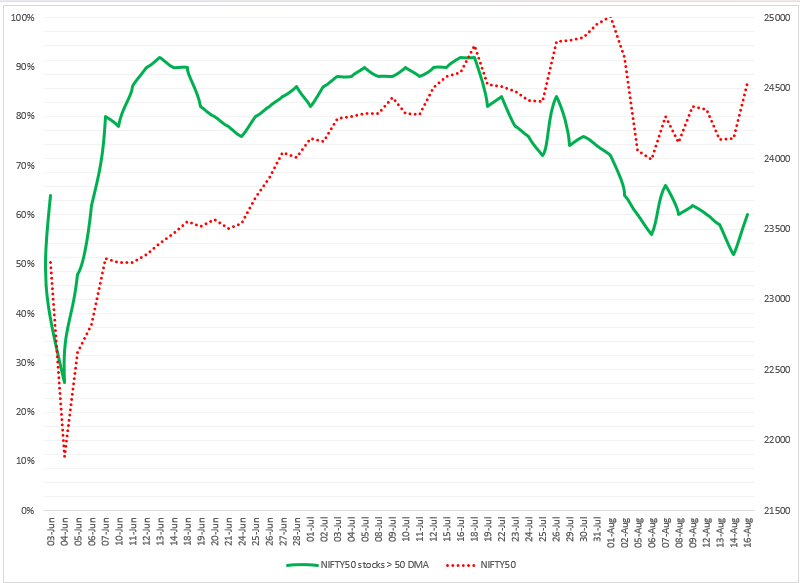
In our previous blog, we emphasised that with 60% of NIFTY50 stocks trading above their 50-day moving average, the index was likely to experience range-bound activity. Aside from Friday’s rebound, the index remained within the previous week’s range until the expiry of the weekly options contracts.
This week, the situation remains similar, with 60% of NIFTY50 stocks still trading above their 50-day moving average. As we noted earlier, a range between 50% and 70% typically suggests range-bound activity. However, Friday’s rebound could signal a potential shift. If the percentage of stocks trading the 50-day moving average rises to 66% and holds, it could extend the rally and a move beyond 70% might trigger a strong upward momentum.
FIIs positioning in the index
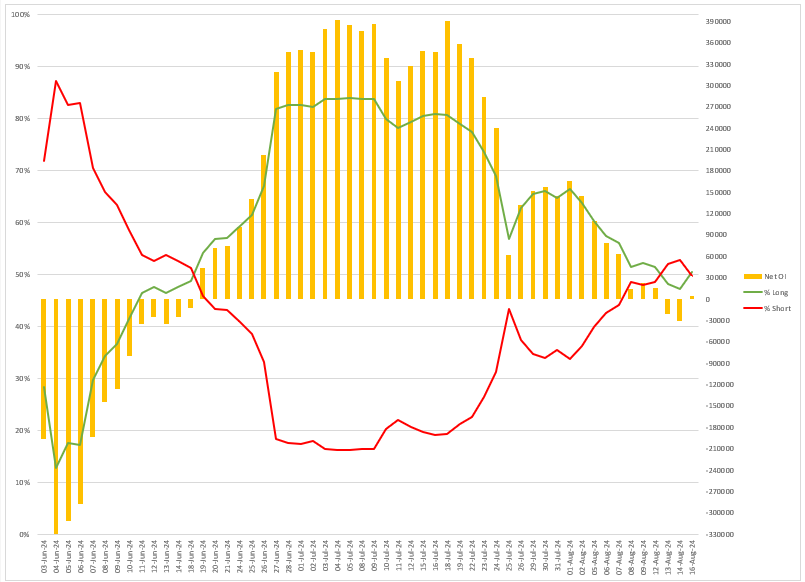
Over the past week, the Foreign Institutional Investors (FIIs) maintained their neutral stance in index futures. The current long-to-short ratio of FIIs open interest in the index futures stands at 50:50, a mild change from last week’s 52:48.
The neutral stance of FIIs in the index futures was in line with the market's range-bound activity. Additionally, with the NIFTY50 index broadly remaining range-bound for the last two weeks, traders can closely monitor the changes in the long-to-short ratio in the coming week to better gauge the sentiment. As illustrated in the chart below, the green line represents the percentage of long contracts, while the red line indicates the percentage of short contracts.
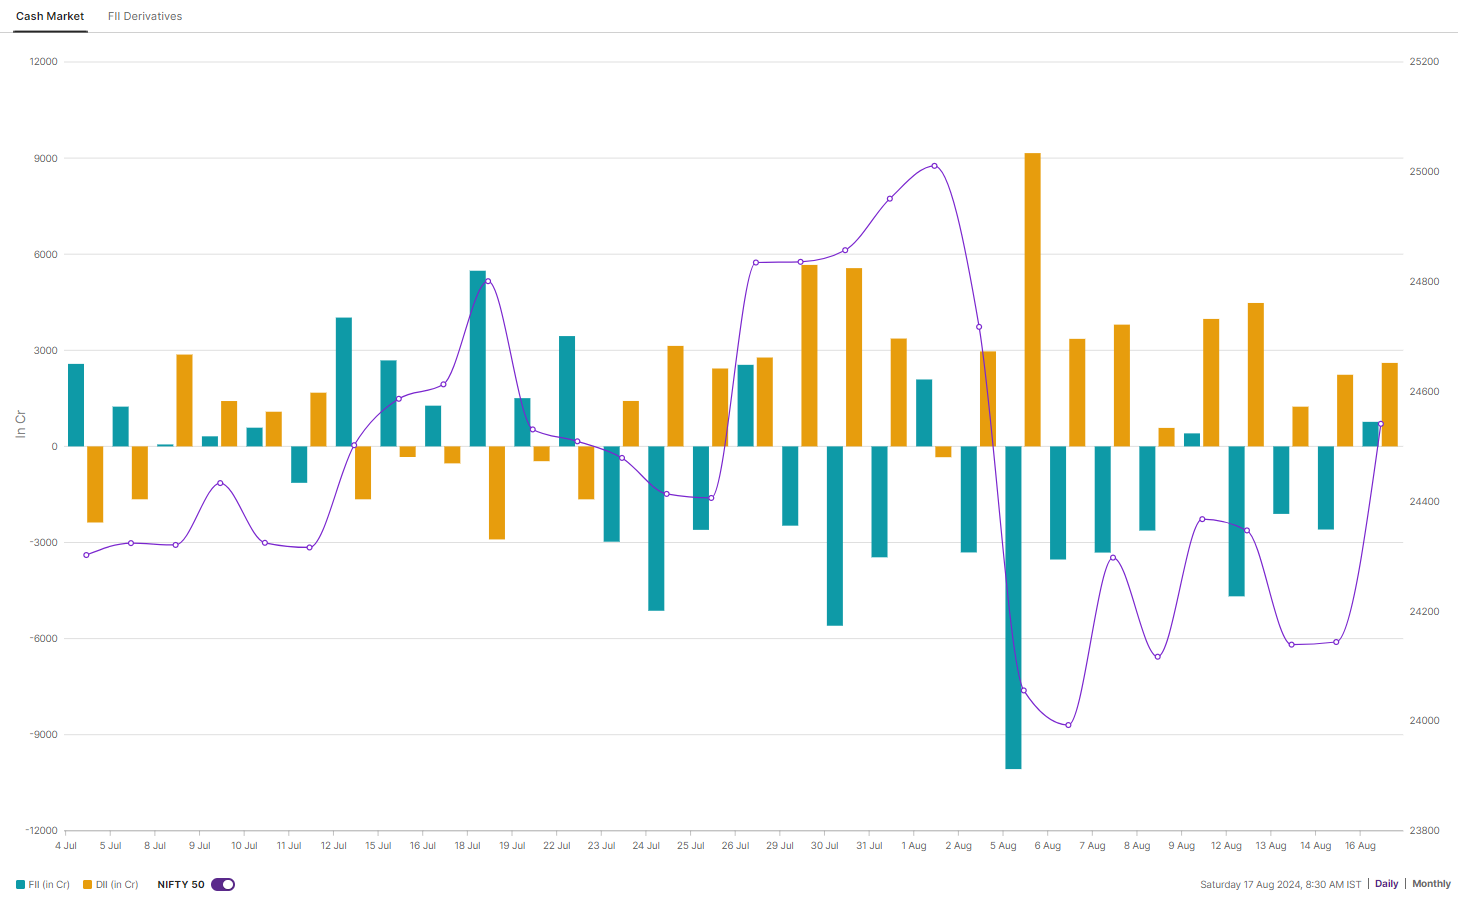
On the other hand, the cash market activity of foreign institutional investors (FIIs) remained bearish as they offloaded shares worth ₹6,776 crore, while the Domestic Institutional Investors (DIIs) remained net buyers and bought shares worth ₹8,720 crore, taking the net institutional activity to ₹1,943 crore.
F&O - NIFTY50 outlook
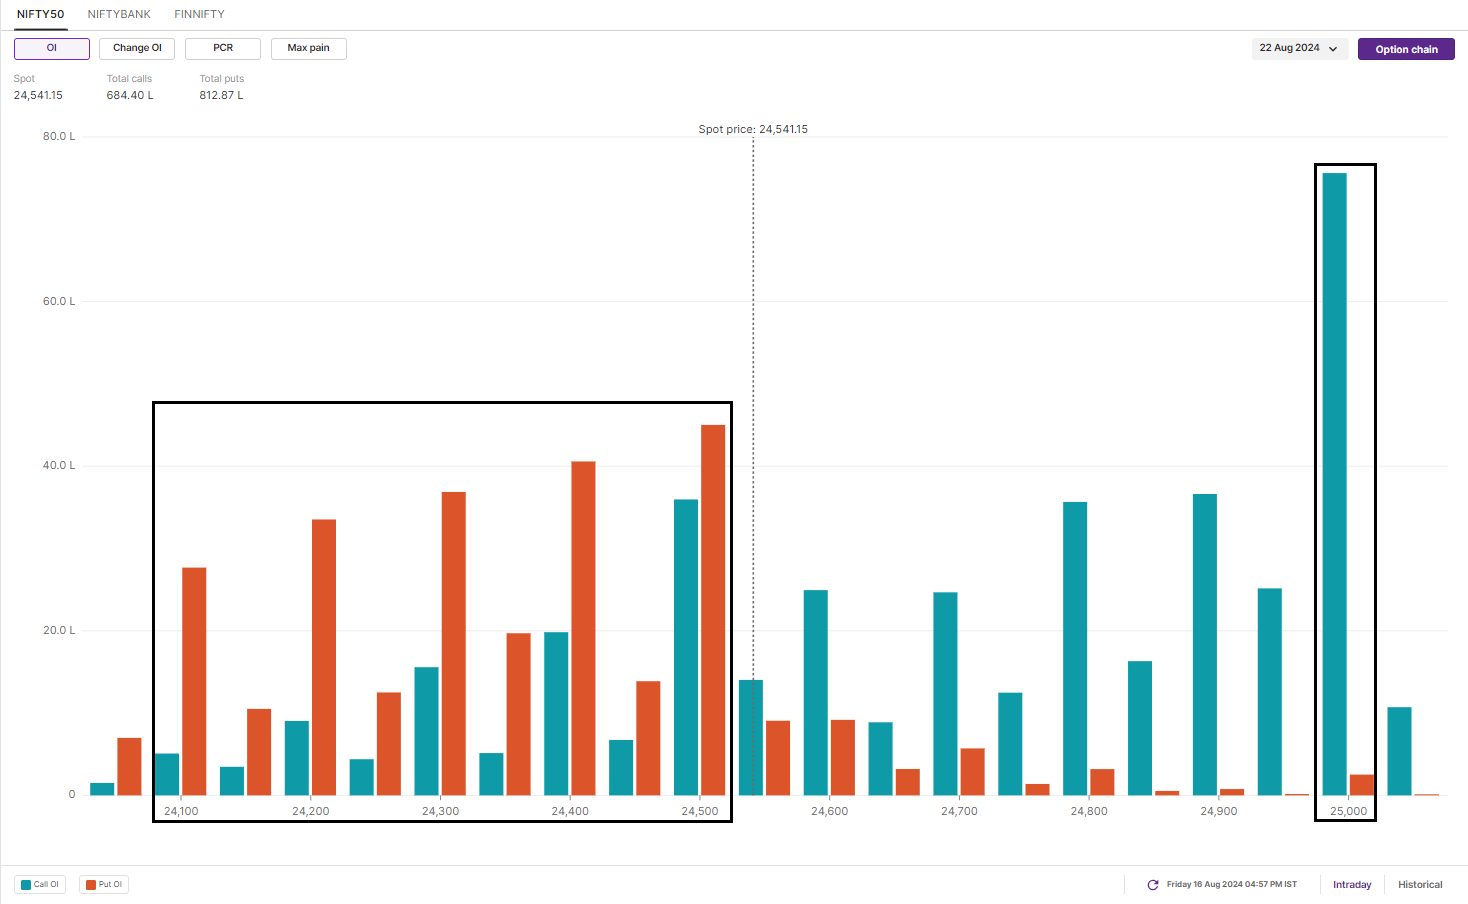
The open interest for the August 22 expiry saw a fresh build of puts from 24,500 to 24,100 strikes on Friday the 16th, indicating a strong rebound and the emergence of fresh buyers at lower levels. Conversely, the highest call base is at the 25,000 strike, suggesting immediate resistance.
In last week’s blog, we pointed out the formation of a bullish hammer on the weekly chart of NIFTY50. We informed our readers to monitor the close above the hammer’s high (24,400) for confirmation of the pattern.
Last week, the NIFTY50 closed above the previous week’s high, confirming the bullish reversal pattern. Additionally, the formation of the bullish candle on the weekly chart indicates that the index may potentially attempt to fill the bearish gap until 24,700 formed on 5 August. However, traders should monitor the price action around the 24,700 and 24,800 zones, as a close above this zone can drive the index towards the 25,000 mark.
F&O - BANK NIFTY outlook
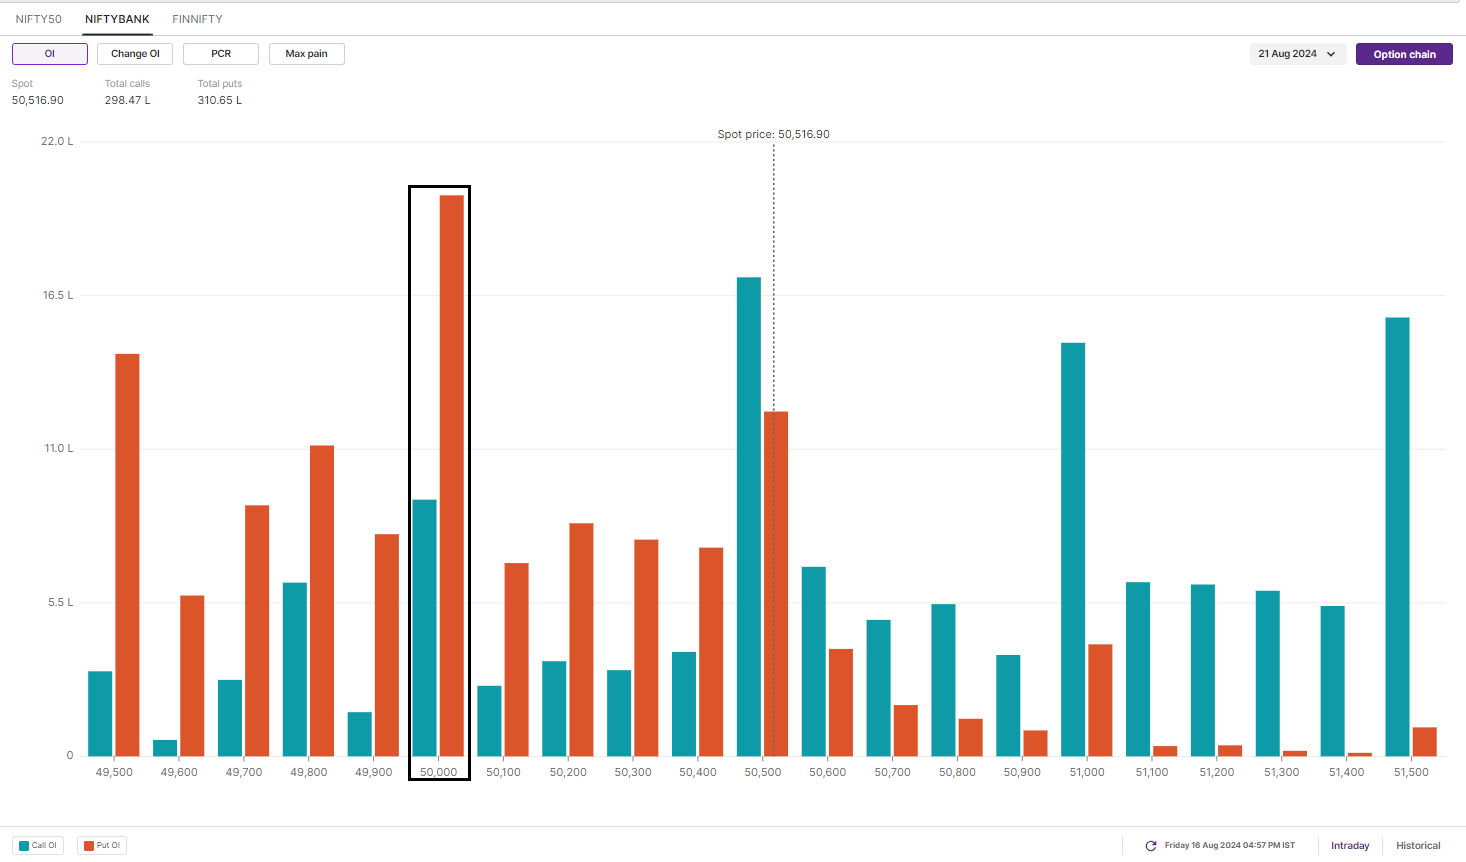
The open interest build-up for the 21 August expiry saw significant OI build-up at 50,000 and 49,500 strikes on Friday, August 16th. This indicates that the index has immediate support around these levels. Meanwhile, the call base was established at 51,000 and 50,500 strikes, establishing resistance around these levels.
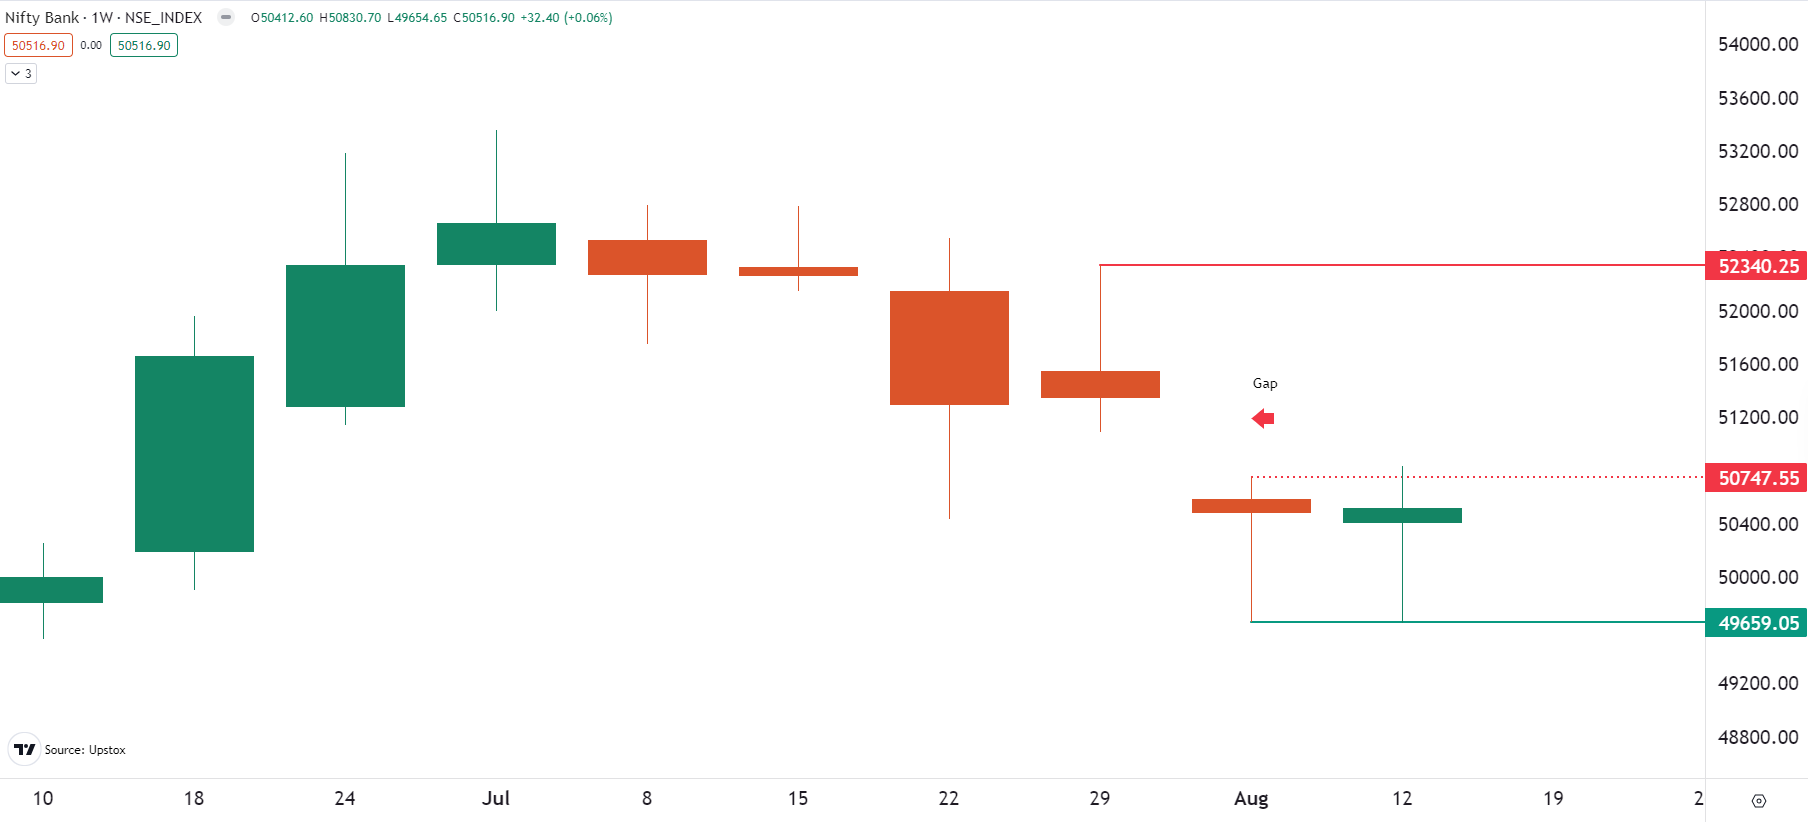
In our last week’s analysis, we pointed out support for the index around the 49,600 level and resistance around the 51,100 zone. The BANK NIFTY traded within this range and formed an indecision candle on the weekly chart.
During this month, we broadly expect BANK NIFTY to trade between the range of 52,300 and 49,600. Additionally, the index has immediate resistance around the 50,700 zone. A move above this zone can lead the index to fill the bearish gap formed on 5 August. However, if the index slips below the 49,600 zone, then it may see a sharp down move till the 48,500 zone.
The Fed will also release the minutes of its late July meeting on Wednesday, August 21. In addition, the weekly jobs data, new home sales data, and Japan's inflation data will be the most important data points that will be closely watched this week.
The recent rebound could see the index close the bearish gap created on August 5th at 24,700. However, traders should monitor the price action between 24,700 and 24,800. A close above this area will push the index higher, while a reversal will lead to range trading between 24,800 and 24,000.
To stay updated on any changes in these levels and all intraday developments, be sure to check out our daily morning trade setup blog, available before the market opens at 8 am.
Derivatives trading must be done only by traders who fully understand the risks associated with them and strictly apply risk mechanisms like stop-losses. The information is only for consumption by the client, and such material should not be redistributed. We do not recommend any particular stock, securities, or trading strategies. The securities quoted are exemplary and not recommendatory. The stock names mentioned in this article are purely to show how to do analysis. Make your own decision before investing.
About The Author
Next Story


