Market News
Week ahead: FII activity, monthly expiry, US tariff concern among key market triggers to watch out
.png)
6 min read | Updated on March 23, 2025, 10:50 IST


SUMMARY
NIFTY50 index retested its 200-day exponential moving average (EMA) after twenty seven trading sessions, reclaiming the crucial resistance zone of 22,800 zone. Meanwhile, the India VIX, a key gauge of market volatility, dropped over 5% last week to 12.5, signalling a more favorable environment for bulls.

Two key US economic events, Q4 GDP estimate and PCE report will drive market sentiment next week. | Image: Shutterstock
Indian markets saw a remarkable rally, with the NIFTY50 index rising over 4%, its best weekly performance in four years. The rally was fuelled by a change in sentiment from foreign investors, who became net buyers after relentless selling since October 2025. In addition, hints of two rate cuts by the U.S. Federal Reserve in 2025 and continued weakness in the dollar index boosted risk appetite and attracted fresh inflows into emerging markets.
Meanwhile, the India VIX, a measure of market volatility, fell to a five month low, indicating reduced investor uncertainty. However, despite these positive developments, uncertainty surrounding U.S. President Donald Trump's tariff deadline of April 2 could weigh on market sentiment. Investors remain cautious about the impact of such tariffs on global trade and economic stability.
The broader markets also experienced a significant rebound, rallying from crucial support zones. The NIFTY Midcap 100 index surged over 7%, while the Smallcap 100 index rose more than 8%. Across the sectoral indices contributed to the upward momentum, with Real-Estate leading the pack with a gain of 7.8%, followed closely by Energy at 6.3%, and Pharmaceuticals at 6%.
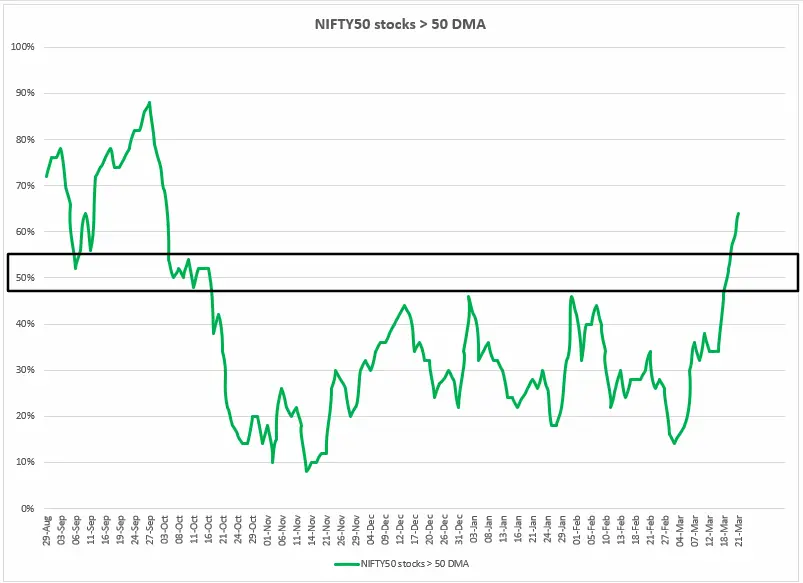
Index breadth
The NIFTY50 index has seen a significant shift, with its breadth crossing the key 50% mark and hitting 64%—its highest level since October. This metric, which tracks the percentage of NIFTY50 stocks trading above their 50-day moving averages, signals improving market health and a broad-based recovery.
Historically, a rising breadth has aligned with sustained market rallies. However, the key question is whether this momentum will hold. Last week, only 35% of the NIFTY50 stocks were above their 50-day moving averages, reflecting market weakness.
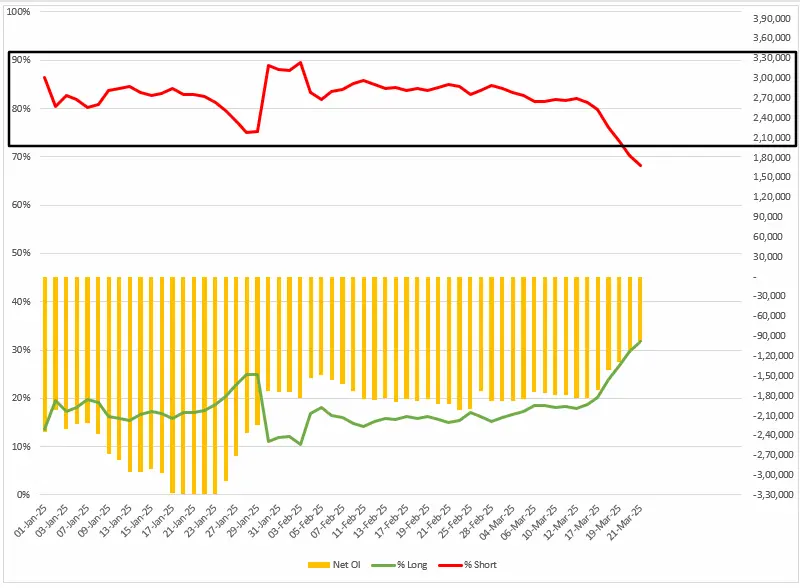
FIIs positioning in the index
Foreign Institutional Investors (FIIs) have significantly reduced their bearish bets on index futures, triggering a short-covering rally. Last week, the long-to-short ratio of FIIs in index futures improved to 32:68 from 19:81 a week earlier. Moreover, their net short open interest fell by nearly 50% to -96,715 contracts.
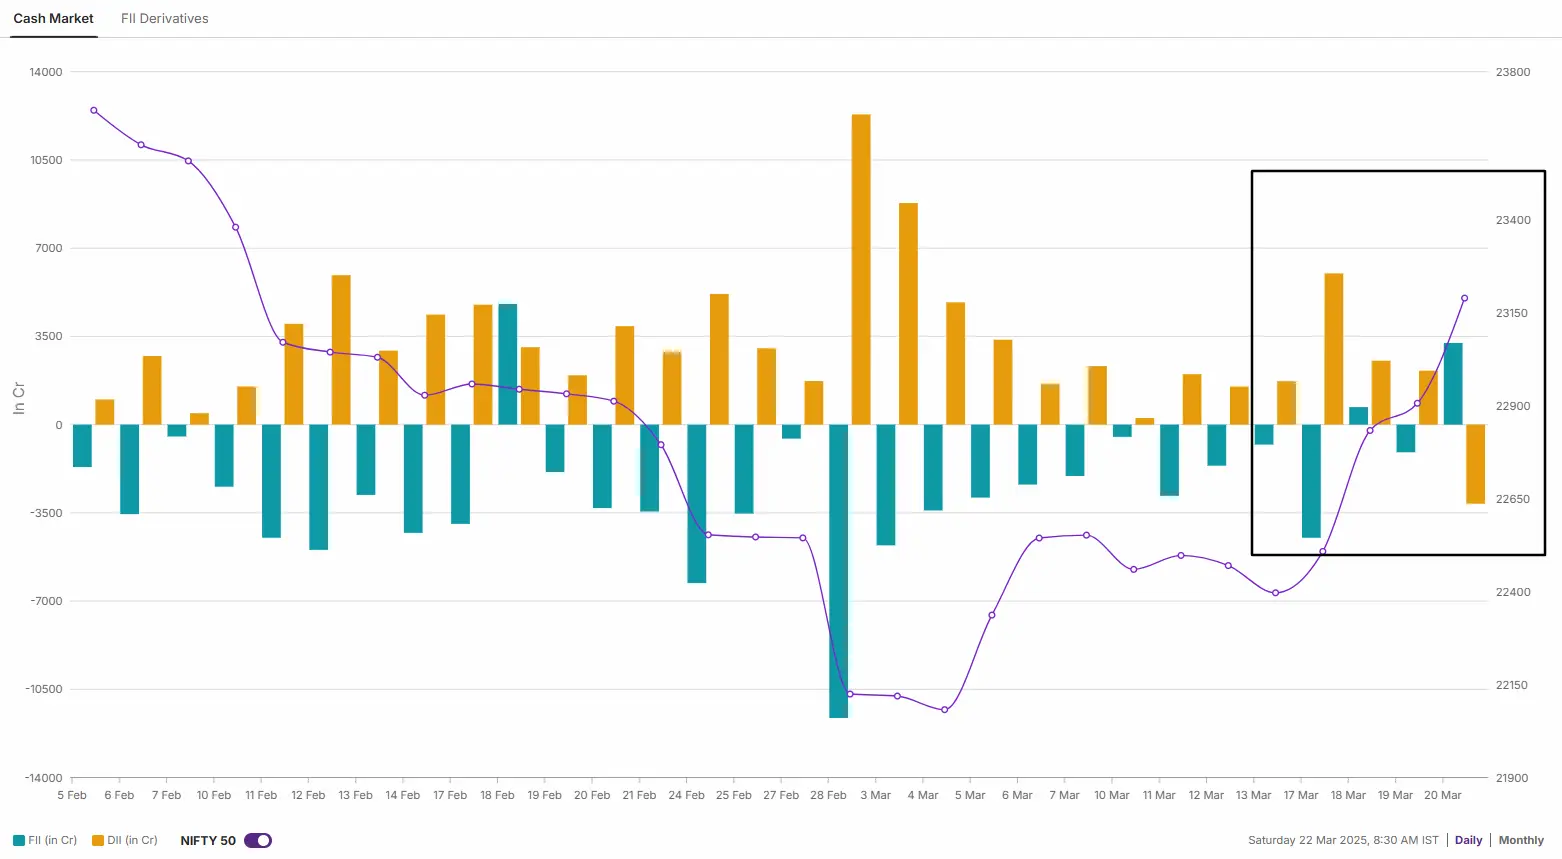
The FIIs' short-covering on index futures aligned with their cash market activity. After a prolonged selling spree, they turned net buyers for the week, purchasing shares worth ₹6,587 crore in the cash market. In contrast, Domestic Institutional Investors scaled back their purchases, buying shares worth ₹3,831 crore.
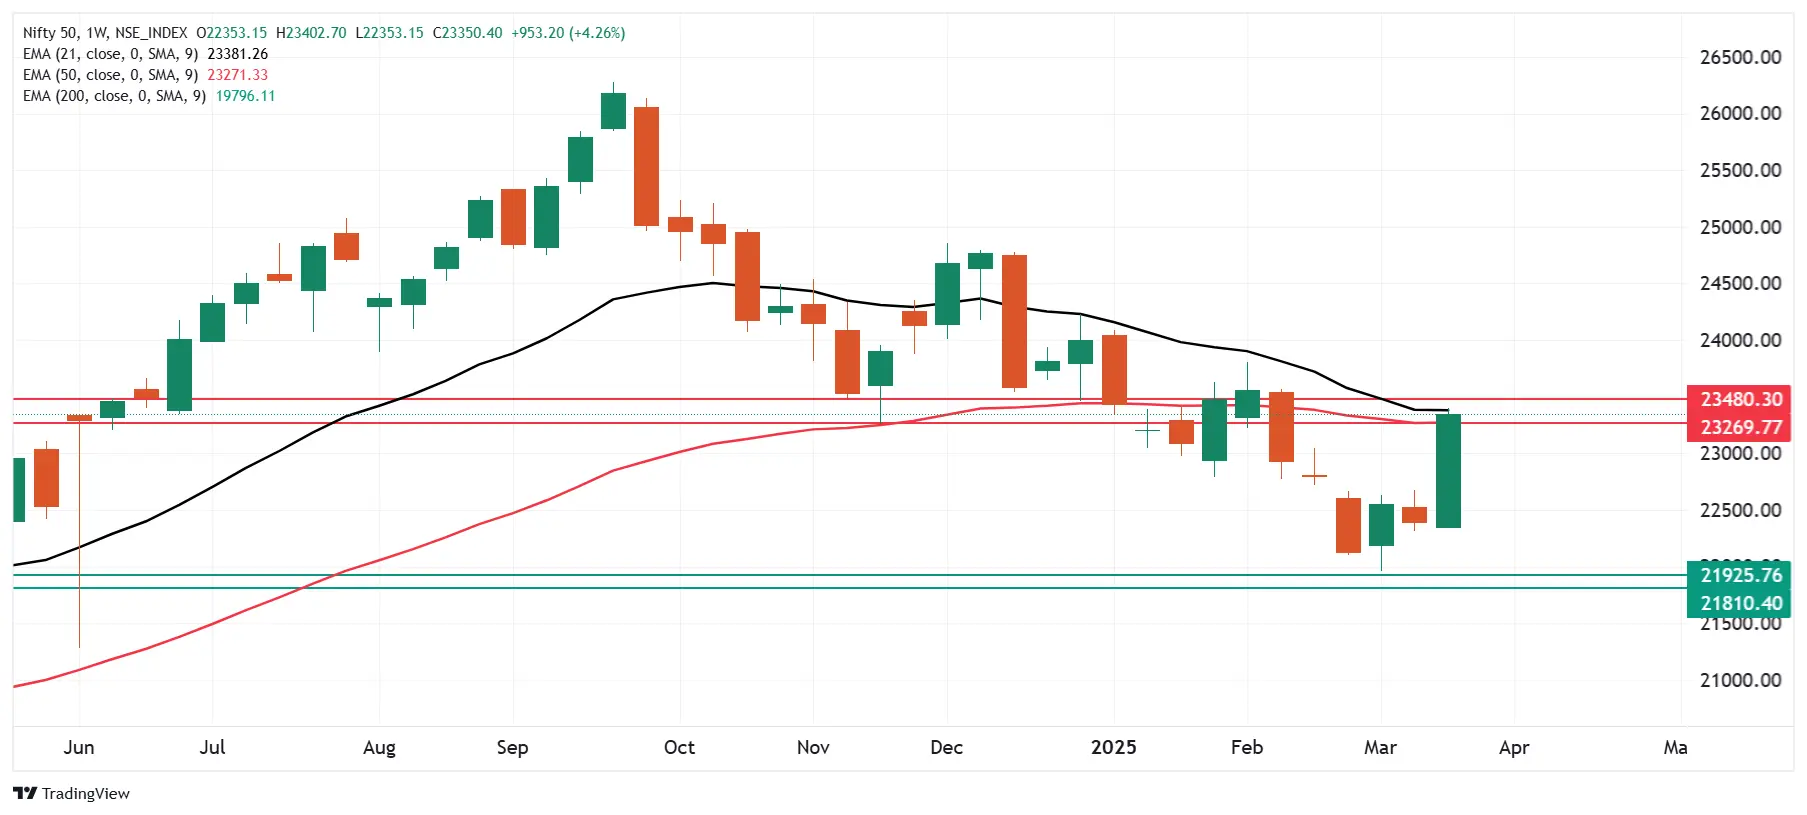
NIFTY50 outlook
The NIFTY50 index gained over 4% last week, closing above the previous four-week high and forming a bullish candlestick on the weekly chart. With this rally, the index also confirmed the bullish hammer candlestick pattern formed for the week ending March 7th. This indicates that the short-term trend for the index has turned bullish, with immediate support at the 22,700 level. On the other hand, resistance for the index is around the 24,000 zone.
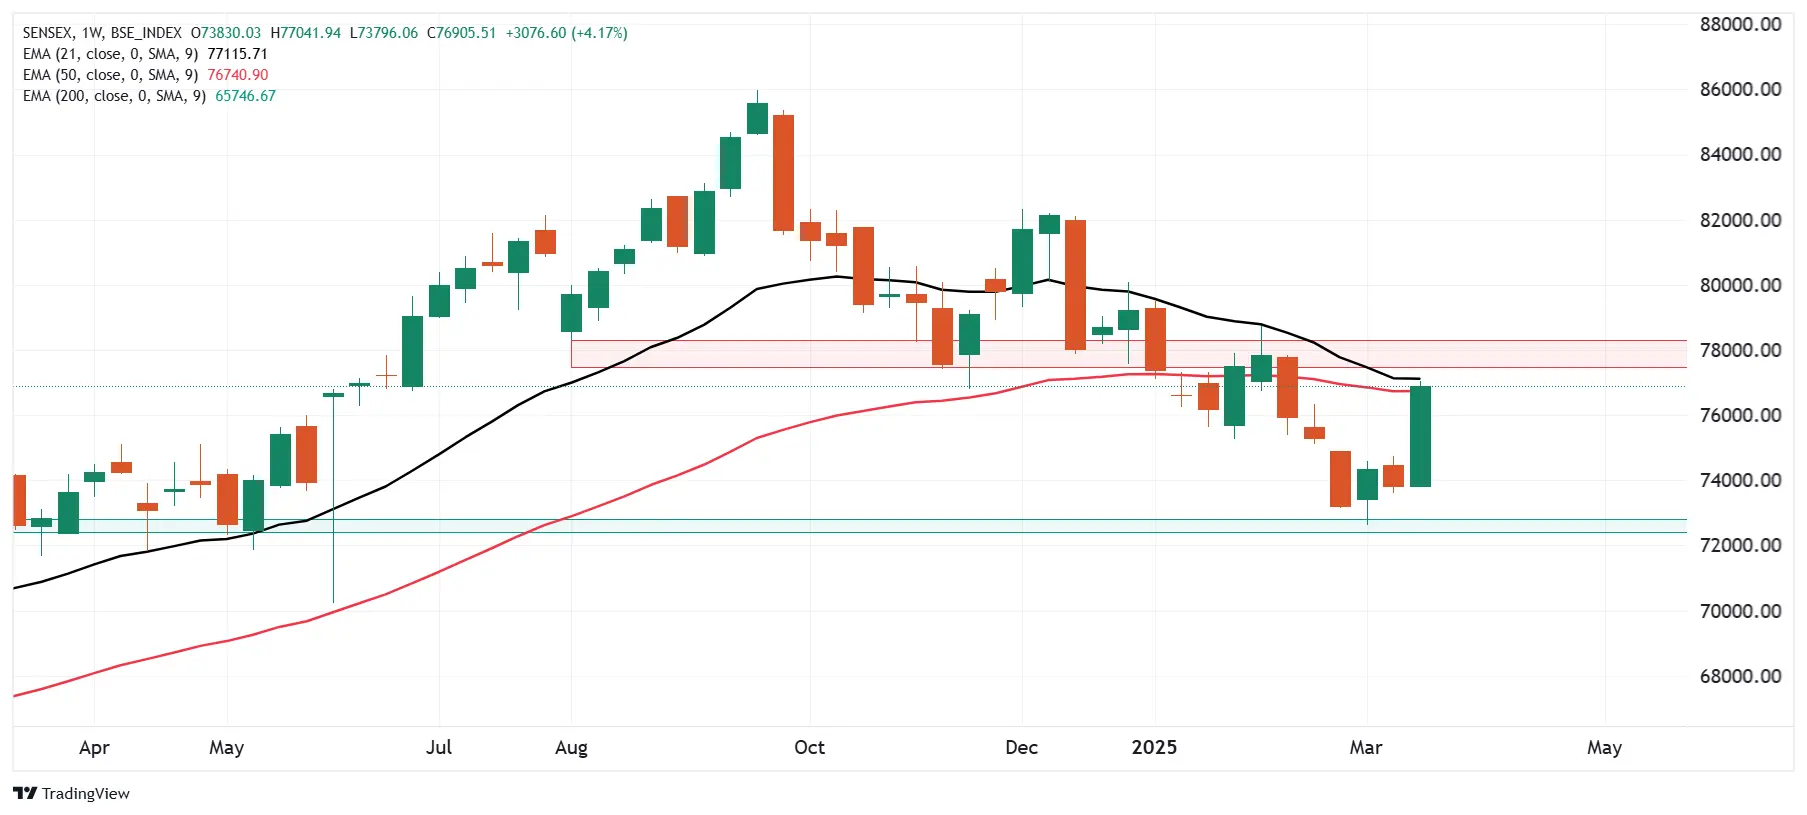
SENSEX outlook
The SENSEX also turned in a strong performance, rising over 4% to post its best weekly gain in over four years. The gains were supported by broad-based participation across sectors. The index also formed a bullish candle on the weekly chart, confirming the hammer candlestick pattern.
For the next few sessions, the index's immediate support is around the 72,600 level, while resistance is near the 78,300 mark.
For intraday range updates and revisions to these levels, visit our daily morning trade setup blog, published at 8 AM before the market opens.
About The Author
Next Story


