Market News
Trade Setup for Sept 3: BANK NIFTY faces resistance at 50 DMA, lacks follow-through momentum
.png)
4 min read | Updated on September 03, 2024, 07:58 IST
SUMMARY
Traders should closely monitor BANK NIFTY’s support zone at 50,900 and the resistance zone at 51,500. A decisive break above or below this range, whether on an intraday or closing basis, will offer clear directional signals
Stock list
The NIFTY50 index started the week on a bullish note, extending its upward momentum for the 13th consecutive day.
Asian markets update at 7 am
The GIFT NIFTY is flat, pointing to a subdued start for the NIFTY50 today. Meanwhile, other Asian markets are trading mixed. Japan's Nikkei 225 is up 0.6%, while Hong Kong's Hang Seng Index is down 0.1%.
U.S. markets were closed on Monday due to Labour day holiday.
NIFTY50
- September Futures: 25,340 (▼0.1%)
- Open Interest: 5,97,764 (▲7.2%)
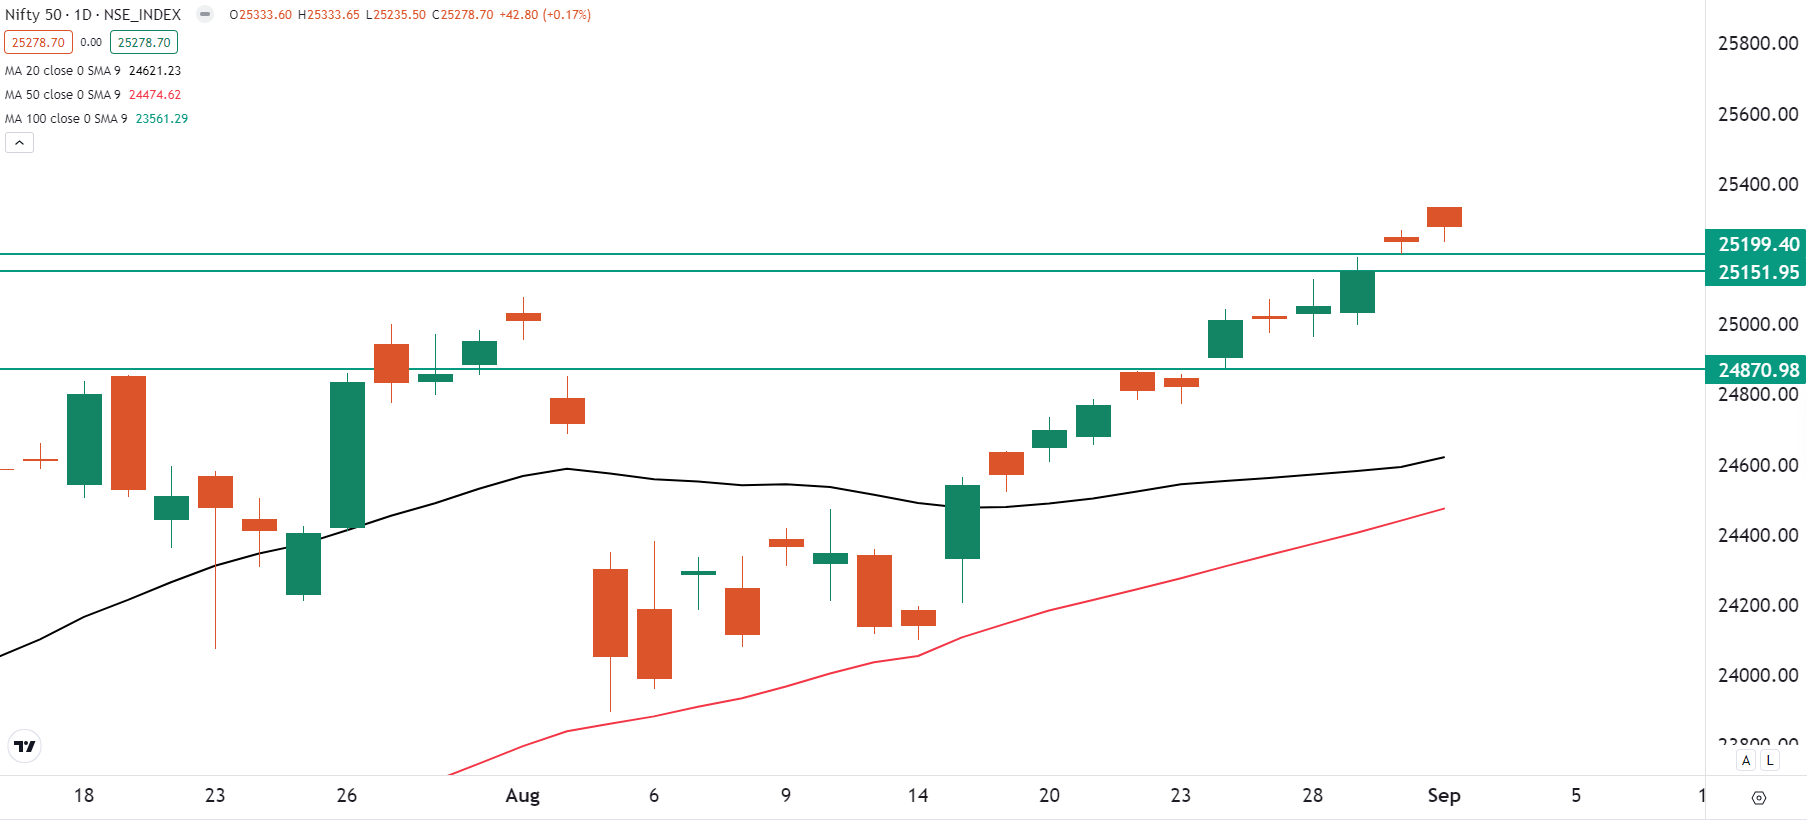
The NIFTY50 index started the week on a bullish note, extending its upward momentum for the 13th consecutive day. However, despite this promising start, the index eventually gave up all of its early gains and closed the day with a bearish candle on the daily chart, reflecting a close below the opening level.
As you can see on the daily chart, the index has formed a negative or pause candle. However, the broader trend of the index remains positive until the index holds above the 24,800 zone on a closing basis. However, it is important to note that the NIFTY50 formed a bullish gap after the breakout from its previous all-time high.
The price action around this immediate bullish gap (around the 25,150 area) is something traders can watch closely. If the index forms a reversal pattern on a smaller time frame, it could signal the arrival of fresh buyers. Conversely, if the index falls below this level on a closing basis, it could signal short-term weakness.
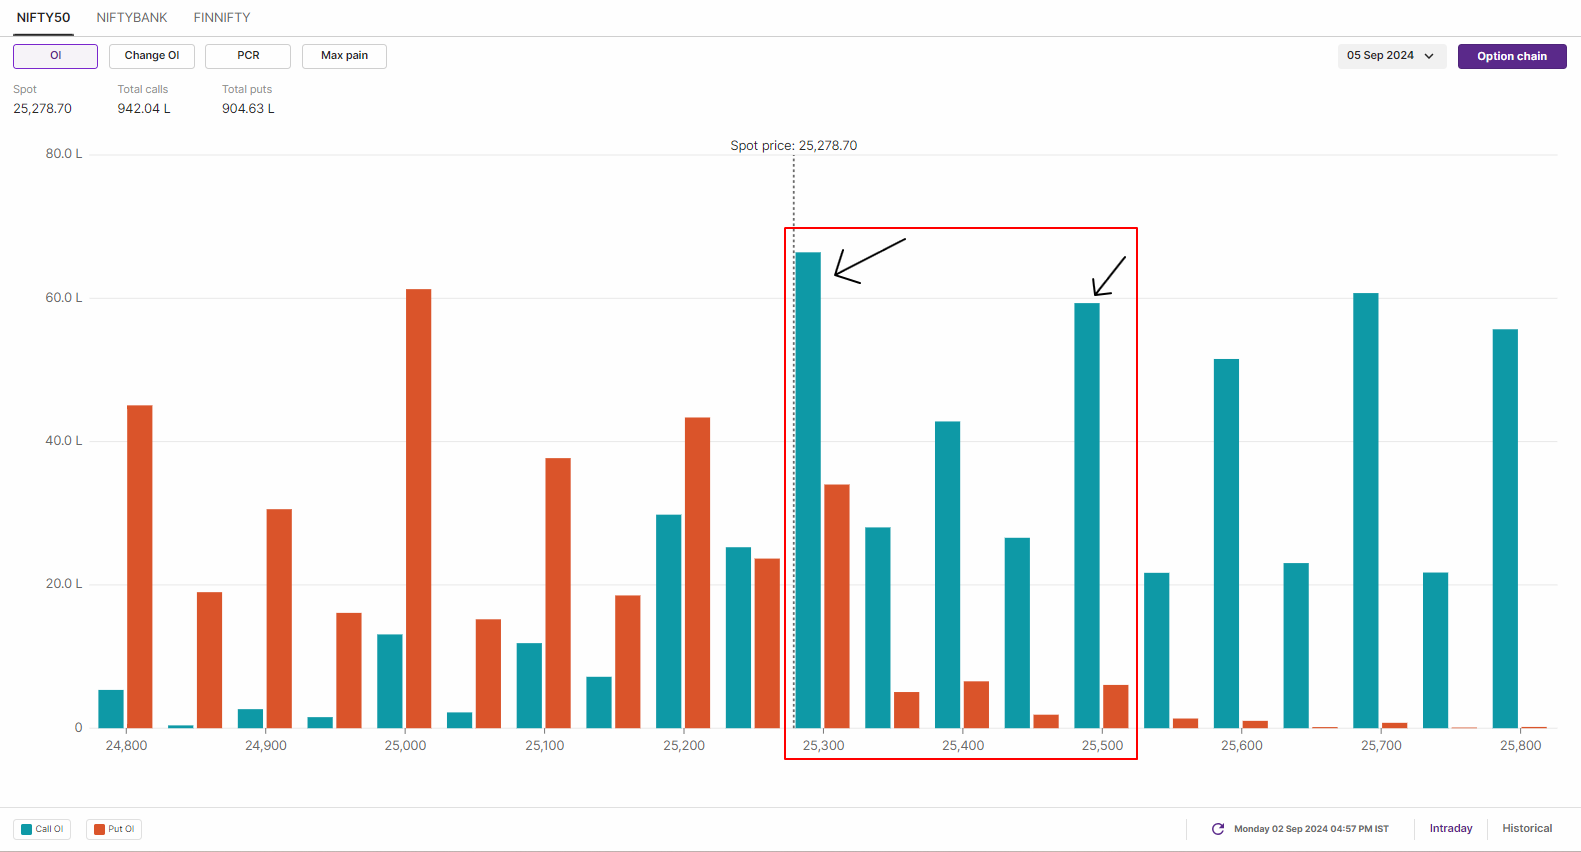
The open interest for the 5th of September expiry saw the entry of call writers at the 25,300 and 25,500 strikes, indicating resistance for the index around these strikes. On the flip side, maximum put open interest was seen at the 25,000 strike, with significant unwinding seen at the 25,200 strike.
BANK NIFTY
- September Futures: 51,650 (▼0.0%)
- Open Interest: 1,57,519 (0.0%)
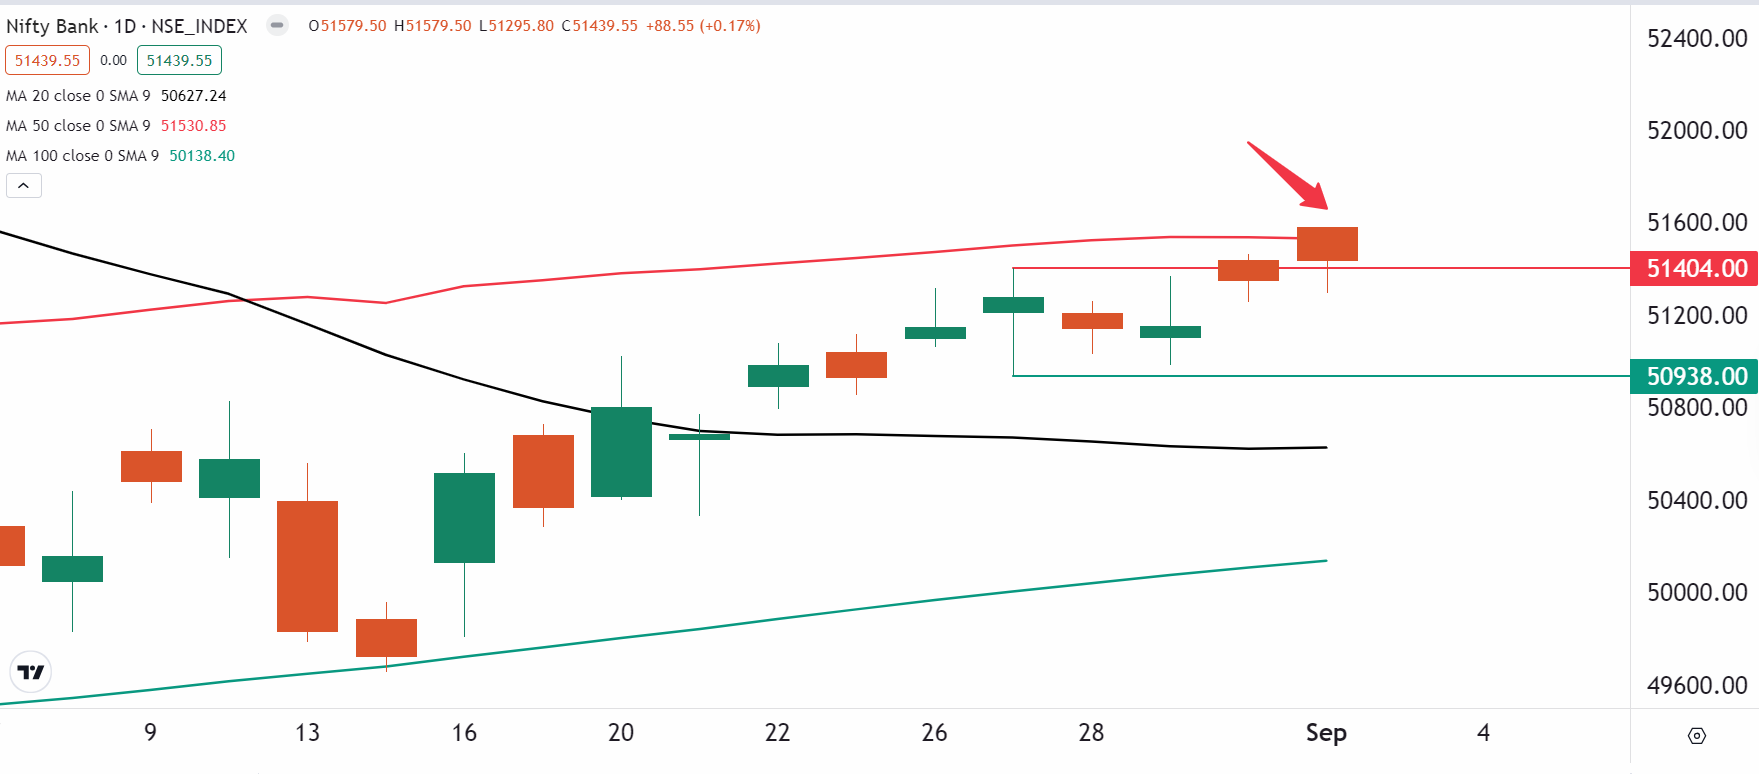
The BANK NIFTY also opened the day on a bullish note but encountered resistance around its 50-day moving average, leading to a consolidation in a narrow range throughout the session. This resulted in the formation of a negative candle on the daily chart, signaling a pause in the recent rebound.
The index remained trapped between its 50-day and 20-day moving averages (DMA), struggling to generate any follow-through momentum despite opening above the previous week’s high.
For the upcoming sessions, traders should closely monitor the support zone at 50,900 and the resistance zone at 51,500. A decisive break above or below this range, whether on an intraday or closing basis, will offer clear directional signals.
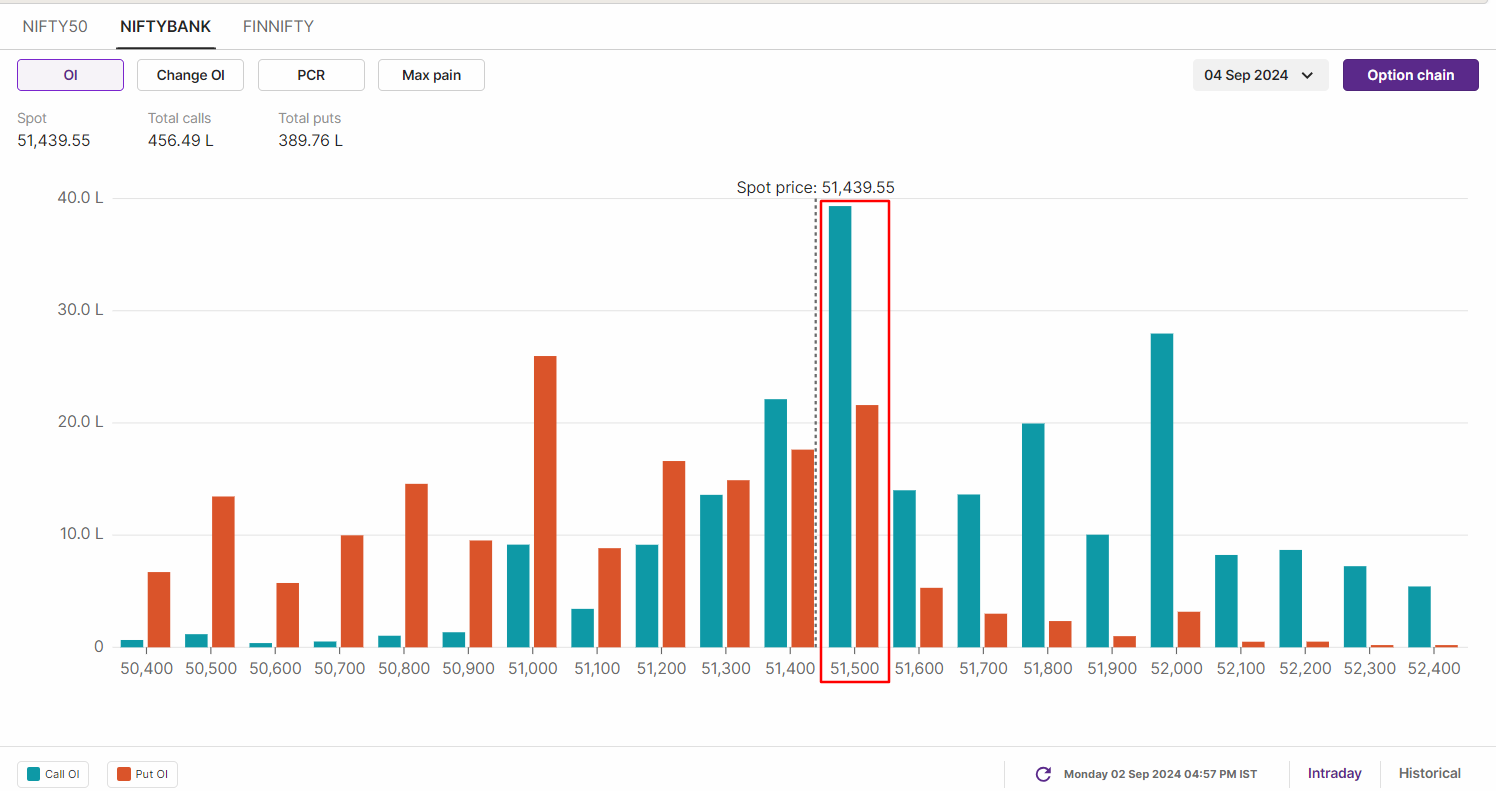
The positioning of open interest on the BANK NIFTY is largely unchanged from Friday 30th August. The index has a significant call base at the 51,500 and 52,000 strikes, indicating resistance for the index around these strikes. On the other hand, put writers have made their base at 51,000 and , making it an immediate support zone for the index.
FII-DII activity
Stock scanner
Short build-up: Indus Towers, Hindustan Copper, ABB, NMDC and Dr Reddy’s Laboratories
Under F&O ban: Balrampur Chini Mills and Hindustan Copper
Added under F&O ban: Hindustan Copper
In Futures and Options or F&O, long build-up means an increase in Open Interest (OI) along with an increase in price, and short build-up means an increase in Open Interest(OI) along with a decrease in price.
Source: Upstox and NSE.
Disclaimer: Derivatives trading must be done only by traders who fully understand the risks associated with them and strictly apply risk mechanisms like stop-losses. The information is only for consumption by the client and such material should not be redistributed. We do not recommend any particular stock, securities and strategies for trading. The securities quoted are exemplary and are not recommendatory. The stock names mentioned in this article are purely for showing how to do analysis. Take your own decision before investing.
About The Author
Next Story
