Market News
Trade Setup for Oct 10: NIFTY50 faces rejection from 50 DMA, invalidates bullish harami pattern
.png)
4 min read | Updated on October 10, 2024, 07:13 IST


SUMMARY
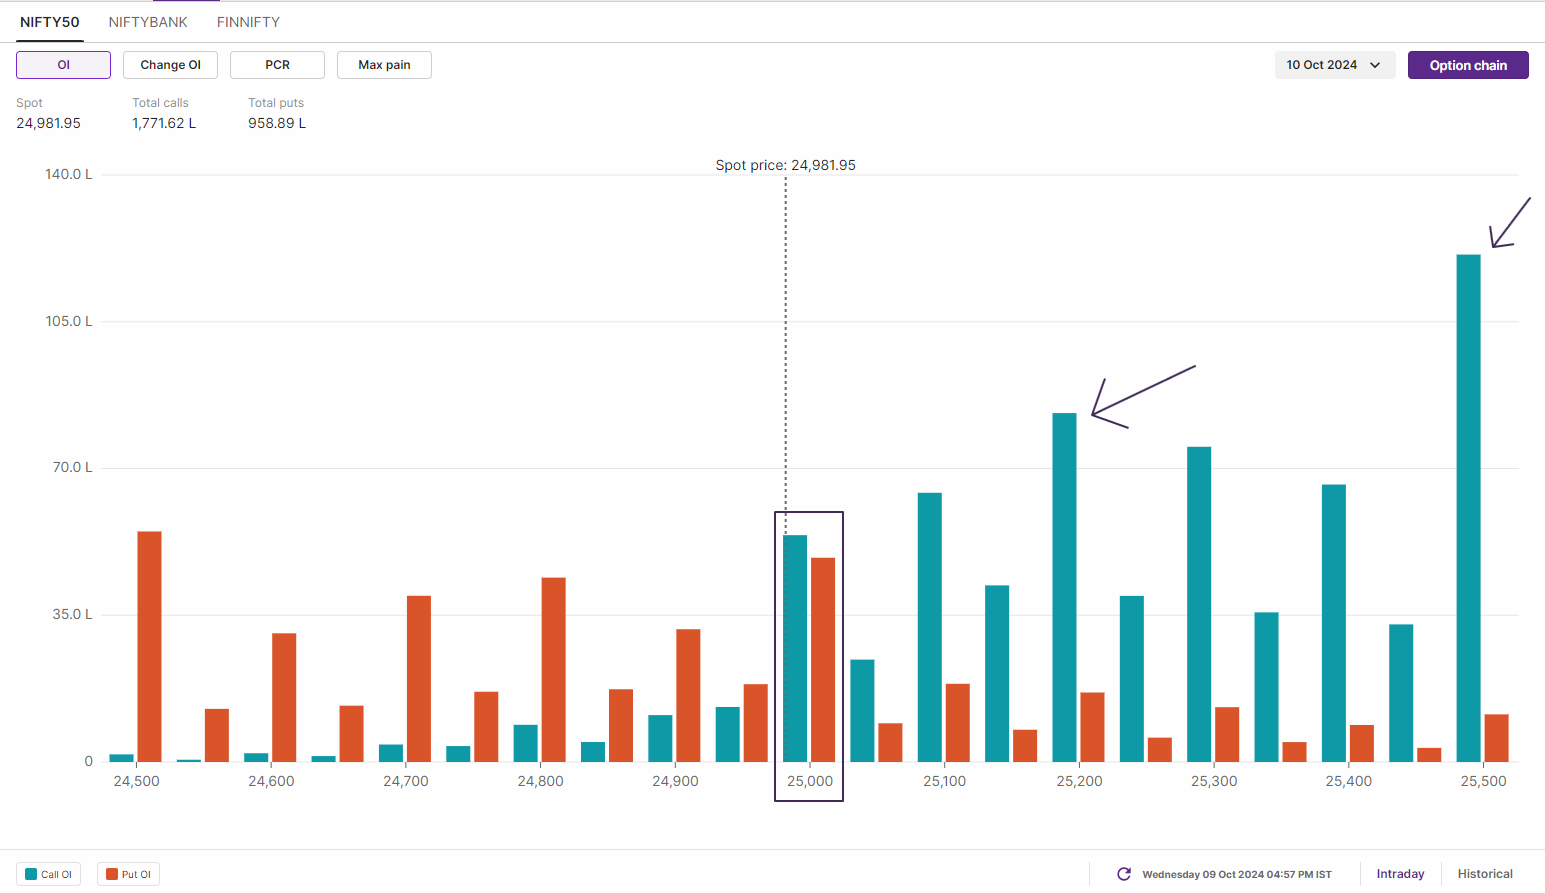
According to the options data, the NIFTY50 index has a significant call OI at 25,500 strike, making it a crucial resistance zone for today’s expiry.
Stock list

The NIFTY50 index failed to build on to its initial gains and fell nearly 300 points from the day’s high, ending the day in the red.
Asian markets update
The GIFT NIFTY is up 0.4%, indicating a gap-up start for the NIFTY50 today. Meanwhile, other Asian markets are also trading in the green. Japan's Nikkei 225 is up 0.5%, while Hong Kong's Hang Seng Index rose 2.7%.
U.S. market update
- Dow Jones: 42,512 (▲1.0%)
- S&P 500: 5,792 (▲0.7%)
- Nasdaq Composite: 18,291 (▲0.6%)
U.S. indices ended Wednesday's session in the green, with the Dow Jones and S&P 500 closing at fresh record highs. This comes after the minutes of the Federal Reserve's September meeting showed that the vast majority of officials supported a half percentage point rate cut.
Following the release of the minutes, markets are pricing in a 24% chance that the Fed will not cut rates at its November meeting. This is a significant jump from 0% a week ago, according to the CME FedWatch tool.
NIFTY50
- October Futures: 25,083 (▼0.0%)
- Open Interest: 5,53,931 (▼1.3%)
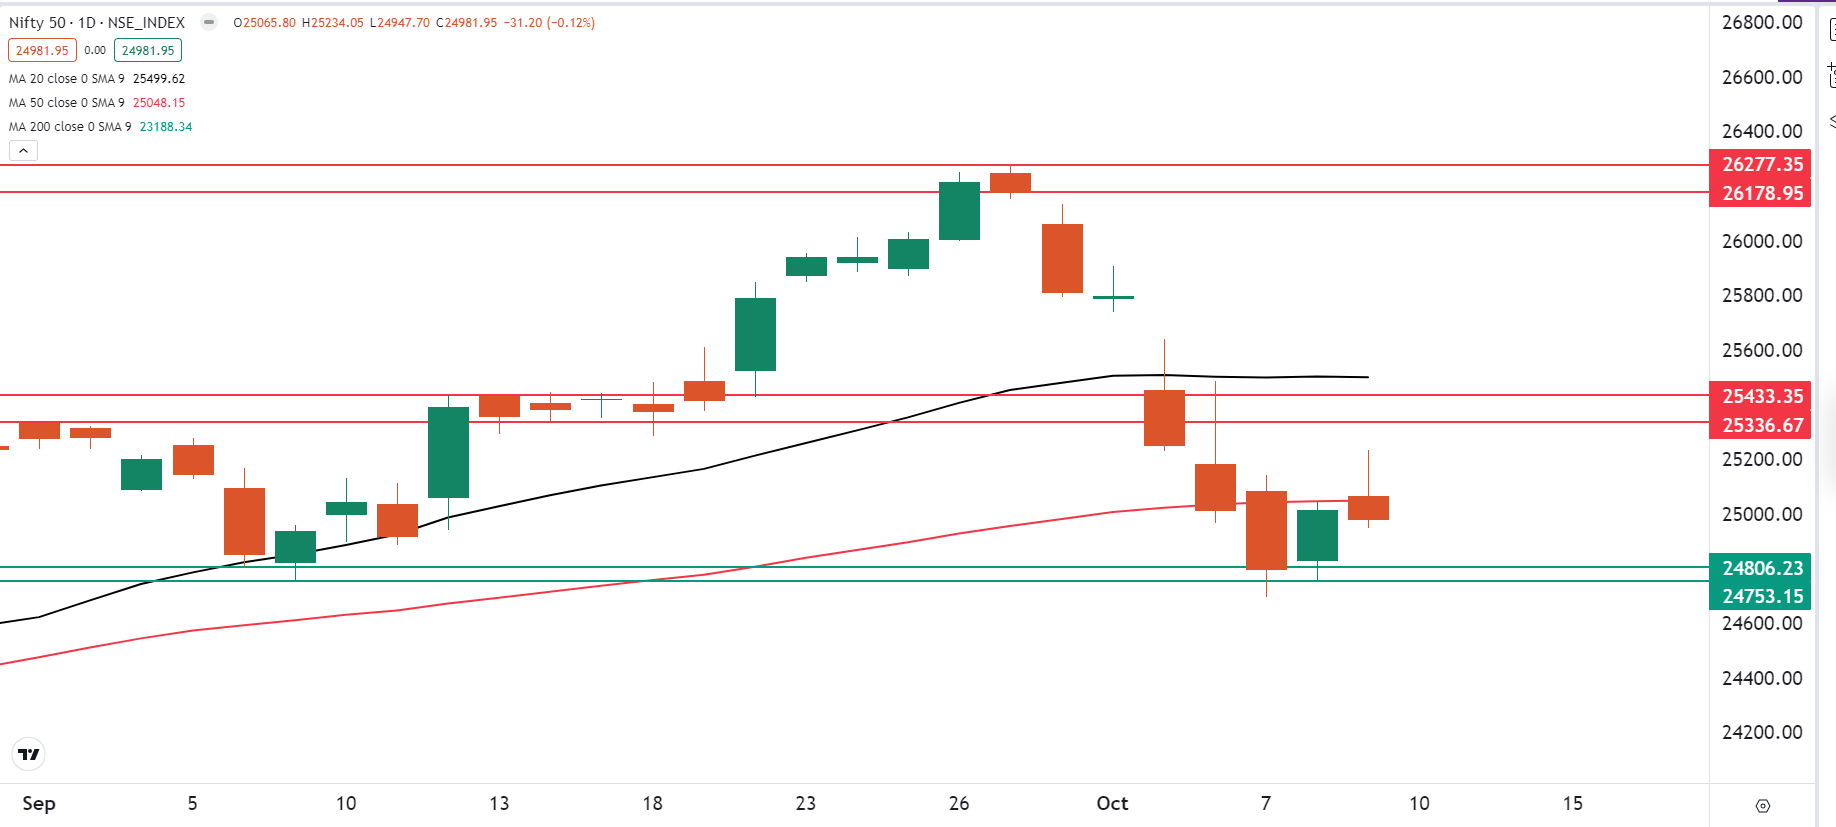
The NIFTY50 index failed to build on to its initial gains and fell nearly 300 points from the day’s high, ending the day in the red. The index invalidated the bullish harami pattern, formed on 8 october, ending the day below previous day’s high.
On the daily chart, the index failed to cross the bearish candle formed on 7 October and witnessed selling pressure from its 50-day moving average. Additionally, the index also invalidated the bullish harami pattern formed on 8 October. A bullish harami is a two candlestick pattern, indicating a potential reversal from a downtrend to an uptrend if the close of the subsequent candle is higher than the reversal pattern.
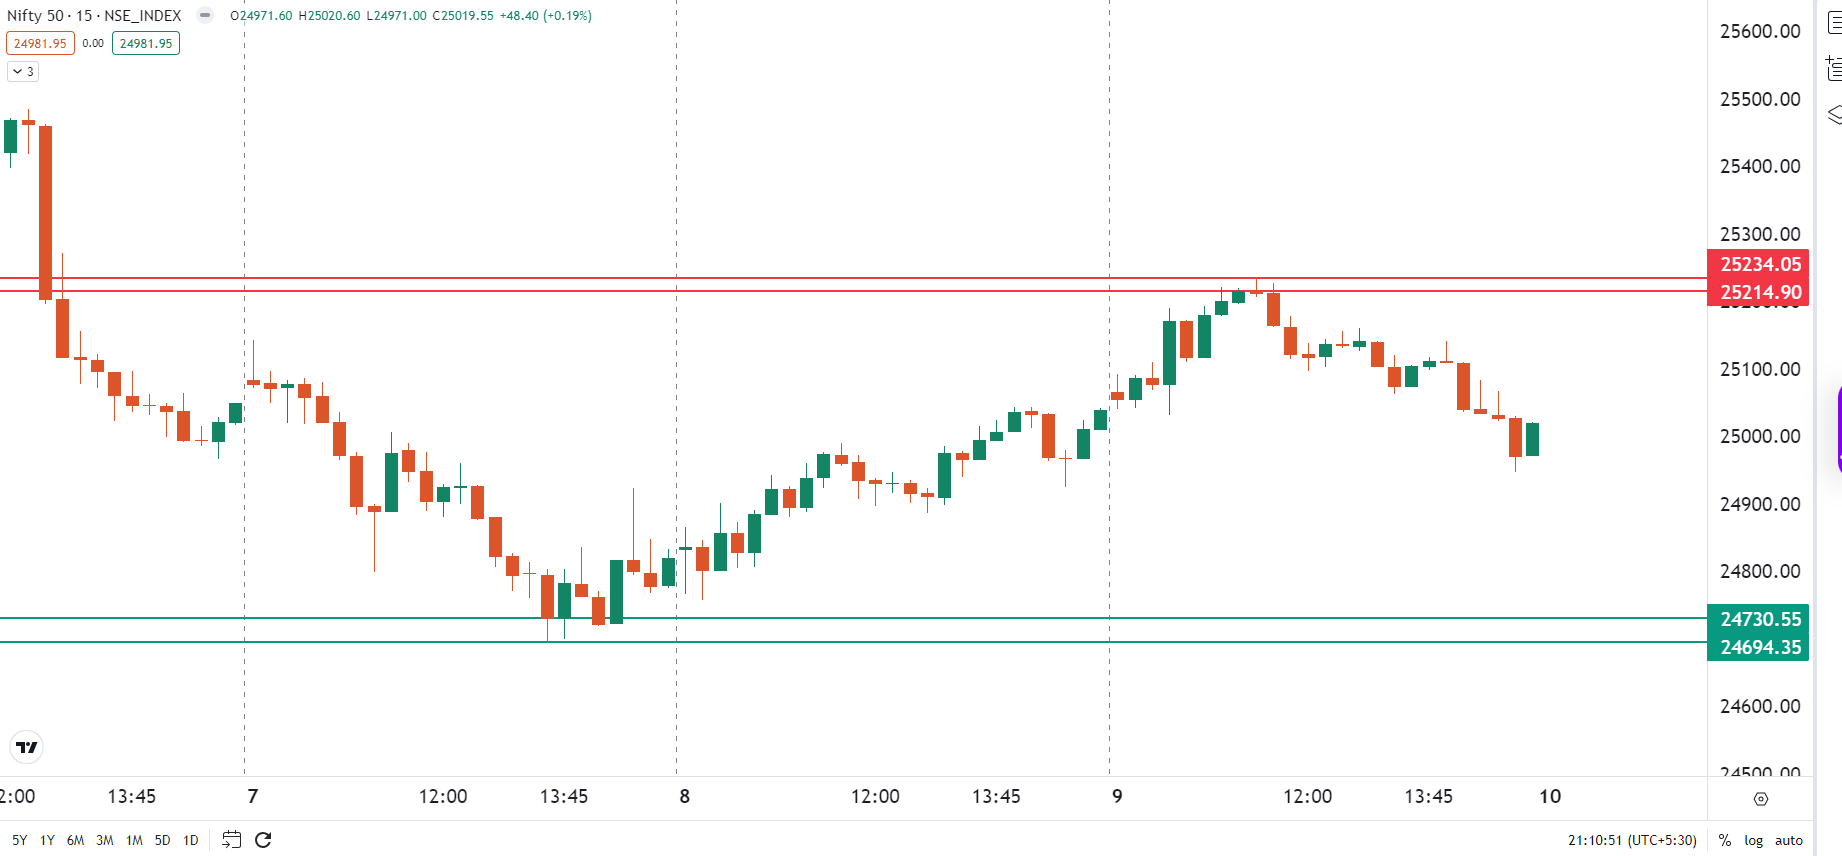
On the 15 minute time-frame, the index is broadly consolidating between 25,250 and 24,700 zone. Unless the index breaks this range on closing basis, the trend may remain range-bound. However, after expansion of volatility, traders should remain cautious from the sharp intraday swings.
The open interest data for today’s expiry has highest call base at 25,200 and 25,500 strikes, marking them as immediate resistance zones for the index. Conversely, the put base was seen at 25,000 and 24,500 strikes, indicating support for the index around these area.
BANK NIFTY
- October Futures: 51,373 (▲0.0%)
- Open Interest: 2,13,218 (▲7.8%)
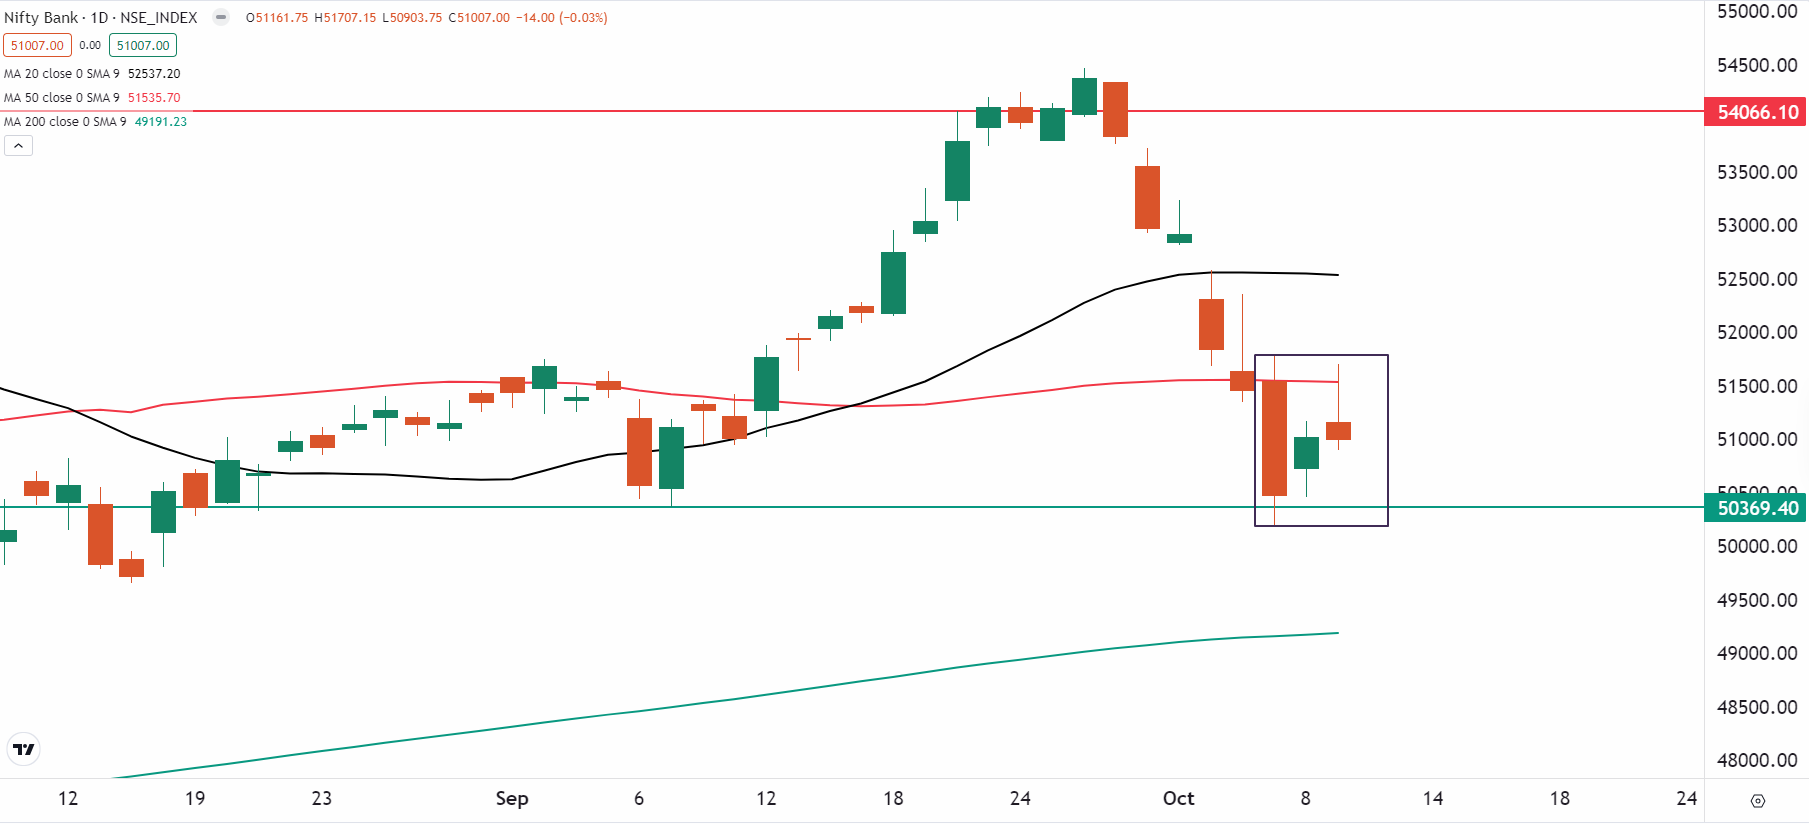
BANK NIFTY index traded in a narrow range on the weekly expiry of its options contracts and faced resistance around its 50-day moving average. The index formed a negative candle on the daily chart and ended the day within the range of 7 October candle.
The technical structure of the BANK NIFTY is forming two crucial structure on the daily charts. The border trend of the index has turned range-bound between its 20 and 200 day moving average. A break of these key levels on closing basis may provide further directional clues.
Secondly, the index also formed a second inside candle on the daily chart and traded within the range of 7 October. In the near-term, a close above or below the 7 October candle may provide directional clues.
FII-DII activity
Stock scanner
Short build-up: ITC
Under F&O ban: Bandhan Bank, Birlasoft, Gujarat Narmada Valley Fertilizers & Chemicals (GNFC), Granules India, Hindustan Copper, IDFC First Bank, Manappuram Finance, Punjab National Bank, RBL Bank, Steel Authority of India and Tata Chemicals
Out of F&O ban: NIL
Added under F&O ban: Tata Chemicals
In Futures and Options or F&O, long build-up means an increase in Open Interest (OI) along with an increase in price, and short build-up means an increase in Open Interest(OI) along with a decrease in price.
Source: Upstox and NSE.
Disclaimer: Derivatives trading must be done only by traders who fully understand the risks associated with them and strictly apply risk mechanisms like stop-losses. The information is only for consumption by the client and such material should not be redistributed. We do not recommend any particular stock, securities and strategies for trading. The securities quoted are exemplary and are not recommendatory. The stock names mentioned in this article are purely for showing how to do analysis. Take your own decision before investing.
About The Author
Next Story


