Market News
Trade Setup for Nov 11: NIFTY50 forms doji on weekly chart, 21 EMA remains resistance
.png)
4 min read | Updated on November 11, 2024, 07:16 IST
SUMMARY
The NIFTY50 extended its consolidation for the second consecutive week, forming a doji candle on the daily chart. The broader structure of the index remains weak, with the index trading below all of its short-term moving averages.
Stock list

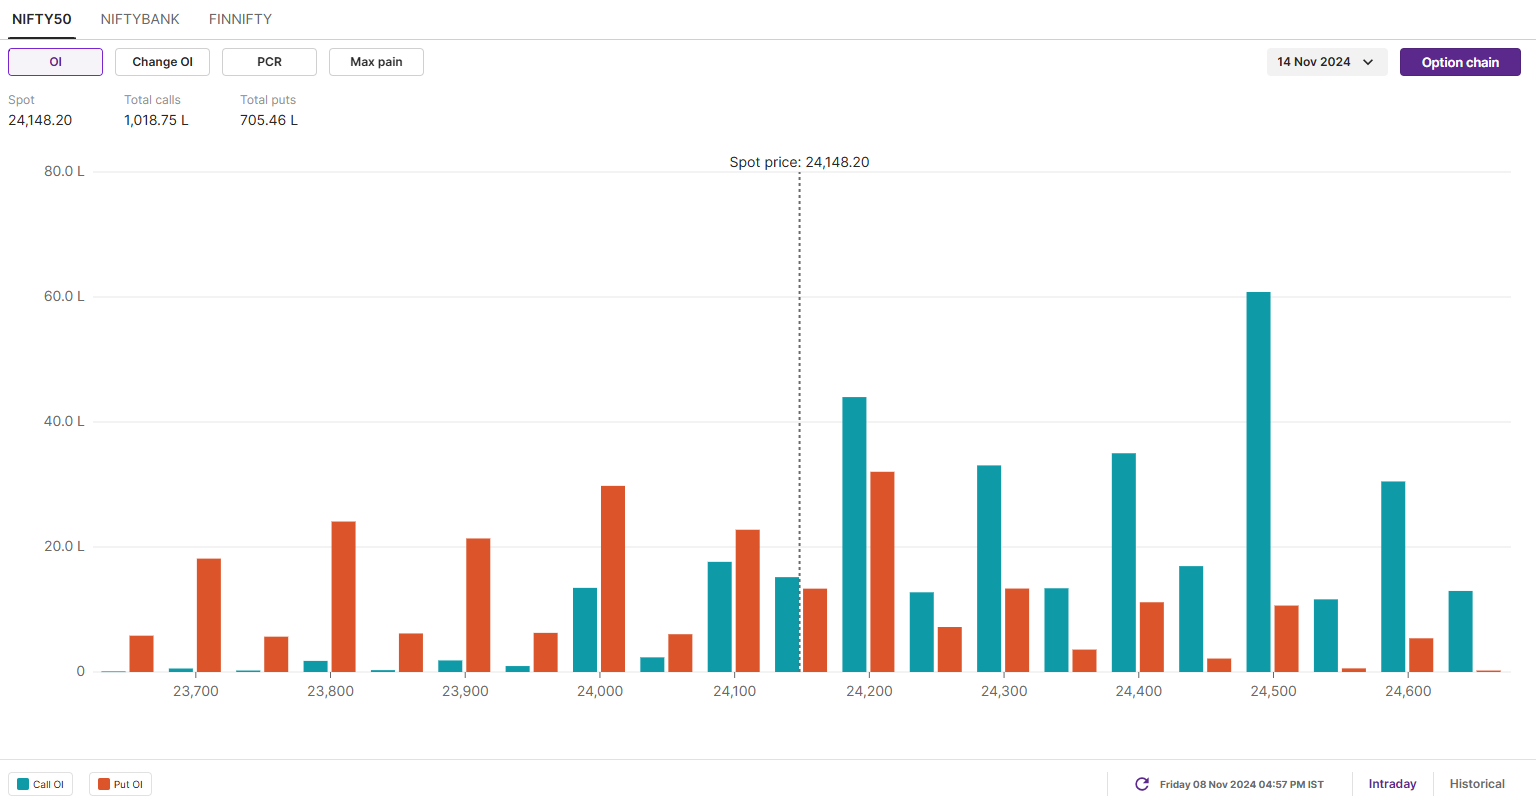
Open interest data for the 14 November expiry shows the highest call base at 24,500, suggesting resistance for NIFTY50 around these levels.
Asian markets @ 7 am
GIFT NIFTY: 24,126.50 (+0.04%) Nikkei 225: 39,422.54 (-0.20%) Hang Seng: Closed
U.S. market update
S&P 500: 5,995 (▲0.3%)
Nasdaq Composite: 19,286 (▲0.0%)
U.S. indices extended their winning momentum for the fourth consecutive day following Donald Trump's victory in the presidential election. All three indices ended the week at record highs, with the Dow and S&P 500 briefly surpassing 44,000 and 6,000, respectively, during intraday trading. Meanwhile, the CBOE Volatility Index fell over 31% last week to 14.9, marking its steepest weekly decline since December 2021.
NIFTY50
- November Futures: 24,219 (▼0.4%)
- Open Interest: 4,52,121 (▼1.2%)
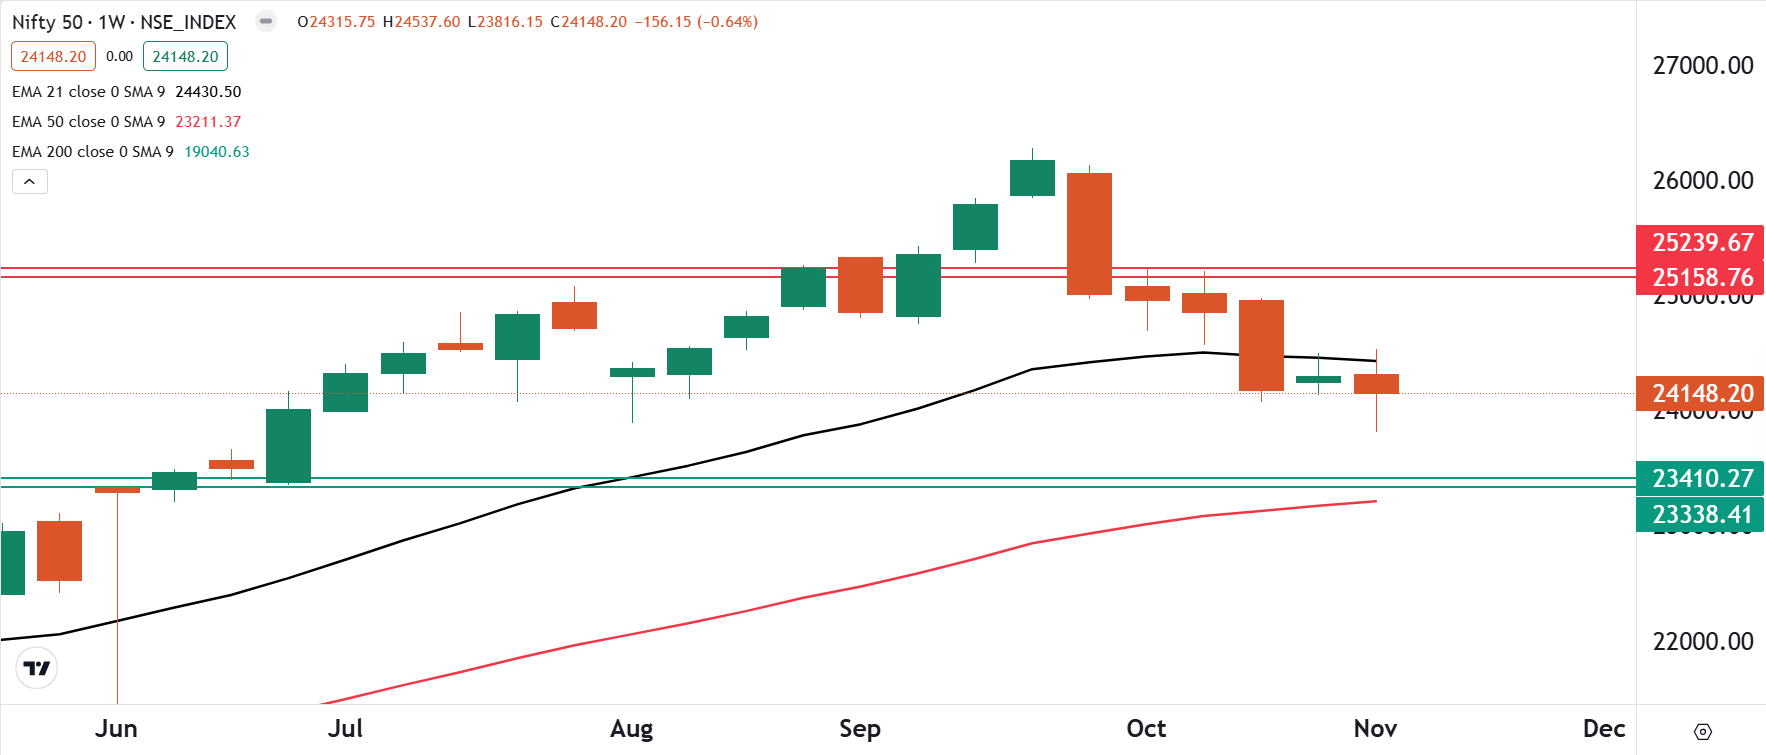
Despite positive global cues, the NIFTY50 index extended its range-bound movement for the second week in a row, forming a doji candlestick pattern, indicating investor indecision.
On the weekly chart, the index traded in a wide range of over 700 points, forming an indecisive candlestick. Positional traders can monitor the previous week's high and low. A close above or below the high or low of the doji will provide traders with further directional clues.
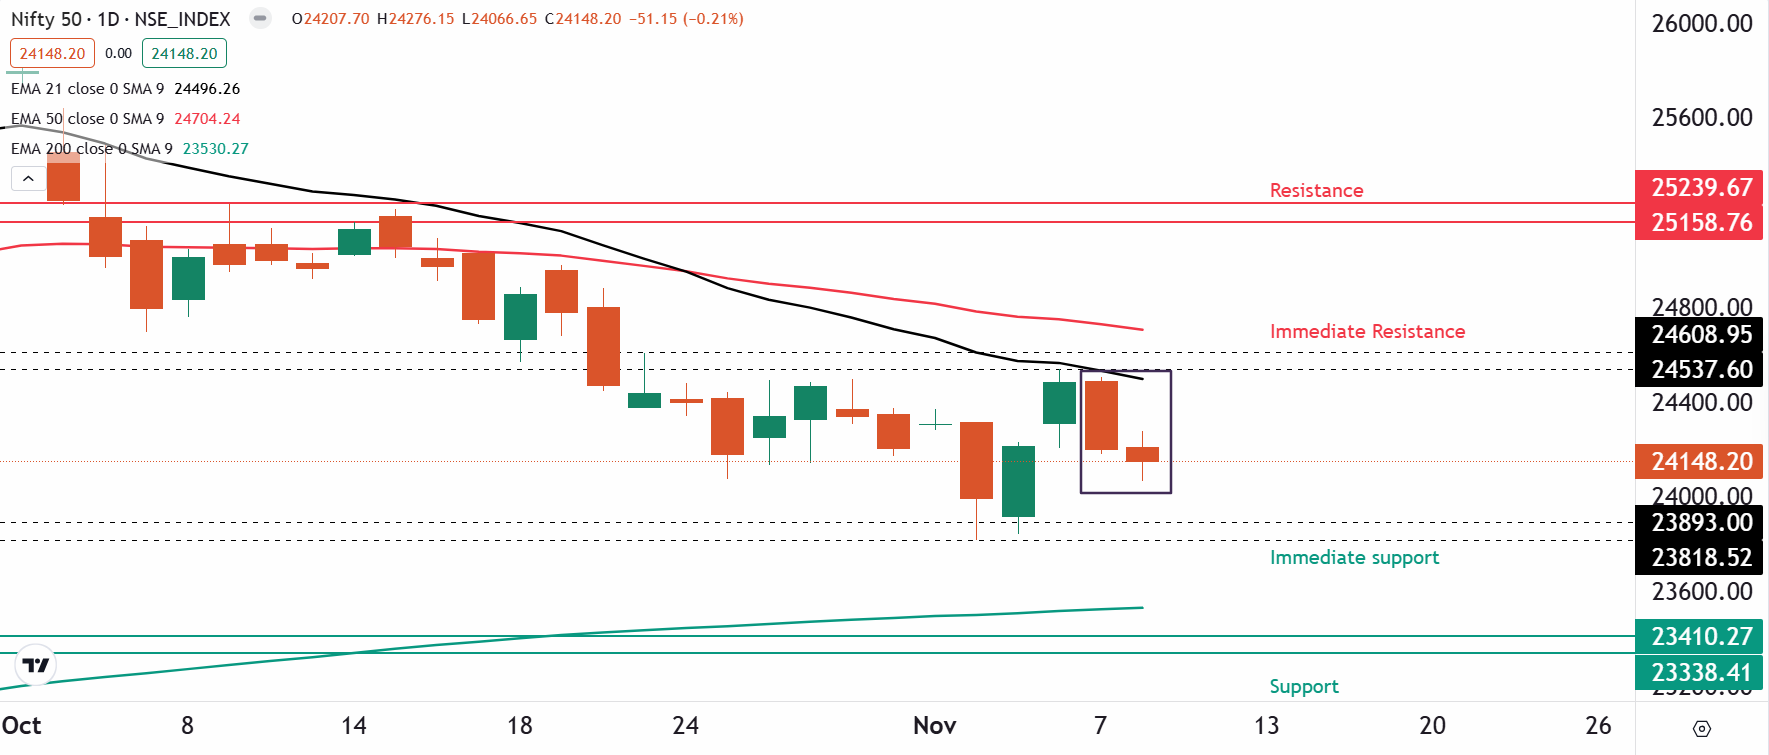
The technical structure on the daily chart remains weak as the index confirmed the bearish engulfing candle formed on the 7th November. The index is currently trading below its 21 and 50 exponential moving averages (EMAs), with immediate resistance at 24,600. On the other hand, a break below 24,800 could extend the weakness to 23,500.
Open interest data for the 14 November expiry shows the highest call base at 24,500, suggesting resistance for the index around these levels. Meanwhile, the put base has been established at 23,000 with relatively low volume. Traders should monitor the change in open interest and the accumulation of new contracts for better directional clues.
BANK NIFTY
- November Futures: 51,788 (▼0.8%)
- Open Interest: 1,76,946 (▲2.6%)
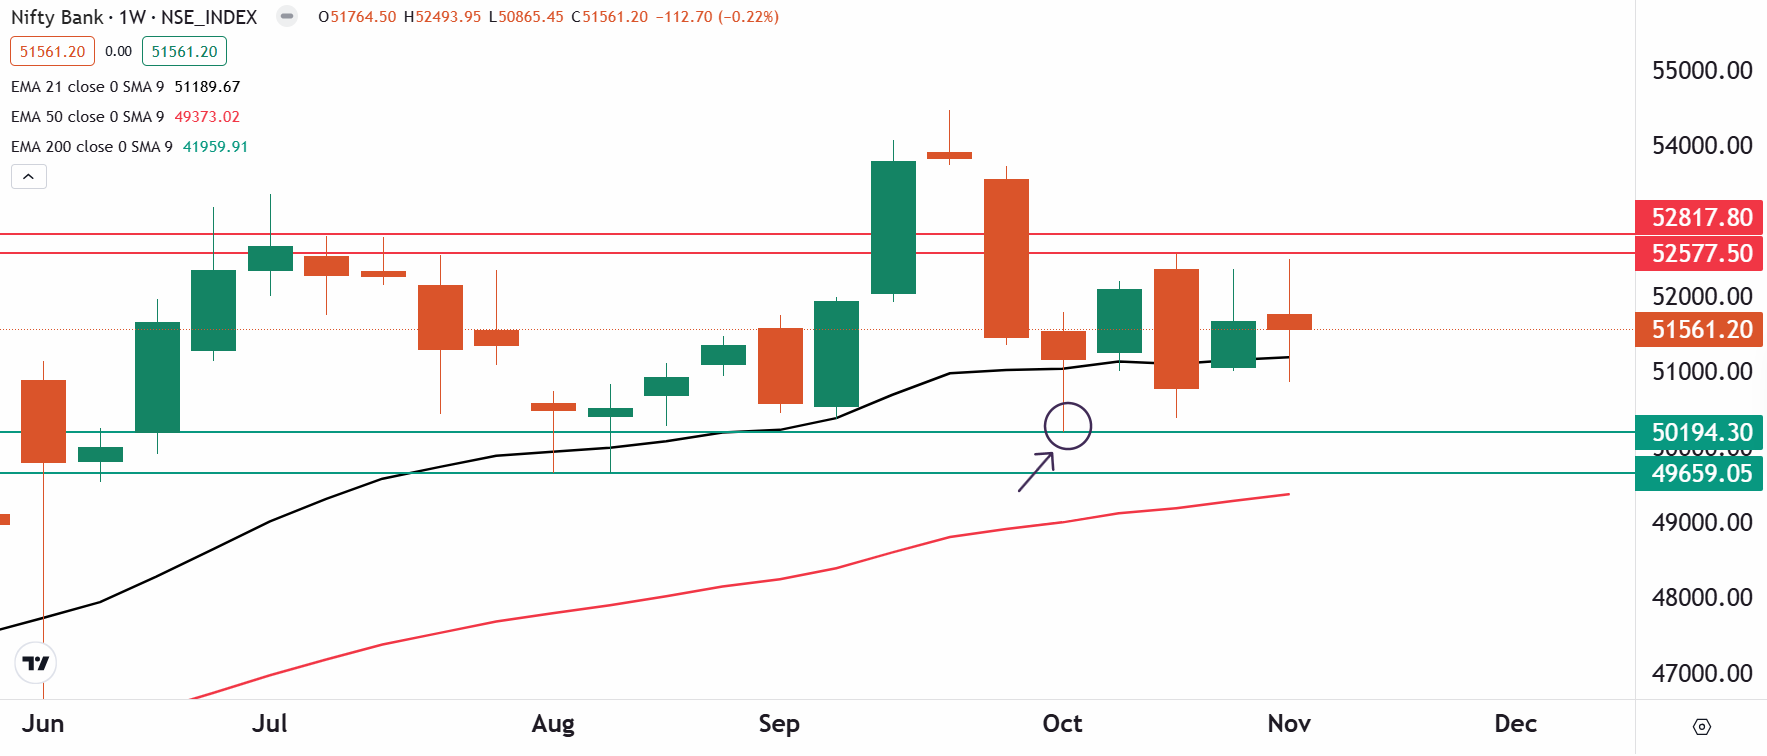
The BANK NIFTY outperformed its benchmark indices, but also formed a doji candlestick pattern on the weekly chart. The index extended its consolidation for the fourth consecutive week and ended the session with small losses.
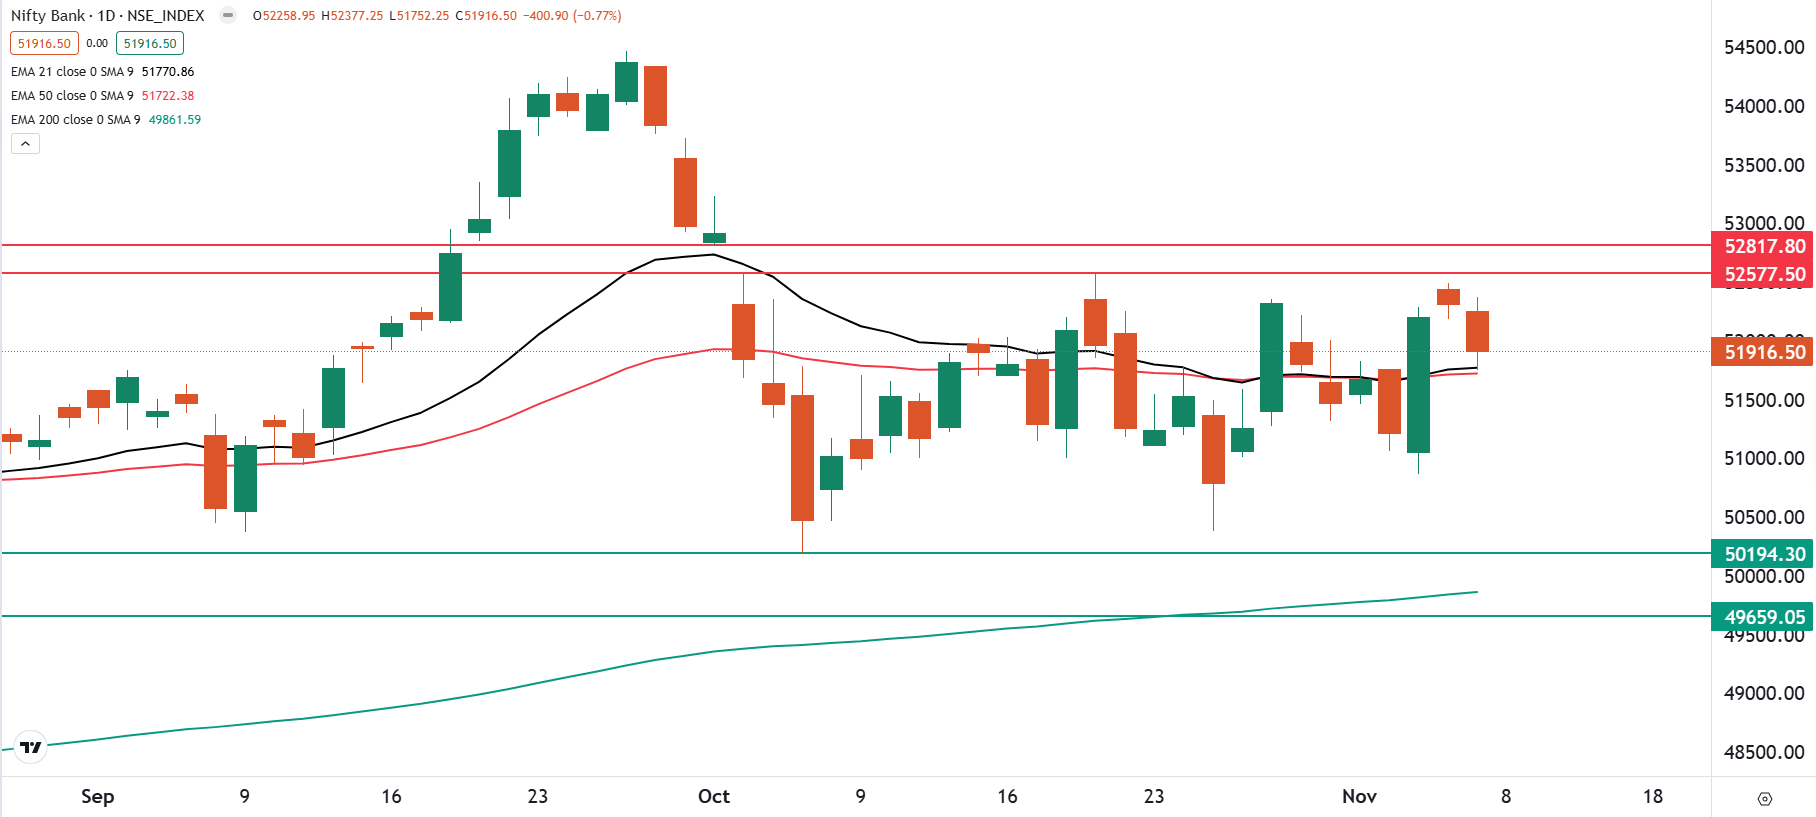
As you can see on the chart below, the BANK NIFTY has been consolidating between 52,800 and 49,600 for the past four weeks. The index is currently protecting the low of the hammer candle (50,200) formed in the week ending 11 October. Weakness will only emerge if the index breaches this low on a closing basis. On the other hand, if it recovers the 52,800 zone on a closing basis, then it could start the journey towards the all-time high.
On the daily chart, the index once again failed to provide the follow-through of bullish engulfing pattern formed on the 5th and closed below the 21 and 50 EMAs, indicating weakness. In addition, a break below the immediate support zone of 51,000 could extend the weakness.
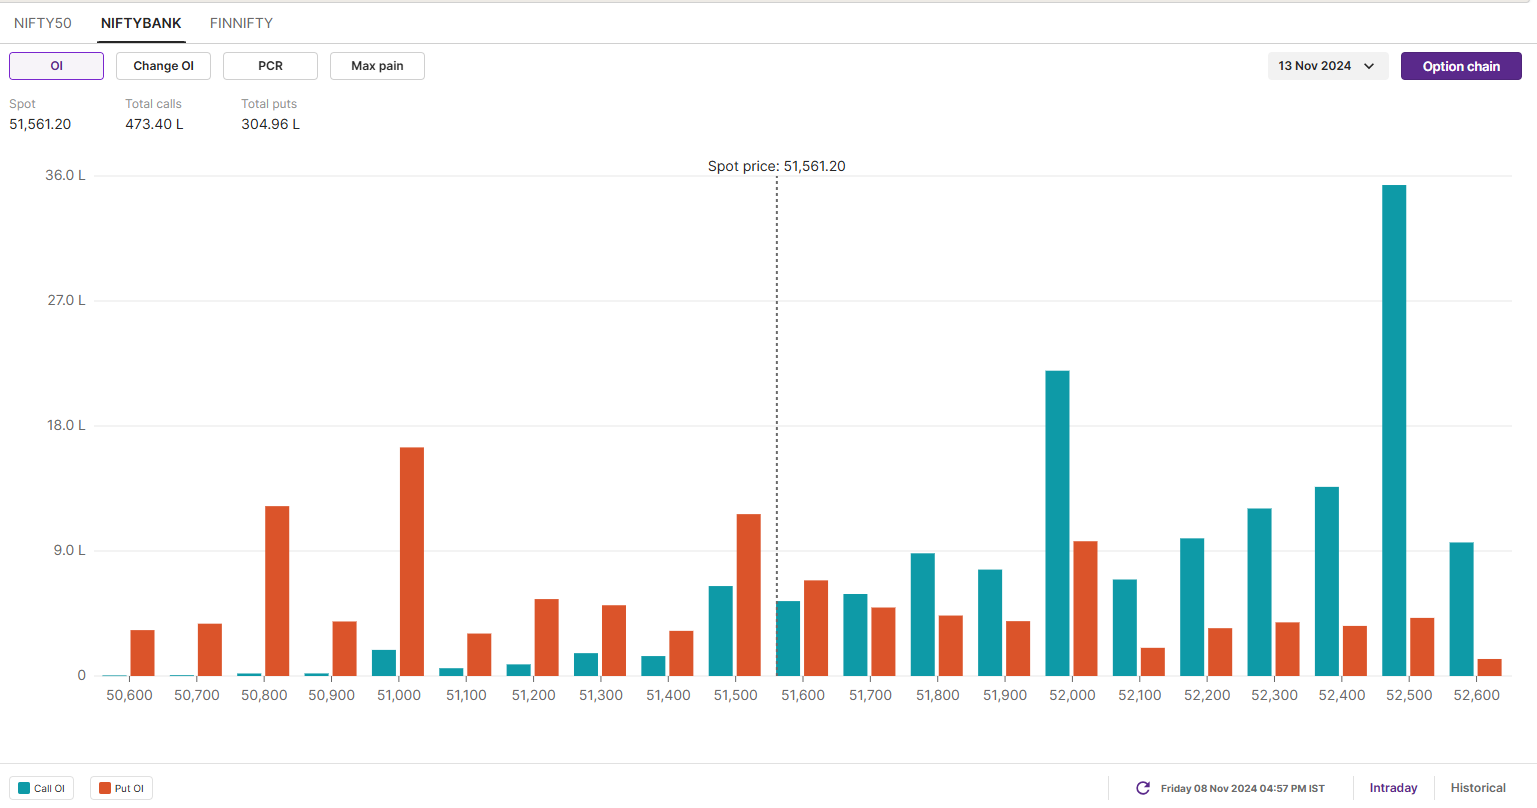
Meanwhile, open interest data for the 13th November expiry showed the highest call accumulation at the 52,500 and 52,000 strikes, suggesting resistance for the index around these zones. Conversely, put bases were seen at 51,000 and 50,000 on relatively light volume.
FII-DII activity
Stock scanner
Long build-up: NIL
Under F&O ban: Aditya Birla Fashion and Retail, Granules India and Manappuram Finance
Added under F&O ban: Manappuram Finance
In Futures and Options or F&O, long build-up means an increase in Open Interest (OI) along with an increase in price, and short build-up means an increase in Open Interest(OI) along with a decrease in price.
Source: Upstox and NSE.
Disclaimer: Derivatives trading must be done only by traders who fully understand the risks associated with them and strictly apply risk mechanisms like stop-losses. The information is only for consumption by the client and such material should not be redistributed. We do not recommend any particular stock, securities and strategies for trading. The securities quoted are exemplary and are not recommendatory. The stock names mentioned in this article are purely for showing how to do analysis. Take your own decision before investing.
About The Author
Next Story

