Market News
Trade setup for March 24: NIFTY50 targets 200 EMA, key support emerges around 23,000
.png)
4 min read | Updated on March 24, 2025, 07:14 IST


SUMMARY
The NIFTY50 index rallied over 1,000 points last week and regained its key 21-day and 50-day exponential moving averages. After a strong rebound of over 4%, experts believe that the index could consolidate its gains with immediate support around the 23,000 level. A decisive close above the key resistance zone at 23,600 will fuel further upside momentum.
Stock list

The NIFTY50 extended the bullish momentum throughout the week and reclaimed crucial 21-day and 50-day exponential averages after nearly a month. | Image: Shutterstock
Asian markets @ 7 am
- GIFT NIFTY:
- Nikkei 225:
- Hang Seng:
U.S. market update
- Dow Jones: 41,985 (▲0.0%)
- S&P 500: 5,667 (▲0.0%)
- Nasdaq Composite: 17,784 (▲0.5%)
U.S. indices erased their opening losses on Friday, ending with modest gains after former President Donald Trump suggested that the trade tariffs set to begin in April might not be as severe as feared. He also stated that officials would engage with their Chinese counterparts and that he plans to use tariffs as a tool to reduce the U.S. trade deficit with China.
Meanwhile, the S&P 500 and Nasdaq Composite broke their four-week losing streaks, posting weekly gains of 0.5% and 0.1%, respectively. This rebound followed the U.S. Federal Reserve’s decision to keep interest rates unchanged and signal the likelihood of two rate cuts this year.
NIFTY50
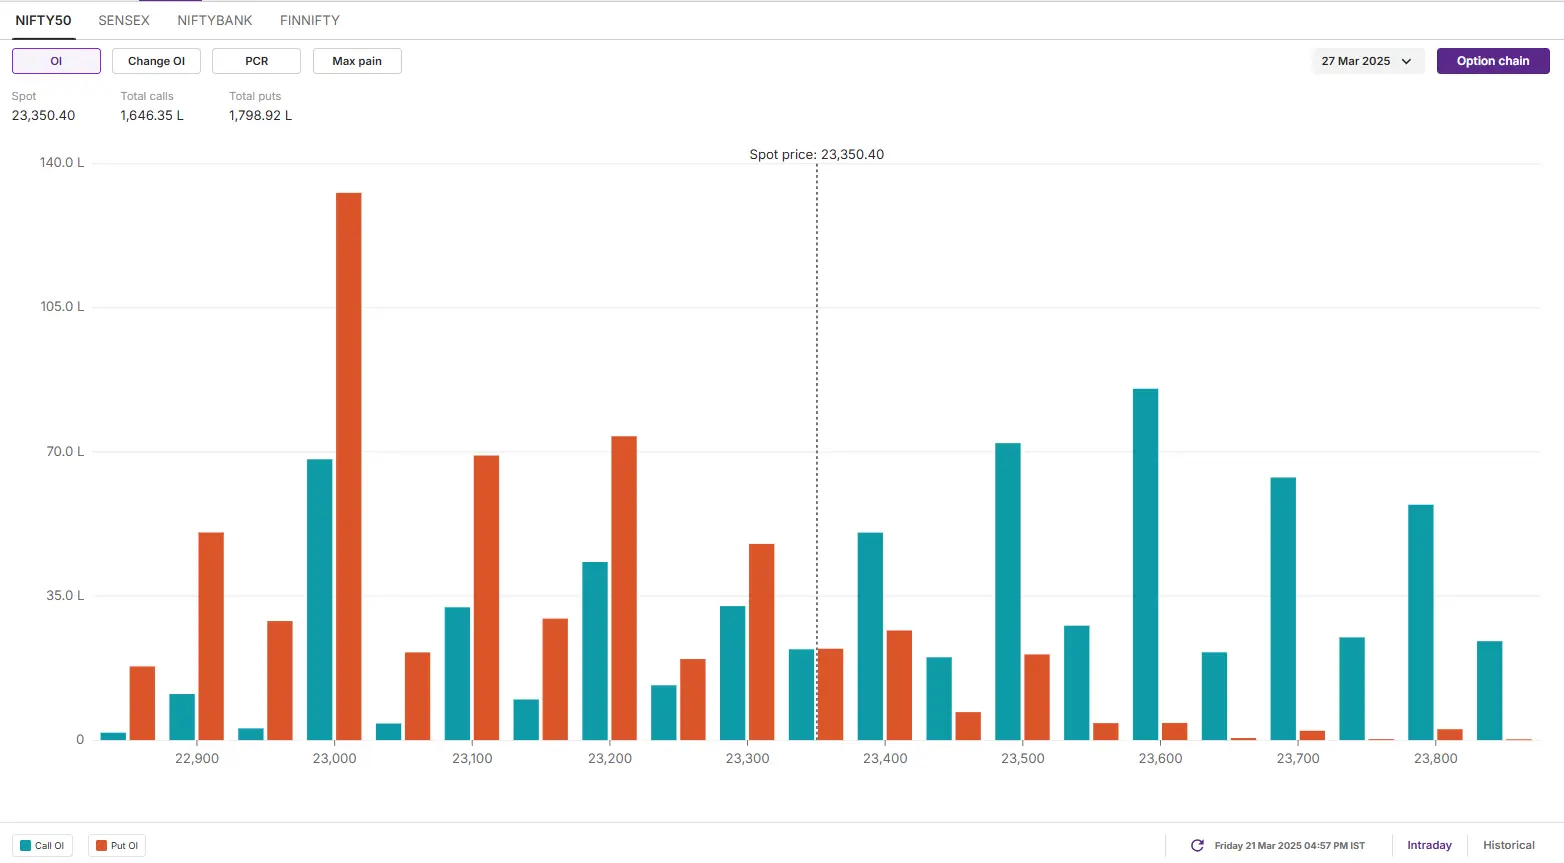
- Max call OI: 23,600
- Max put OI: 23,000
- (10 Strikes from ATM, Expiry: 27 March)
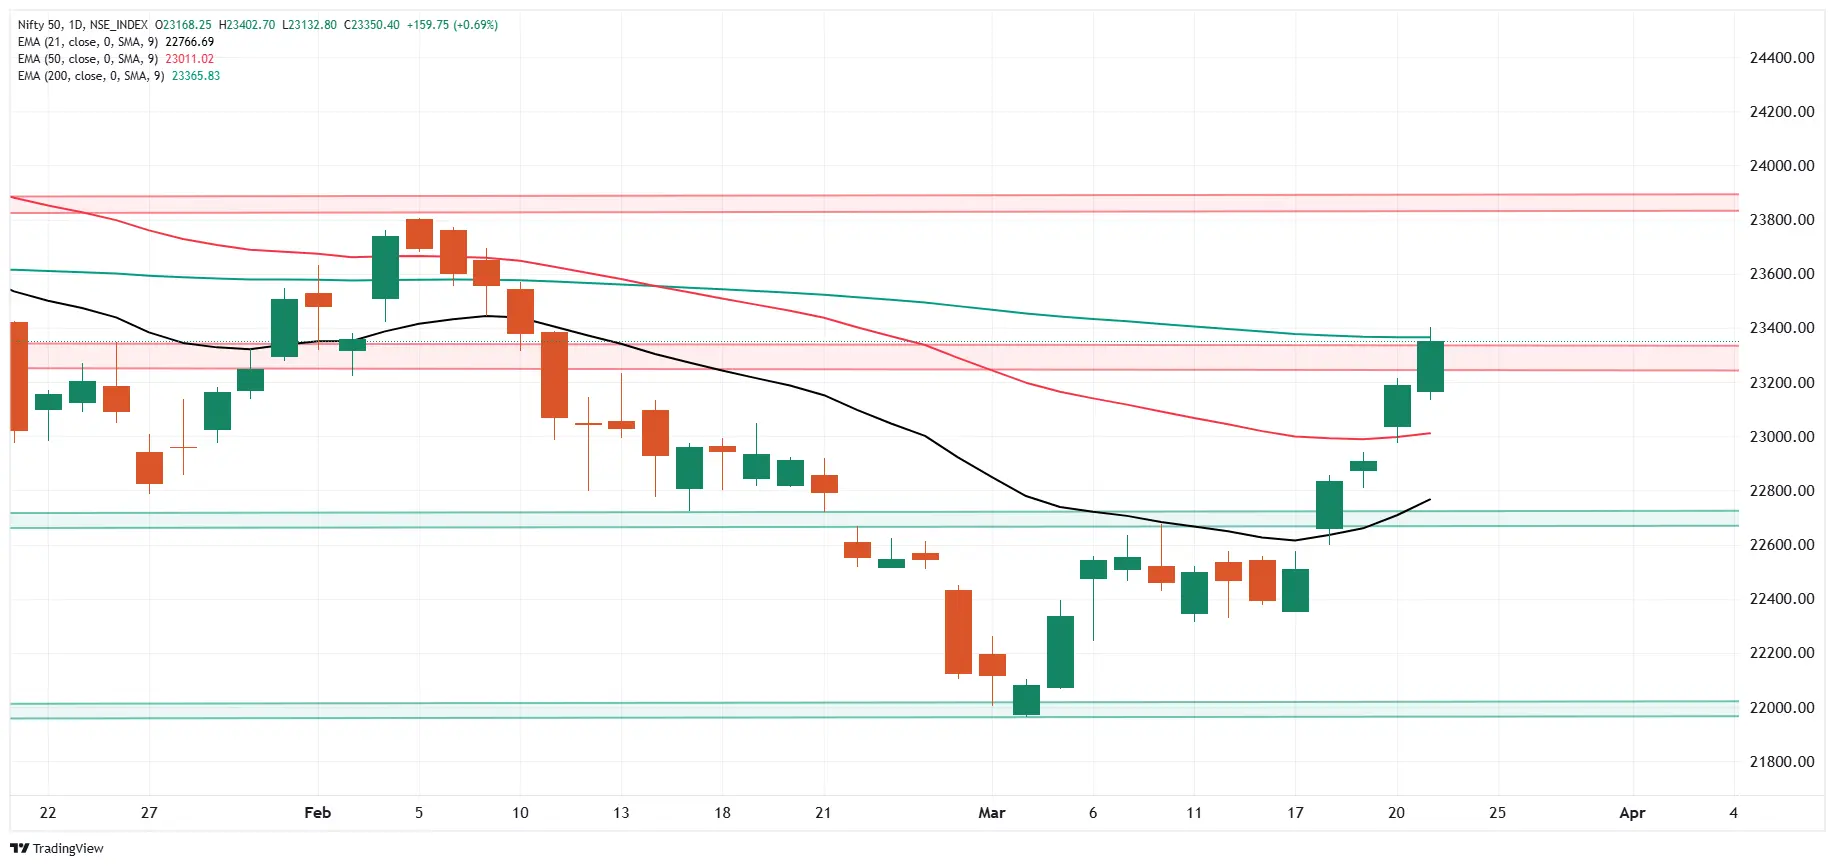
The NIFTY50 extended the bullish momentum throughout the week and reclaimed crucial 21-day and 50-day exponential averages after nearly a month. This comes after Foreign Institutional Investors (FIIs) turned net buyers last week, fall in the U.S. dollar index and weakening of India VIX.
The technical structure of the index as per daily chart remains bullish as the index tested its 200-day EMA around 23,350 zone. With short-term momentum remaining bullish, the immediate support for the index remains around 50-day EMA (around 23,000). Conversely, resistance of the index is around 23,800 zone.
Experts believe that after last week’s sharp momentum, the index may consolidate between 23,000 and 23,600 zone. A breakout out from this range will provide further directional clues.
The open interest data for the March 27 expiry saw significant put options base at 23,000 strike, suggesting support for the index around this zone. On the flip side, the call options base was seen at 23,600 strike with relatively low volume. This suggests that index may face resistance around this strike.
SENSEX
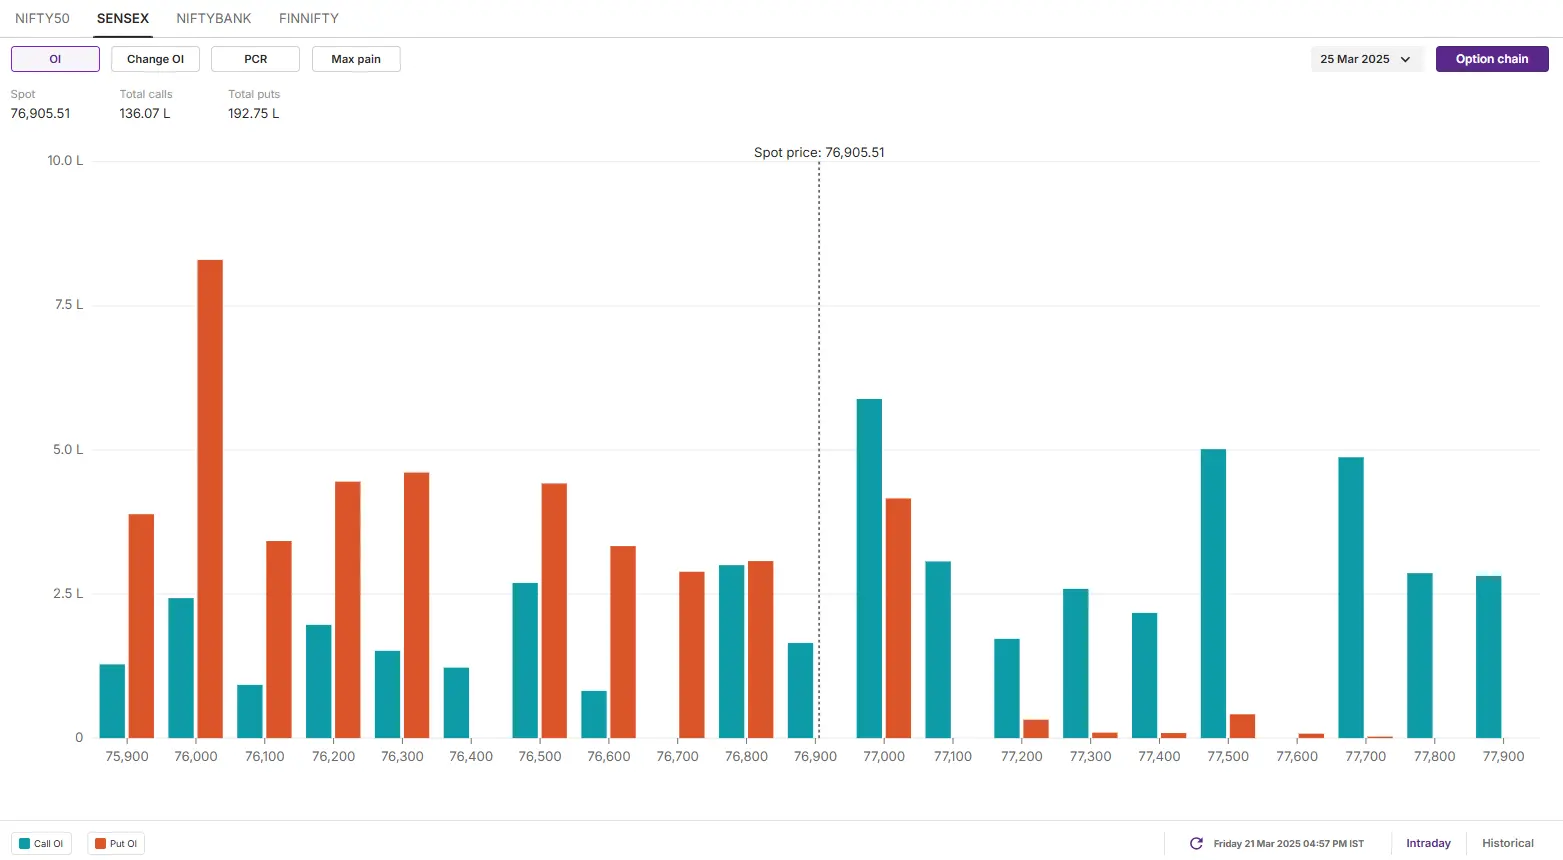
- Max call OI: 77,000
- Max put OI: 76,000
- (10 Strikes from ATM, Expiry: 25 March)
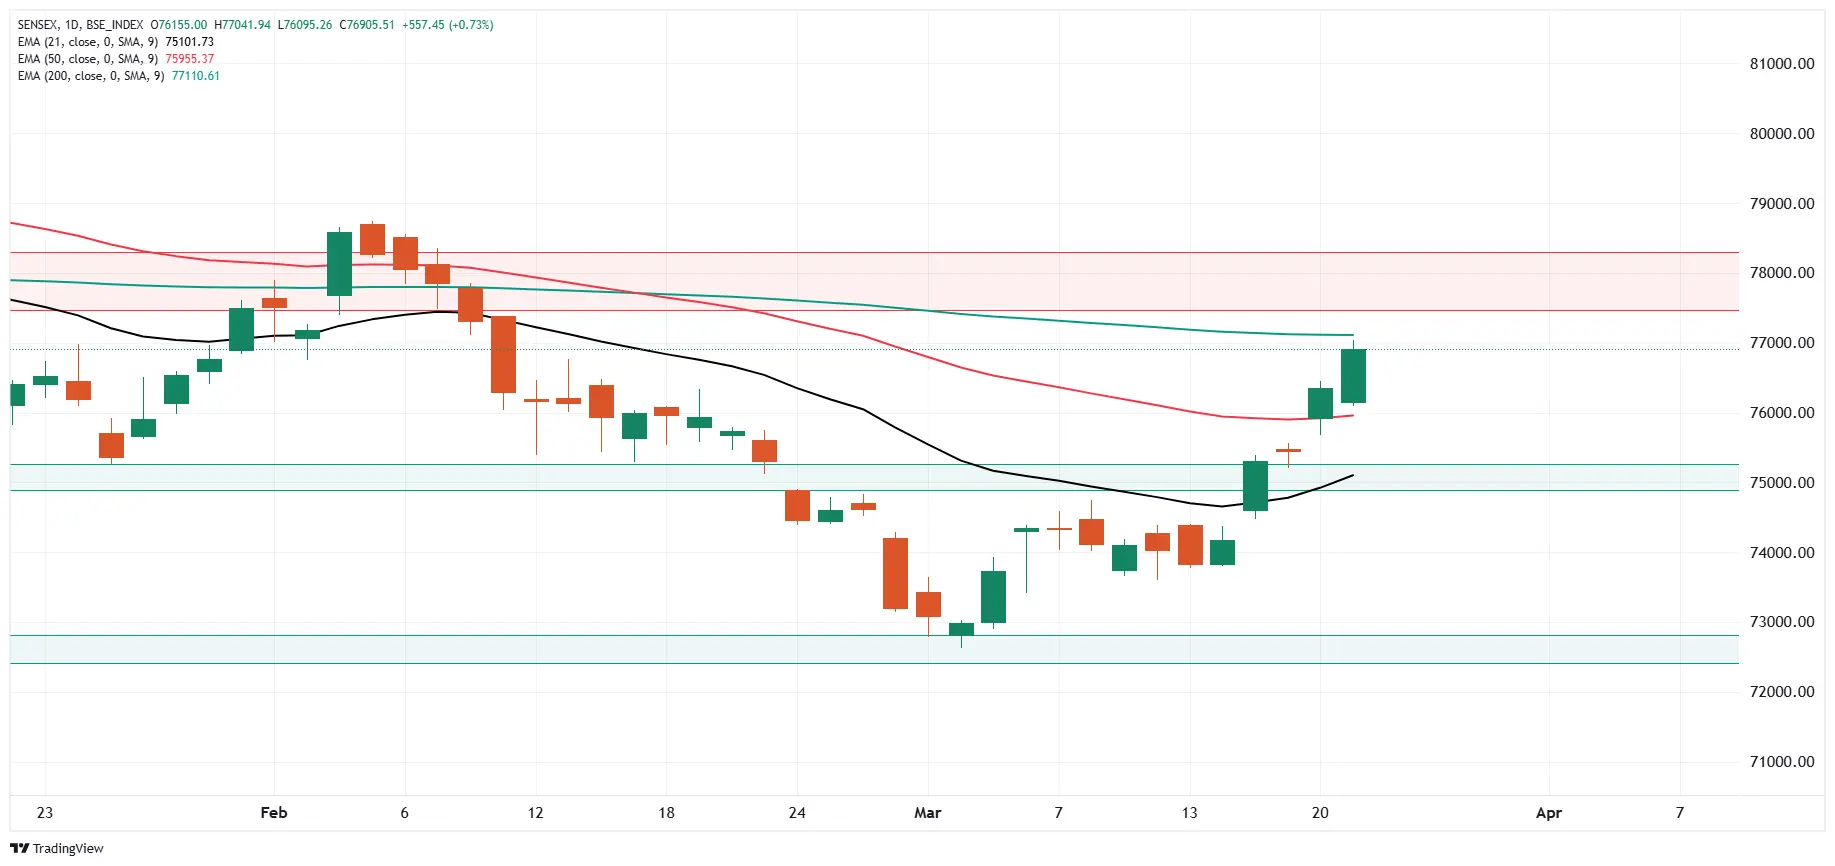
The SENSEX surged over 4% last week and closed above the high of the previous four weeks, forming a bullish candle on the weekly chart. Additionally, the index also reclaimed its 21-day and 50-day EMAs on the daily chart, indicating bullish momentum.
After a sharp upside momentum, traders can monitor the price action of SENSEX between 75,000 and 78,000 zone. Within this zone, the index may remain rangebound and a breakout of this range will provide further directional insights.
The positioning of the open interest data for the 25 March expiry showed a significant put options base at the 76,000 strike, indicating support for the index around this zone. On the other hand, call option bases were observed at 77,000 and 77,500, but with relatively lower volume.
FII-DII activity
Stock scanner
- Long build-up: BSE, Adani Green, NTPC, Max Healthcare and Indian Oil Corporation
- Short build-up: National Aluminium, Jindal Stainless and Voltas
- Top traded futures contracts: ICICI Bank, Bajaj Finance, HDFC Bank, Reliance Industries and Kotak Mahindra Bank
- Top traded options contracts: Bajaj Finance 9,000 CE, BSE 4,700 CE, HAL 3,900 CE, INFY 1,600 CE and TCS 3,600 CE
- Under F&O ban: Hindustan Copper, IndusInd Bank and Polycab
- Out of F&O ban: Manappuram Finance and Steel Authority of India
In Futures and Options or F&O, long build-up means an increase in Open Interest (OI) along with an increase in price, and short build-up means an increase in Open Interest(OI) along with a decrease in price. Source: Upstox and NSE.
Disclaimer: Derivatives trading must be done only by traders who fully understand the risks associated with them and strictly apply risk mechanisms like stop-losses. The information is only for consumption by the client and such material should not be redistributed. We do not recommend any particular stock, securities and strategies for trading. The securities quoted are exemplary and are not recommendatory. The stock names mentioned in this article are purely for showing how to do analysis. Take your own decision before investing.
About The Author
Next Story


