Market News
Trade setup for March 20: NIFTY50 nears 50 EMA resistance, can it break the falling trendline?
.png)
5 min read | Updated on March 20, 2025, 07:17 IST


SUMMARY
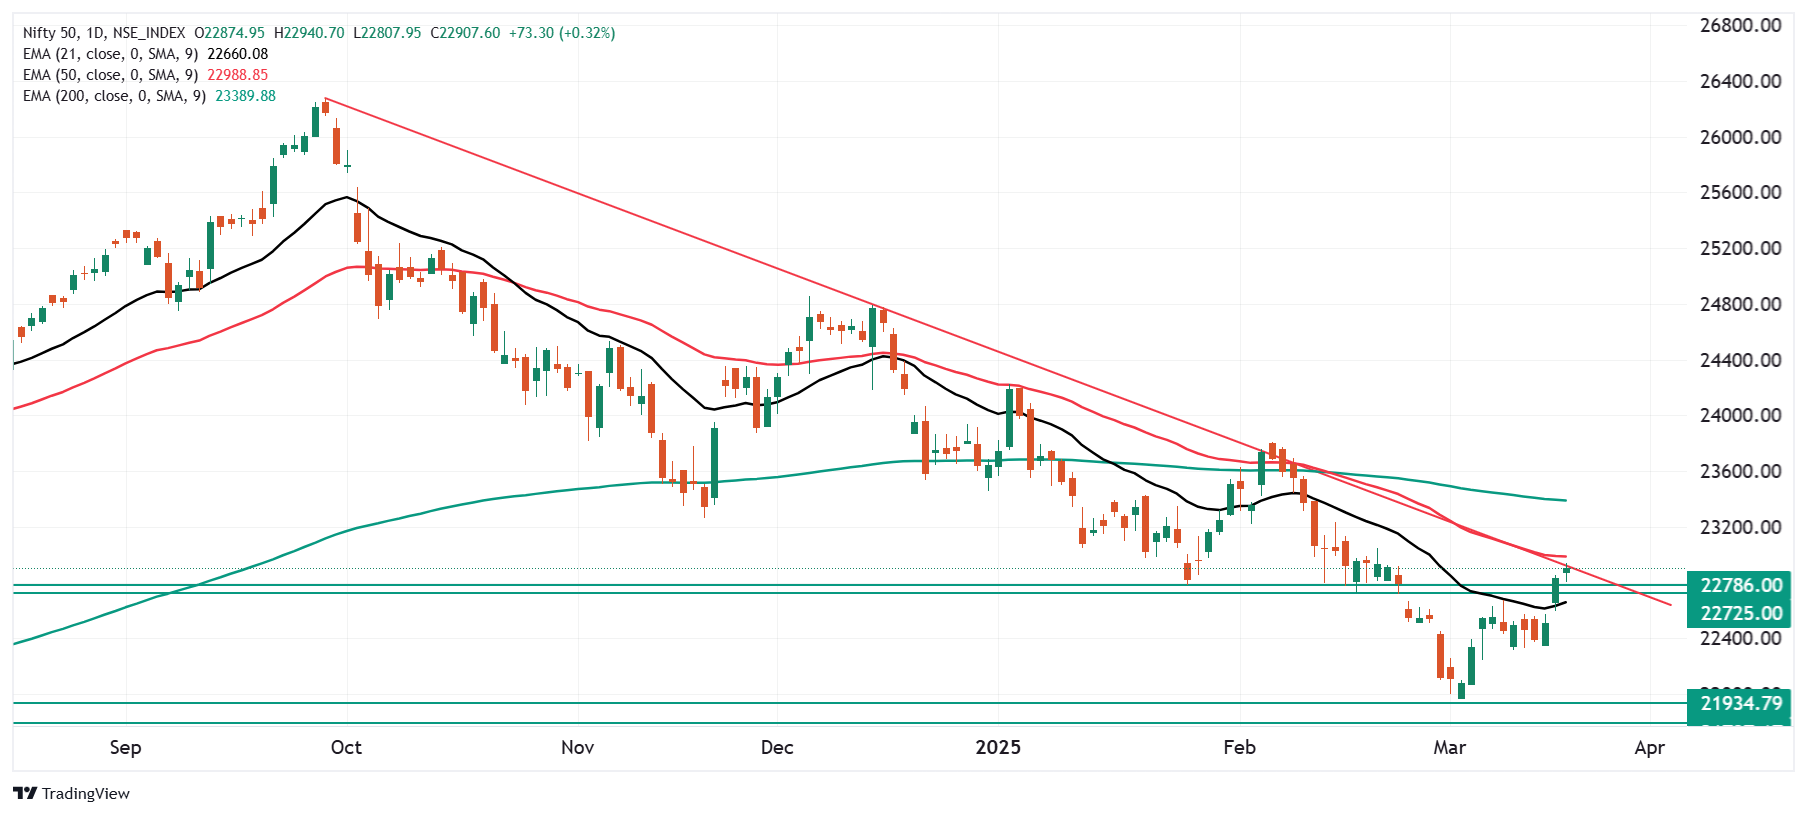
The NIFTY50 index sustained its bullish momentum and is approaching the resistance zone of 50-day EMA and falling trendline connecting highs of September and December 2024. A decisive close above the 50-day EMA and a falling trendline can push the prices around the 200-day EMA. Meanwhile, the immediate support for the index is around the 22,700 zone.
Stock list

The NIFTY50 index continued its upward momentum for the third straight session on March 19. | Image: Shutterstock
Asian markets @ 7 am
- GIFT NIFTY: 23,061 (+0.31%)
- Nikkei 225: Closed
- Hang Seng: 24,753 (-0.07%)
U.S. market update
- Dow Jones: 41,964 (▲0.9%)
- S&P 500: 5,675 (▲1.0%)
- Nasdaq Composite: 17,750 (▲1.4%)
U.S. indices surged on Wednesday after the Federal Reserve reaffirmed its plan for two interest rate cuts in 2025. As expected, the central bank kept the federal funds rate steady at 4.25%-4.5%. However, the Fed acknowledged growing economic uncertainty and a slowdown in consumer spending and warned that tariffs could push up prices.
Meanwhile, the Fed lowered its economic growth forecast and raised its inflation forecast. Officials now expect GDP to grow 1.7% in 2025, down 0.4% from the December estimate. Core inflation is expected to rise 2.8% annually, up 0.3 percentage points from the previous forecast.
NIFTY50
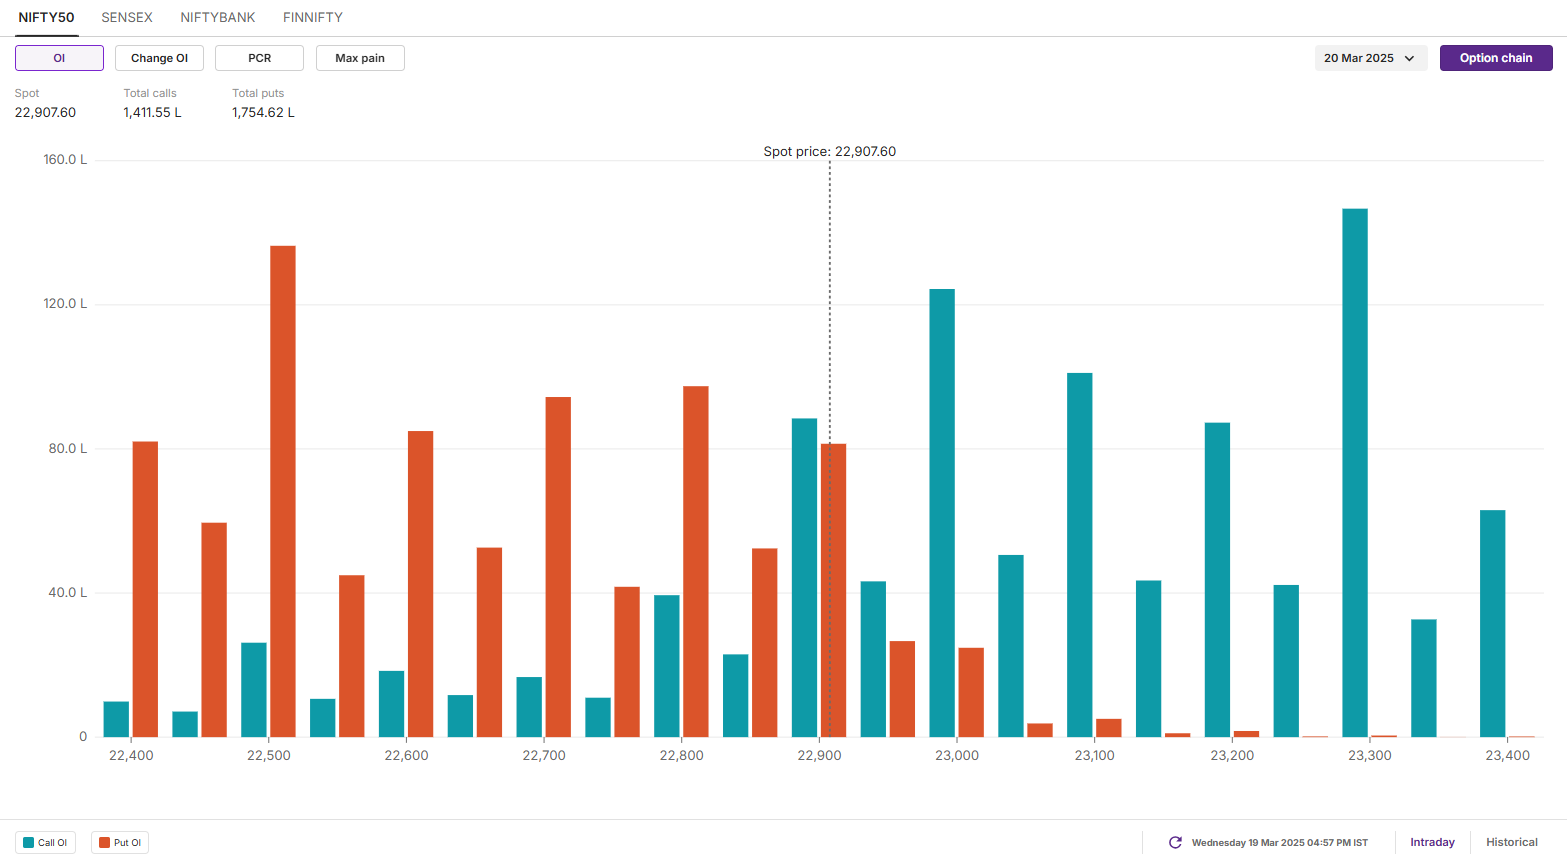
- Max call OI: 23,300
- Max put OI: 22,500
- (10 Strikes from ATM, Expiry: 20 March)
The NIFTY50 index continued its upward momentum for the third straight session on March 19, sustaining above the crucial resistance zone of 22,700 and 22,800 zone on a closing basis. Additionally, the market breadth remained strong, with a strong rebound in the broader markets.
The technical structure of the index has per the daily chart remains bullish in the short-term as it sustains above the immediate support zone of 21-day exponential moving average (EMA).
However, it is important to note that the index is approaching a key resistance zone at 23,000-23,100, marked by a downsloping trendline from the September and December 2024 highs. A break above this zone and 50-EMA on a closing basis will signal continuation of the bullish rebound. Meanwhile, a rejection from this zone will signal a pause and consolidation.
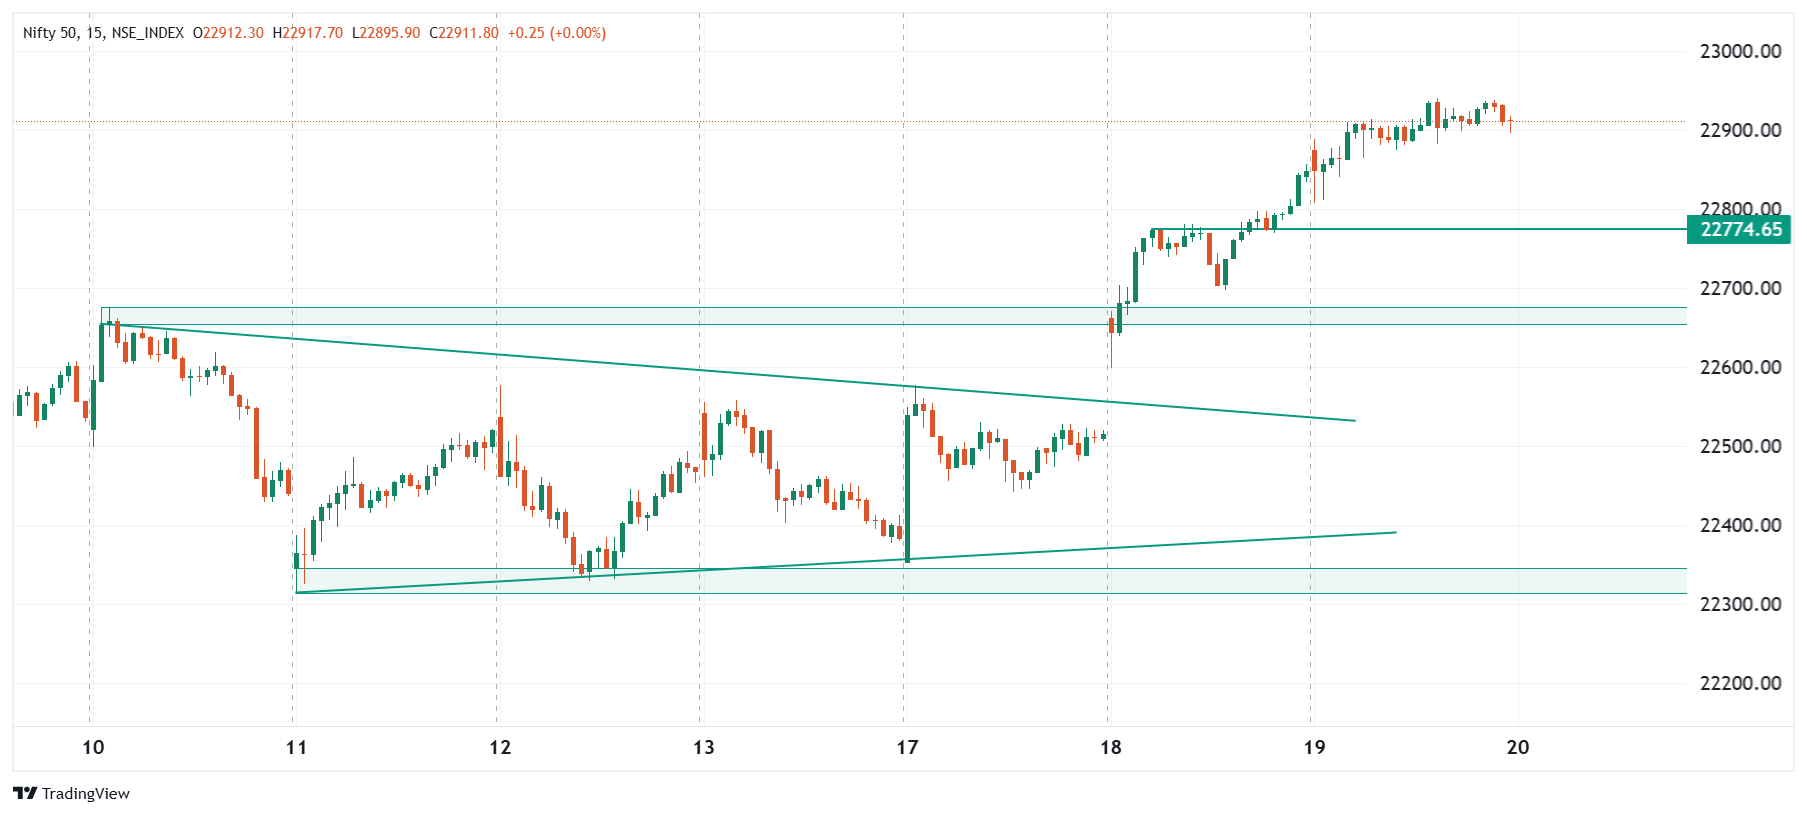
The index remains bullish on the 15-minute timeframe following its breakout from a symmetrical triangle on March 18. It has rallied nearly 2% and is now consolidating near the key resistance zone at 23,000. A decisive close above this level with a strong 15-minute candle could drive prices higher. Conversely, immediate support for the expiry is around 22,700.
Open interest (OI) data for the March 20 expiry shows a shift in the call OI base from the 23,000 to the 23,300 strike, suggesting resistance at both levels. On the other hand, the put options base was remains at 22,500 strike, suggesting support for the index around this zone.
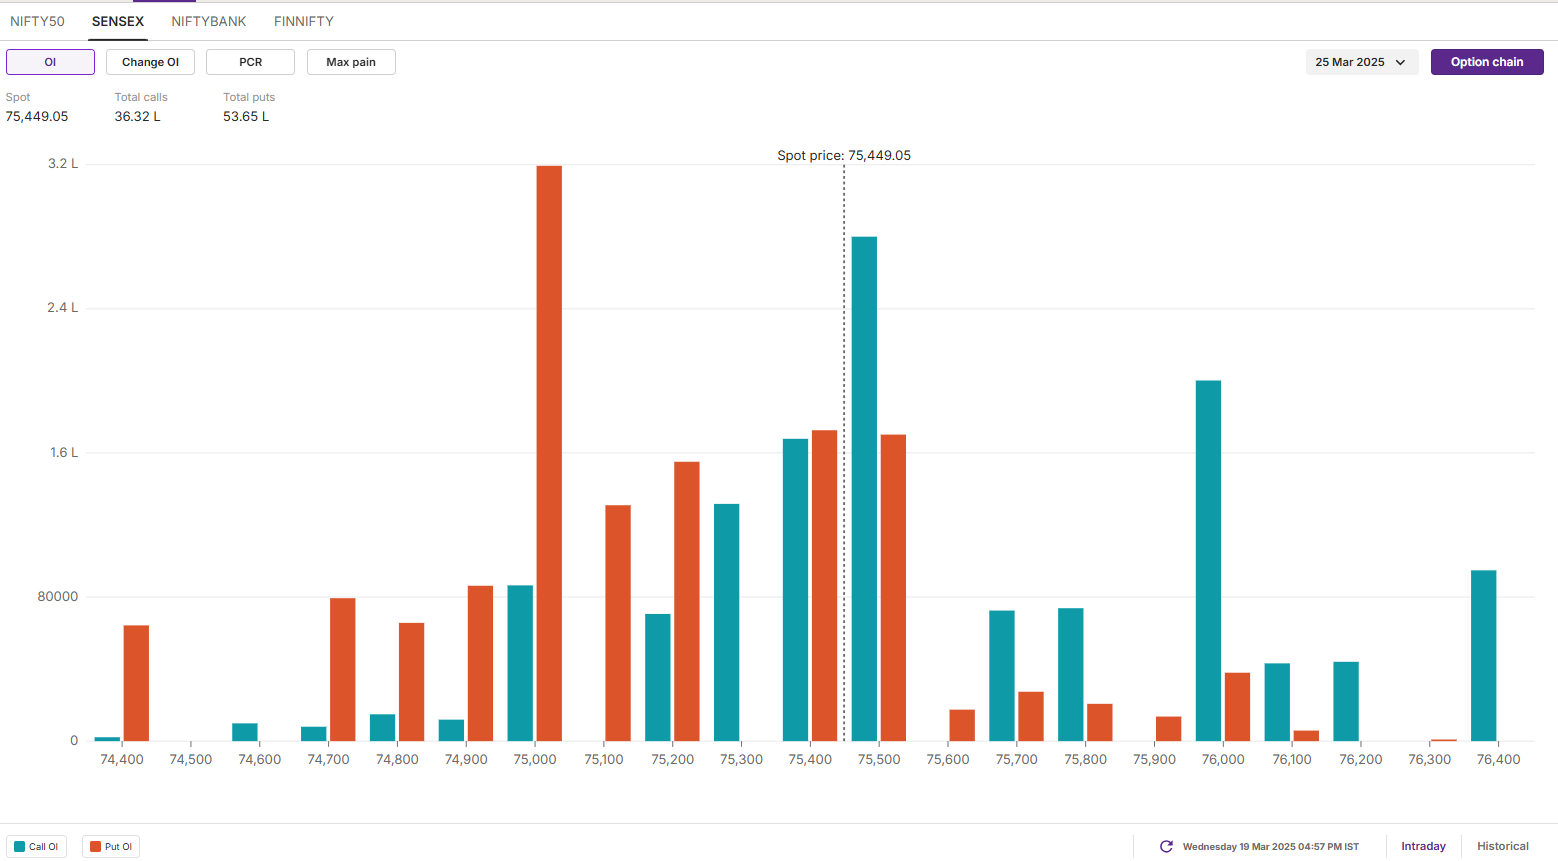
SENSEX
- Max call OI: 76,500
- Max put OI: 75,500
- (15 Strikes from ATM, Expiry: 25 March)
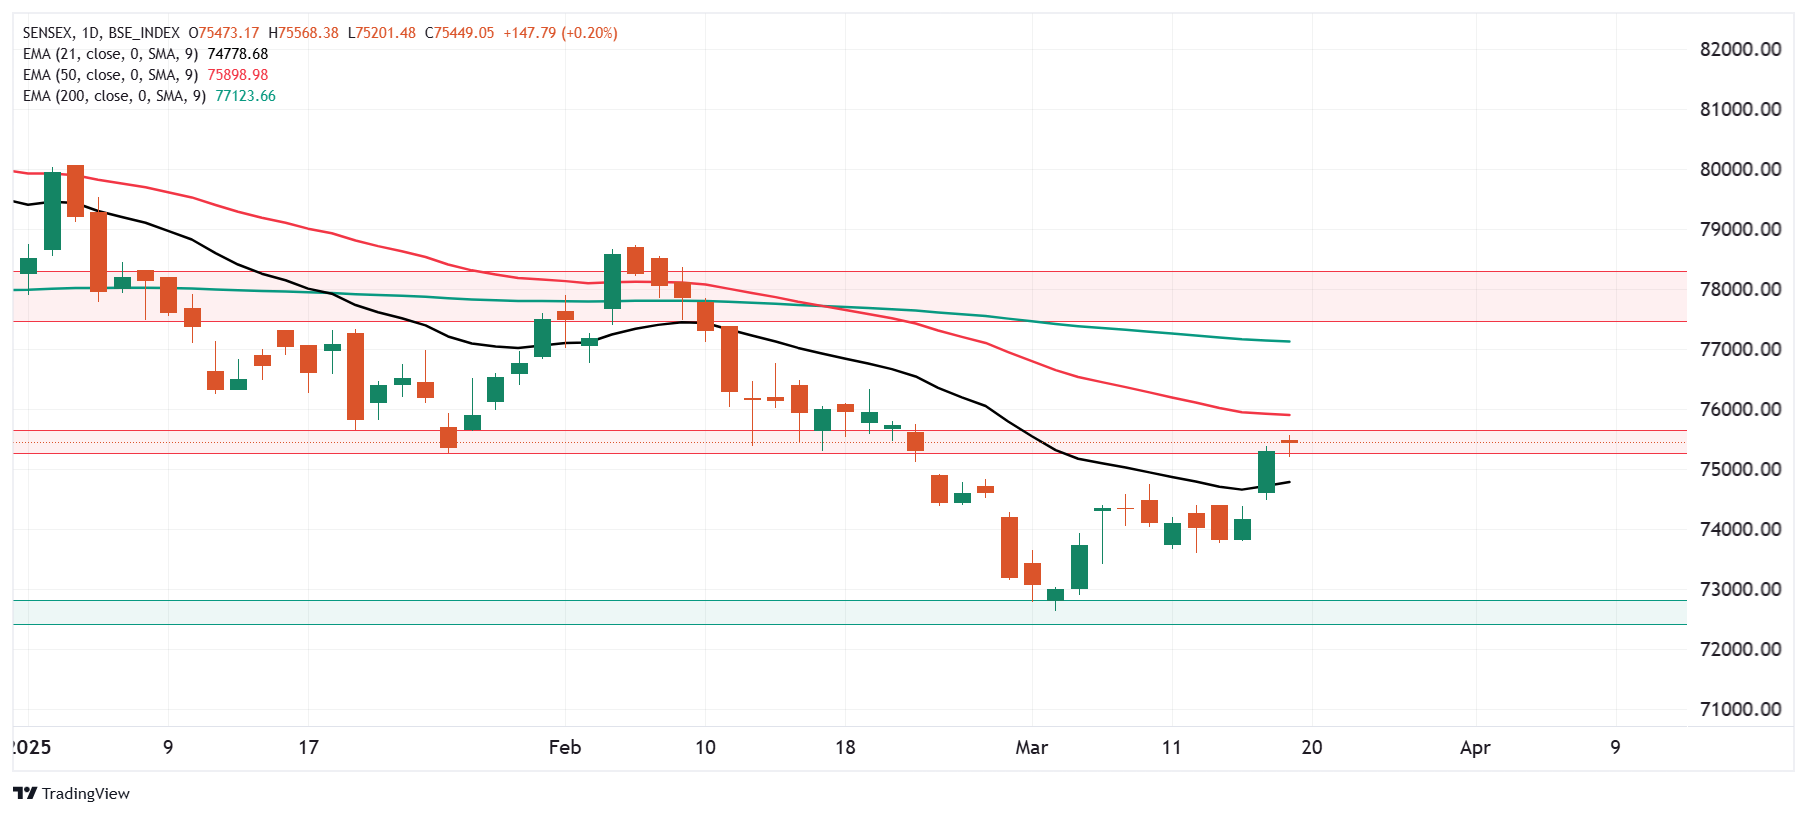
The SENSEX sustained its positive momentum for the third straight day and sustained above the immediate support zone of 21-day EMA. The index is currently placed around the immediate resistance zone of 50-day EMA and 75,600 zone.
In the upcoming sessions, traders can monitor the price action of the index around the 50-day EMA. A close above this zone will signal continuation of the bullish momentum. On the flip side, the immediate support for the index around is around 21-day EMA (around 74,700 zone).
The open interest (OI) data for the March 25 expiry saw significant put OI base at 75,000 strike, pointing support for the index around this zone. Conversely, the call base was seen at 76,500 strike, suggesting resistance for the index around this strike.
FII-DII activity
Stock scanner
- Long build-up: Computer Age Management Services, CDSL, Shriram Finance, NBCC and L&T Finance
- Short build-up: Phoenix Group, Tech Mahindra and LTIMindtree
- Top traded futures contracts: HDFC Bank, ICICI Bank, Bajaj Finance, Reliance Industries and State Bank of India
- Top traded options contracts: Indigo 5,000 CE, Bajaj Finance 8,800 CE, HAL 3,700 CE, Zomato 225 CE and HAL 3,600 CE
- Under F&O ban: Hindustan Copper, IndusInd Bank and Steel Authority of India
- Out of F&O ban: BSE and Manappuram Finance
In Futures and Options or F&O, long build-up means an increase in Open Interest (OI) along with an increase in price, and short build-up means an increase in Open Interest(OI) along with a decrease in price. Source: Upstox and NSE.
Disclaimer: Derivatives trading must be done only by traders who fully understand the risks associated with them and strictly apply risk mechanisms like stop-losses. The information is only for consumption by the client and such material should not be redistributed. We do not recommend any particular stock, securities and strategies for trading. The securities quoted are exemplary and are not recommendatory. The stock names mentioned in this article are purely for showing how to do analysis. Take your own decision before investing.
About The Author
Next Story


