Market News
Trade setup for March 17: NIFTY50 struggles to reclaim 21 EMA resistance, hovers near 22,500
.png)
4 min read | Updated on March 17, 2025, 07:23 IST


SUMMARY
The NIFTY50 index traded in a narrow range and consolidating around the 22,500 mark. Despite weak global cues, the index protected its immediate support zone of 22,300 on a closing basis. However, the index failed to reclaim the crucial resistance zone of 21-day exponential moving average and faced resistance at higher levels.
Stock list

The NIFTY50 index traded in a narrow range on the weekly expiry day and closed lower. | Image: Shutterstock
Asian markets @ 7 am
- GIFT NIFTY: 22,576.50 (+0.70%)
- Nikkei 225: 37,489.93 (+1.18%)
- Hang Seng: 24,222 (+1.10%)
U.S. market update
- Dow Jones: 41,488 (▲1.6%)
- S&P 500: 5,638 (▲2.1%)
- Nasdaq Composite: 17,754 (▲2.6%)
U.S. indices rebounded on Friday, clawing back some of the steep losses of the week as the risk of a government shutdown eased. Additionally, the investors got a reprieve from tariff related headlines from the White House.
However, the data of consumer confidence released on Friday dropped to 57.9, lower than the street estimate of 63.2. The data released reflected that the consumer confidence sentiment suffered from the ongoing tariff-related uncertainty.
NIFTY50
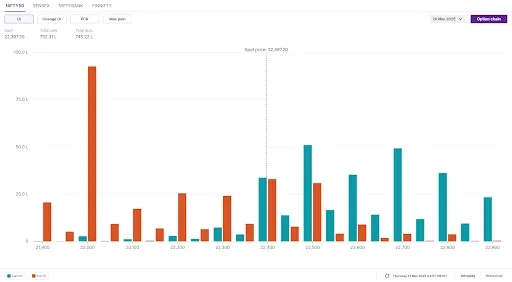
- Max call OI: 22,500
- Max put OI: 22,000
- (10 Strikes from ATM, Expiry: 20 March)
The NIFTY50 index traded in a narrow range on the weekly expiry day and closed lower. It opened higher as February retail inflation dropped to a seven-month low of 3.6%, down from 4.2% in January. However, the positive data failed to lift sentiment, and the index gave up its gains.
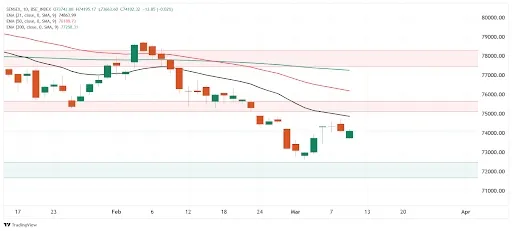
The technical structure of the index as per the daily chart remains range-bound between 22,650 and 22,250. A breakout above these levels on a closing basis on the daily chart will provide further directional insights.
The open interest (OI) data of the March 20 expiry saw significant put OI base at 22,000 strike, indicating support for the index around this zone. On the flip side, the call OI base was seen at 22,500 and 22,700 strikes, hinting resistance for the index around these zones.
SENSEX
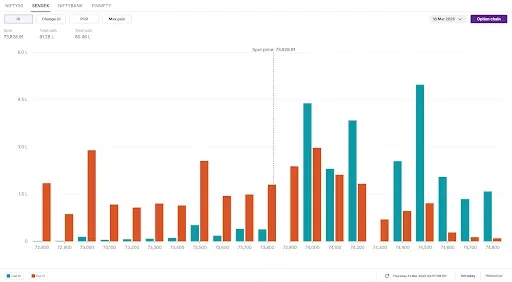
- Max call OI: 74,700
- Max put OI: 73,000
- (10 Strikes from ATM, Expiry: 18 March)
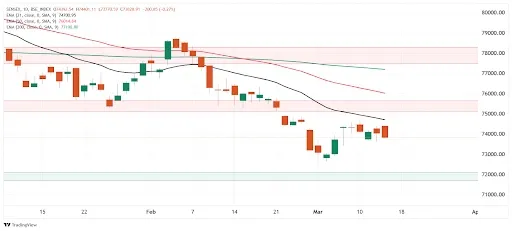
The SENSEX closed lower on Thursday, marking its fourth consecutive day of losses. The index struggled to sustain the previous week’s gains and remained confined to a narrow 1.5% range throughout the week.
From a technical perspective, the trend remains sideways within the broader range of 75,000 to 72,000. The index is consolidating at higher levels, with immediate support around the 73,600 zone. A decisive close below this level could trigger a decline towards the 72,000 zone. On the upside, a breakout above 75,000 and the 21-EMA would signal a shift in momentum.
The open interest (OI) data for the March 18 expiry saw significant options base at 74,500 call strike, suggesting resistance for the index around this zone. On the flip side, the put OI base was observed at 73,000 strike, indicating support for the index around these levels.
FII-DII activity
Stock scanner
- Long build-up: Solar Industries and Computer Age Management Services
- Short build-up: PB Fintech, Bharat Forge, Sona BLW Precision and IRFC
- Top traded futures contracts: HDFC Bank, Tata Steel, IDFC First Bank, Yes Bank and Bharat Electronics
- Top traded options contracts: DMart 3800 CE, Dixon 13,500 CE, Bajaj Finance 8500 CE, BEL 280 CE and Adani Green 900 CE
- Under F&O ban: BSE, Hindustan Copper, IndusInd Bank, Manappuram Finance and Steel Authority of India
In Futures and Options or F&O, long build-up means an increase in Open Interest (OI) along with an increase in price, and short build-up means an increase in Open Interest(OI) along with a decrease in price. Source: Upstox and NSE.
Disclaimer: Derivatives trading must be done only by traders who fully understand the risks associated with them and strictly apply risk mechanisms like stop-losses. The information is only for consumption by the client and such material should not be redistributed. We do not recommend any particular stock, securities and strategies for trading. The securities quoted are exemplary and are not recommendatory. The stock names mentioned in this article are purely for showing how to do analysis. Take your own decision before investing.
About The Author
Next Story


