Market News
Trade setup for Jan 6: NIFTY50 faces resistance at 50 EMA, lacks follow-through momentum
.png)
4 min read | Updated on January 06, 2025, 07:19 IST
SUMMARY
The options data for the January 9 expiry points at substantial call and put activity at the 24,000 strike price, suggesting market participants anticipate consolidation around this level. However, a breakout beyond the range of 23,750 to 24,250 could offer clearer directional cues.
Stock list
The SENSEX halted its two-day winning streak and closed the weekly expiry on a negative note.
Asian markets @ 7 am
- GIFT NIFTY: 24,133 (+0.14%)
- Nikkei 225: 39,444.77 (-1.13%)
- Hang Seng: 19,848.71 (+0.45%)
U.S. market update
- Dow Jones: 42,732 (▲0.8%)
- S&P 500: 5,942 (▲1.2%)
- Nasdaq Composite: 19,621 (▲1.7%)
U.S. indices, the S&P 500 and Nasdaq, broke their five-day losing streak and closed Friday’s session on a positive note. The sharp gains were driven by a rally in technology stocks, with chip giant Nvidia and Super Micro Computer posting impressive advances of 4% to 10%. Meanwhile, shares of EV giant Tesla surged over 8% after the company reported record-breaking sales in China for 2024.
NIFTY50
- January Futures: 23,897 (▼0.8%)
- Open interest: 5,04,345 (▲1.4%)
The NIFTY50 broke its two-day winning streak, unable to capitalize on Thursday’s momentum. Selling pressure intensified, led by a sharp sell-off in IT and private bank stocks.
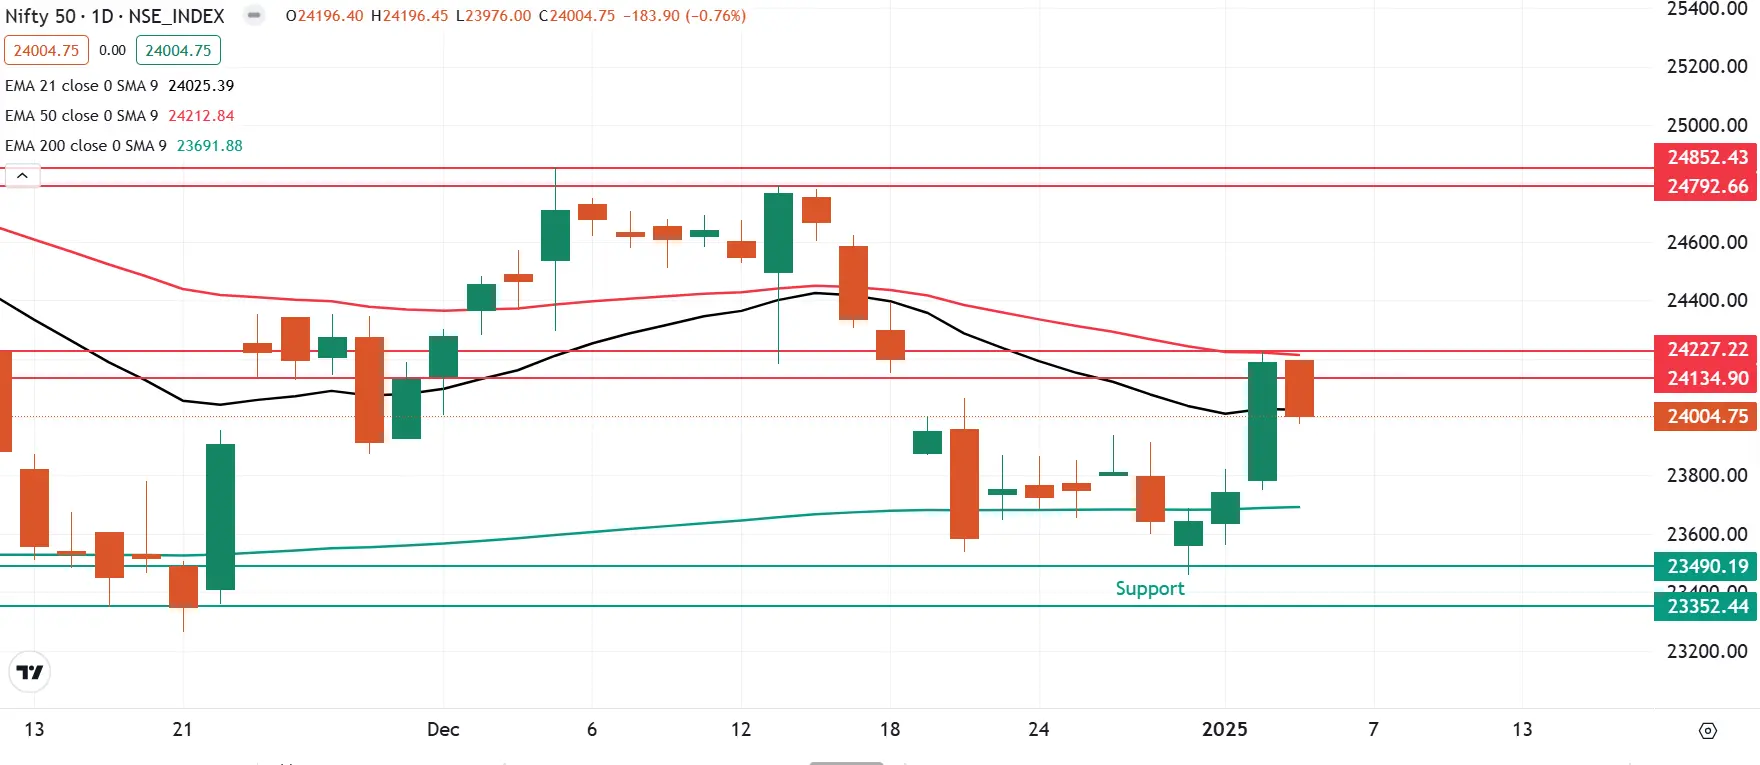
The technical structure of the index as per the weekly chart looks indecisive as the index formed a spinning top candlestick pattern. A spinning top has a small body with long upper and lower shadows, suggesting that both buyers and sellers tried to push the price but failed to sustain it on a closing basis.
Meanwhile, as per the daily chart the index faced rejection from its 50 day exponential moving average (EMA) after a sharp up move on the weekly expiry. This indicates the presence of sellers around the 24,200 zone. Additionally, the index also closed below its 21 EMA on Friday, indicating weakness.
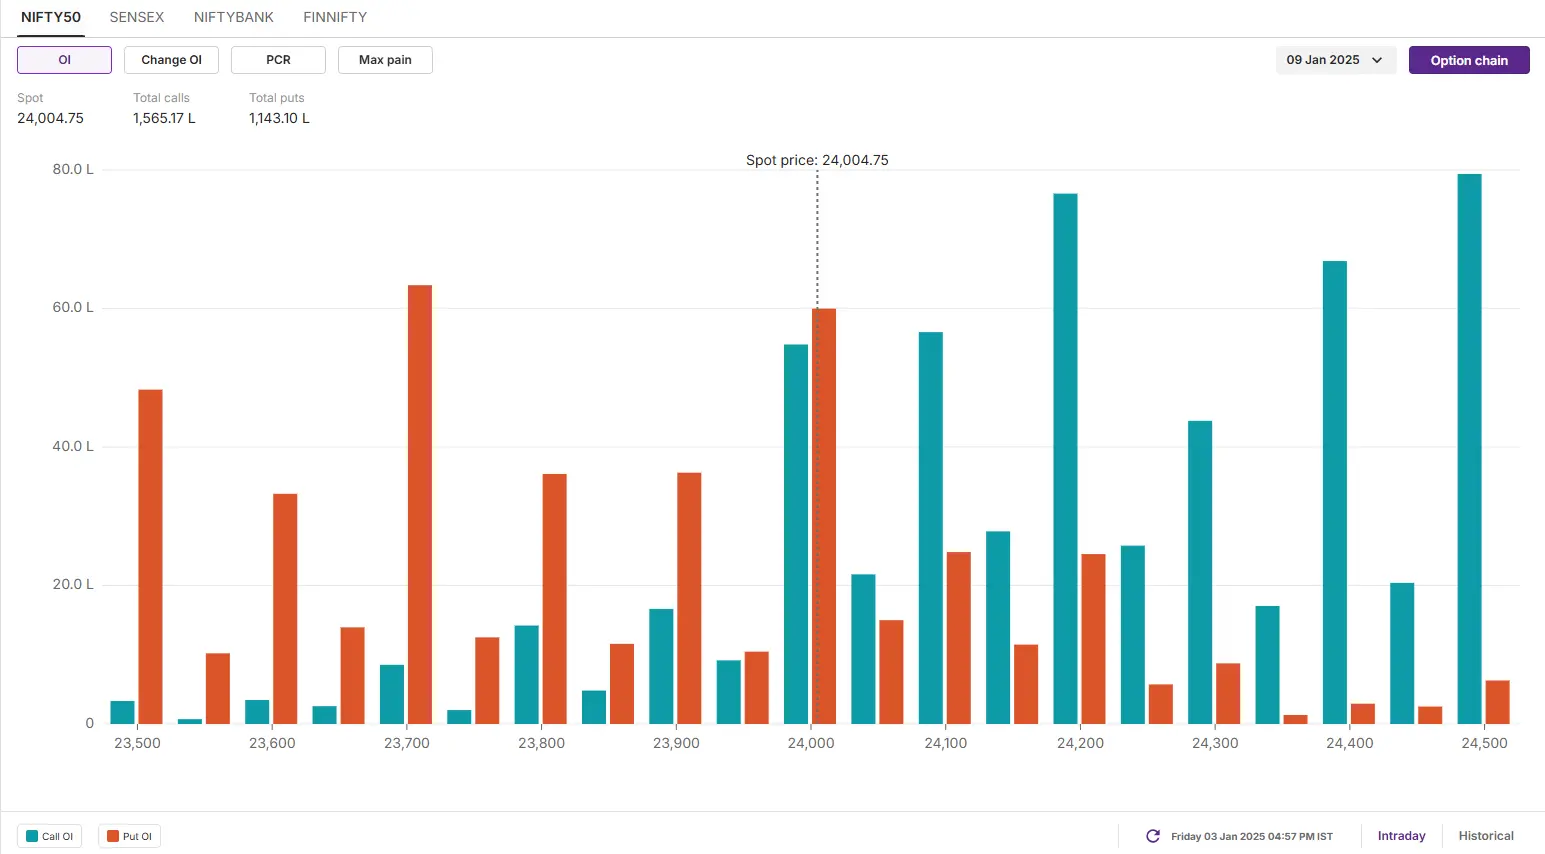
The open interest data for the 9 January expiry saw significant call build-up at the 24,500 and 24,200 strikes, indicating resistance around these zones. Conversely, the put base was 23,700 and 23,500 strikes, suggesting support for the index near these levels.
SENSEX
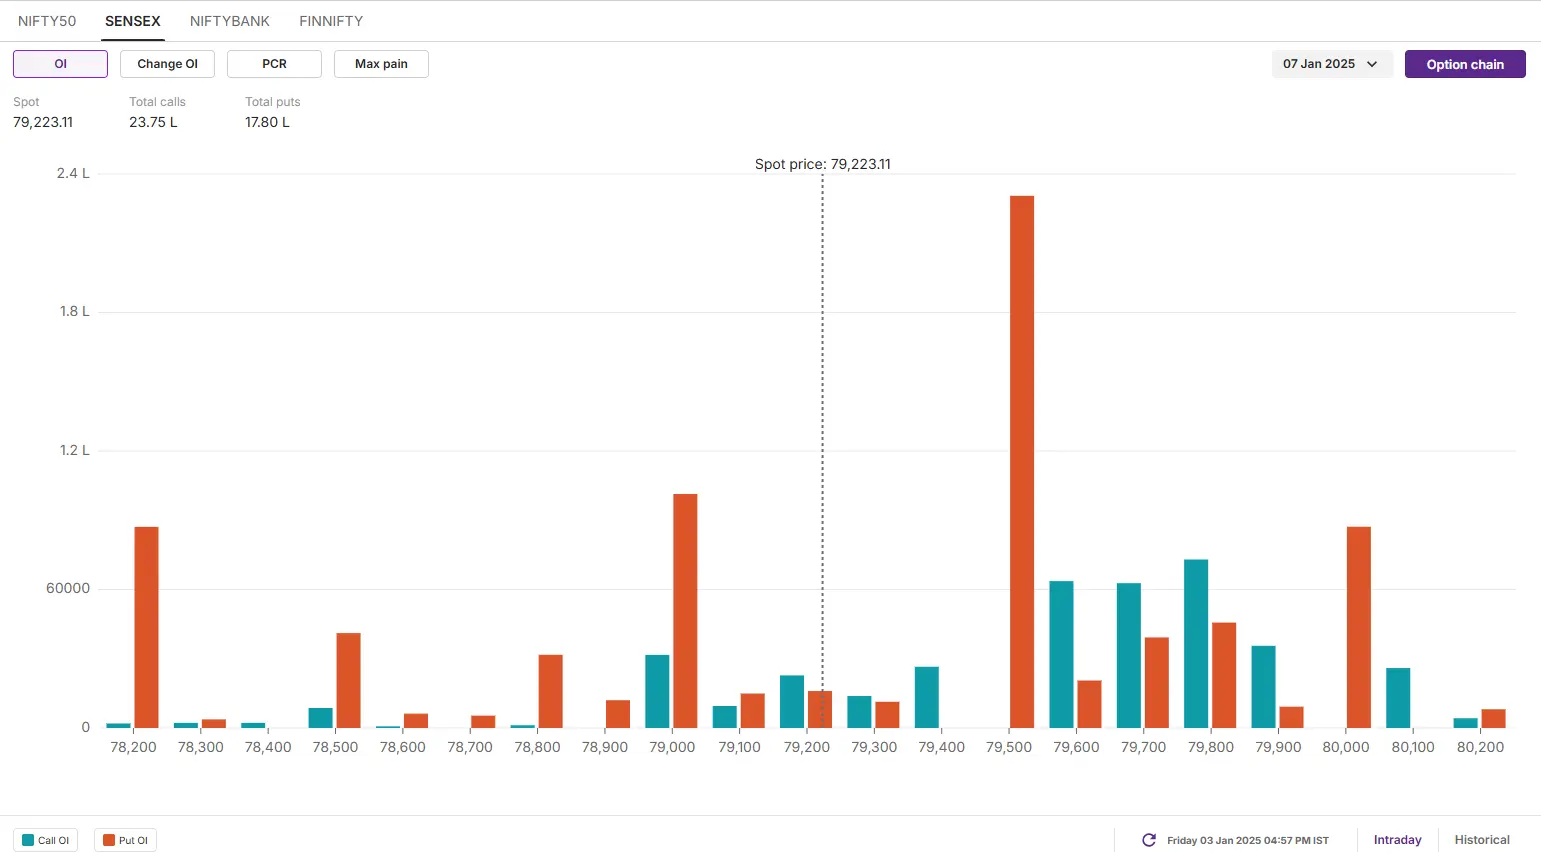
- Max call OI: 81,500
- Max put OI: 79,500
- (Expiry: 7 Jan)
The SENSEX halted its two-day winning streak and closed the weekly expiry on a negative note. Mirroring the performance of the NIFTY50, the index also formed a spinning top pattern on the weekly chart, indicating uncertainty among buyers and sellers at the current levels.
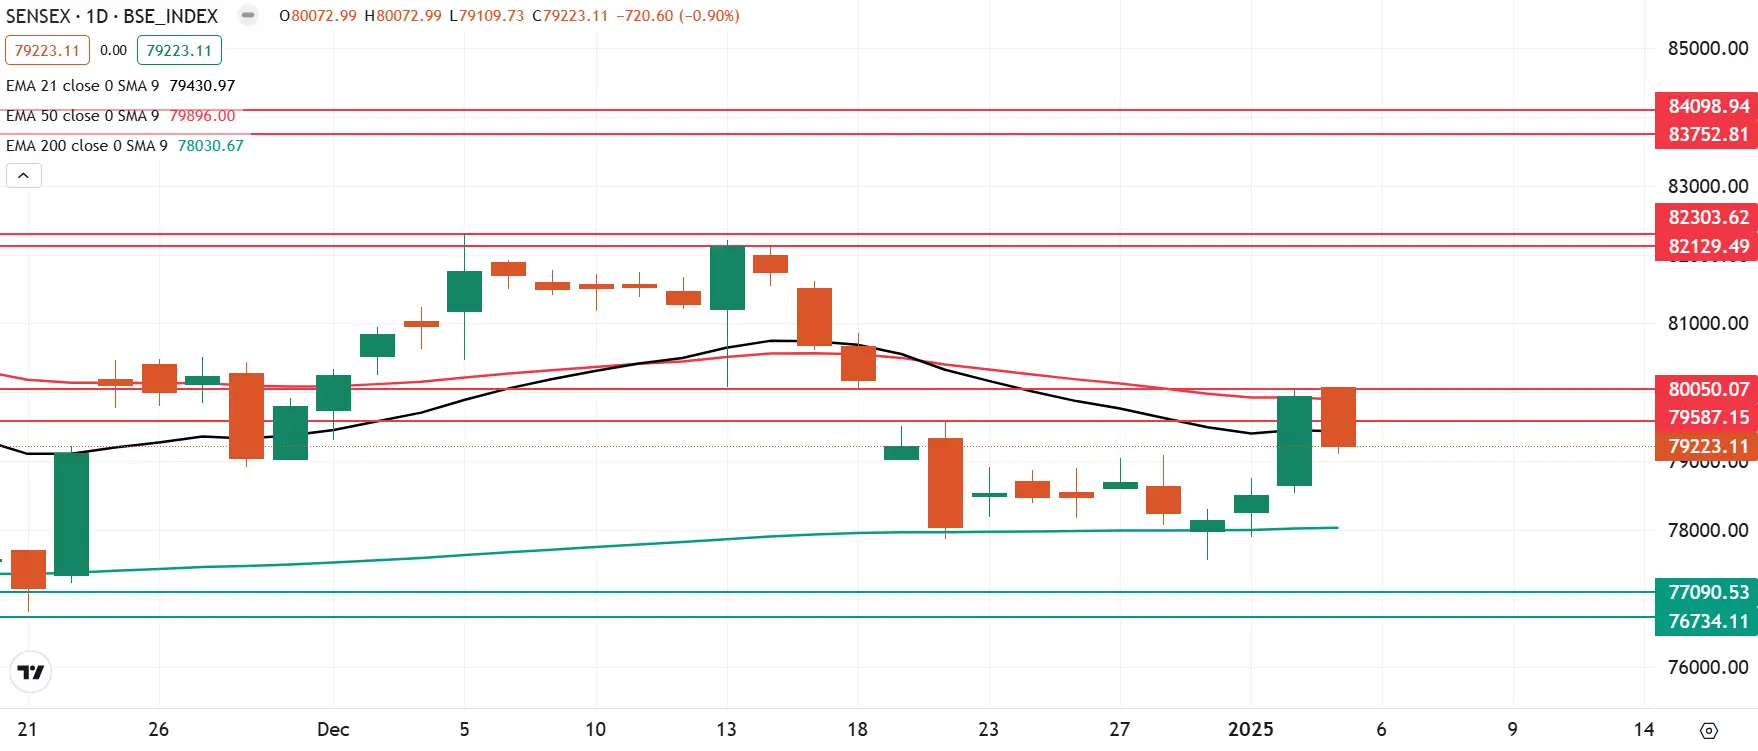
As depicted in the chart below, the index encountered resistance near the 80,000 mark, which aligns with its 50-day EMA. Additionally, it closed below its 21-day EMA, signaling the presence of fresh selling pressure at these levels.
On the other hand, immediate support for the index is seen in the 78,900–79,000 zone. A decisive close below this range could amplify bearish sentiment, potentially dragging the index further down toward the 200-day EMA near the 78,000 level.
The open interest data for the 7 January expiry saw significant call options base at 81,500 and 79,500 strikes, suggesting resistance for the index around these zones. On the flip side, the put base was seen at 79,500 and 77,500 strikes, signalling consolidation around 79,500 level and crucial support around 77,500 level.
FII-DII activity
Stock scanner
- Long build-up: Avenue Supermarts (DMART), Cholamandalam Investment, Oil India, Info-Edge (Naukri) and Union Bank
- Short build-up: Angel One, Delhivery, Wipro, Indian Energy Exchange, Godrej Properties and KEI Industries
- Under F&O ban: Manappuram Finance and RBL Bank
In Futures and Options or F&O, long build-up means an increase in Open Interest (OI) along with an increase in price, and short build-up means an increase in Open Interest(OI) along with a decrease in price.
Source: Upstox and NSE.
Disclaimer: Derivatives trading must be done only by traders who fully understand the risks associated with them and strictly apply risk mechanisms like stop-losses. The information is only for consumption by the client and such material should not be redistributed. We do not recommend any particular stock, securities and strategies for trading. The securities quoted are exemplary and are not recommendatory. The stock names mentioned in this article are purely for showing how to do analysis. Take your own decision before investing.
About The Author
Next Story
