Market News
Trade Setup for Jan 3: NIFTY50 breaks out of 7-day range, reclaims 21 EMA
.png)
4 min read | Updated on January 03, 2025, 08:15 IST
SUMMARY
The NIFTY50 index broke out of its seven-day consolidation and reclaimed its 21-day exponential moving average (EMA), sustaining positive momentum for the second consecutive day. Furthermore, if the index closes the week above last week's high, it could further fuel the bullish momentum.
Stock list

After a positive start, the NIFTY50 index built onto its opening gains and advanced nearly 2% on the weekly expiry of its options contracts.
Asian markets @ 8 am
- GIFT NIFTY: 24,187 (-0.45%)
- Nikkei 225: Closed
- Hang Seng: 19,806.53 (+0.91%)
U.S. market update
- Dow Jones: 42,400 (▼0.3%)
- S&P 500: 5,869 (▼0.2%)
- Nasdaq Composite: 19,280 (▼0.1%)
U.S. indices started the first trading day of 2025 on the negative note, denting the hopes of a Santa Claus rally. The sharp drop was led by heavyweight and Tesla and Apple.
Shares of Tesla declined over 6% after the EV maker posted its first decline in annual deliveries. Meanwhile, the shares of Apple fell over 2% after the company offered rare price discounts on its latest models in China, indicating rising competition from local makers.
NIFTY50
- January Futures: 23,897 (▲1.5%)
- Open interest: 4,96,986 (▼6.3%)
After a positive start, the NIFTY50 index built onto its opening gains and advanced nearly 2% on the weekly expiry of its options contracts. The sharp rally was led by gains in index heavyweight IT and Automobiles stocks.
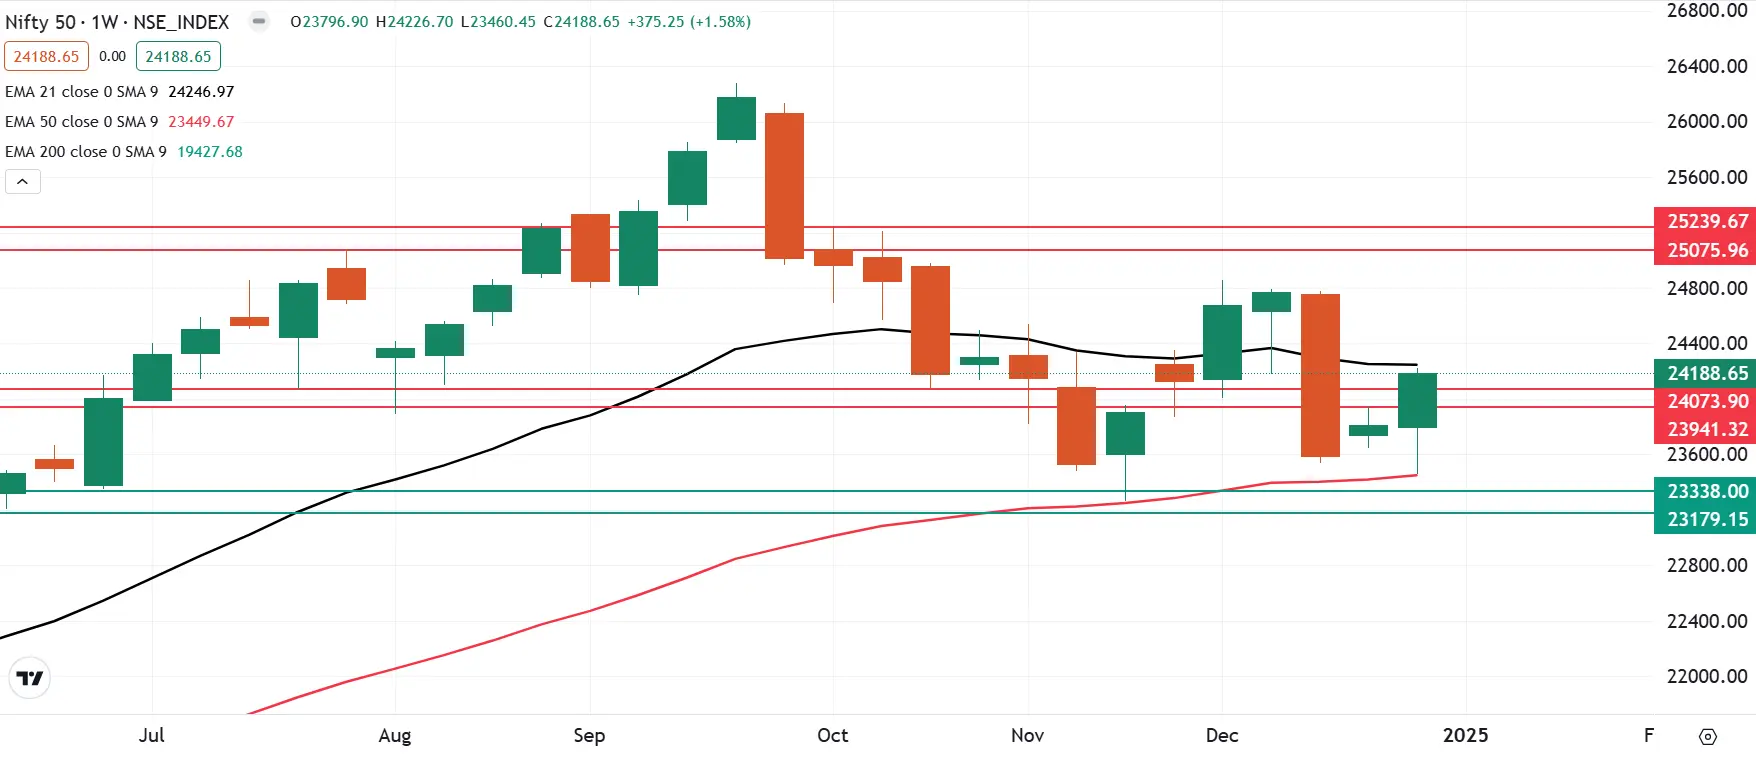
The technical structure of the index as per the weekly chart has developed a bullish structure which indicates a close above the previous week’s high. Traders can monitors today’s weekly close as a close above the previous week’s high and the weekly 21 exponential moving average (EMA) will signal continuation of the bullish momentum.
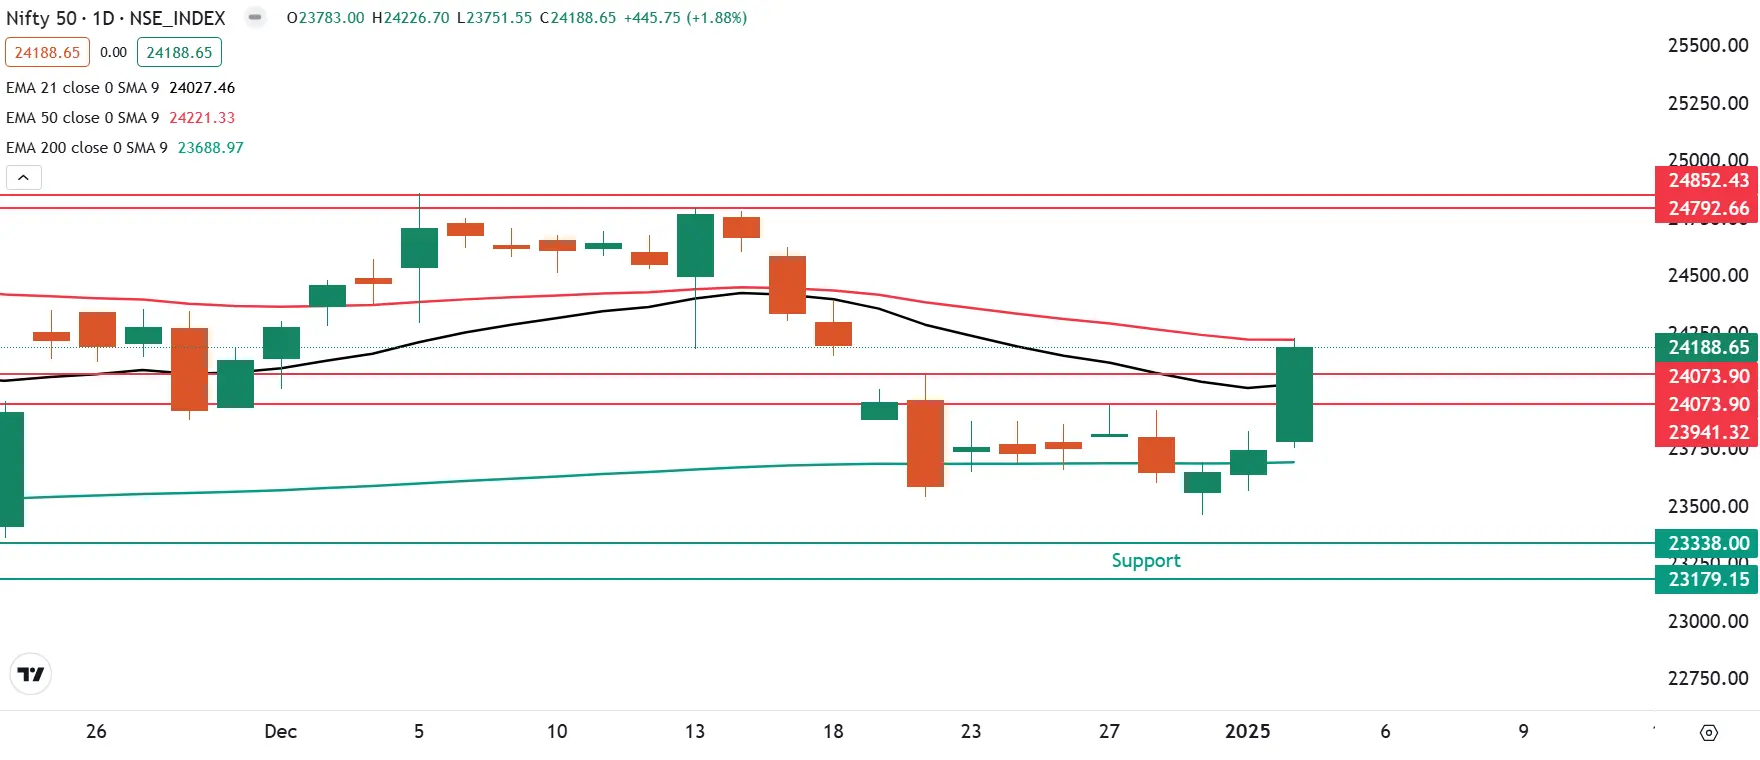
Meanwhile, on the daily chart the index reclaimed its 21 EMA and broke out of the seven day consolidation, reclaiming the 20 December’s high. For the upcoming sessions, the index has converted the resistance zone of 23,950 and 24,050 into its immediate support. As long as the index holds above this zone, the bullish trend is likely to sustain.
SENSEX
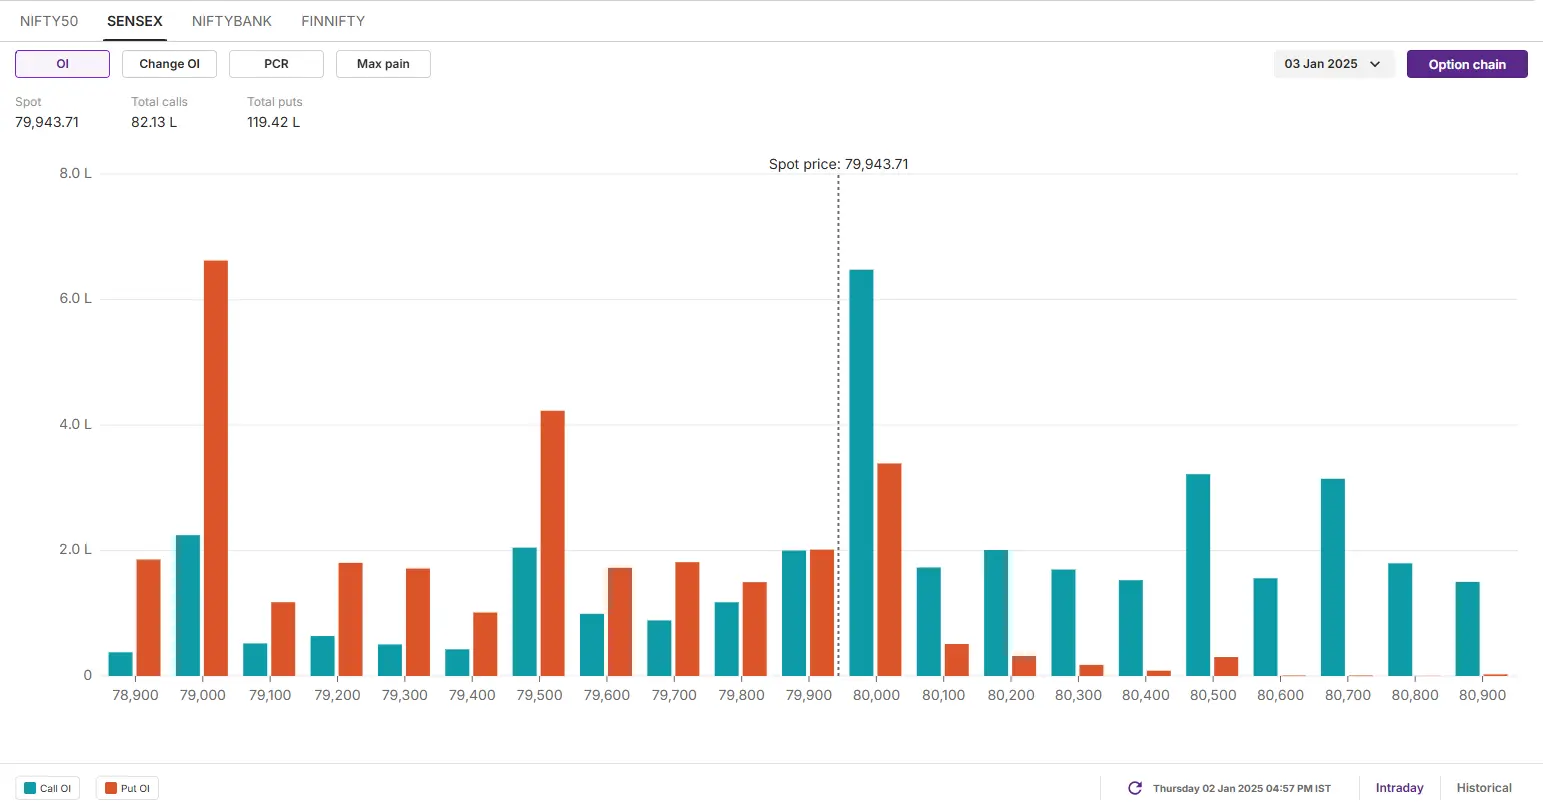
- Max call OI: 81,000
- Max put OI: 78,500
- (Expiry: 3 Jan)
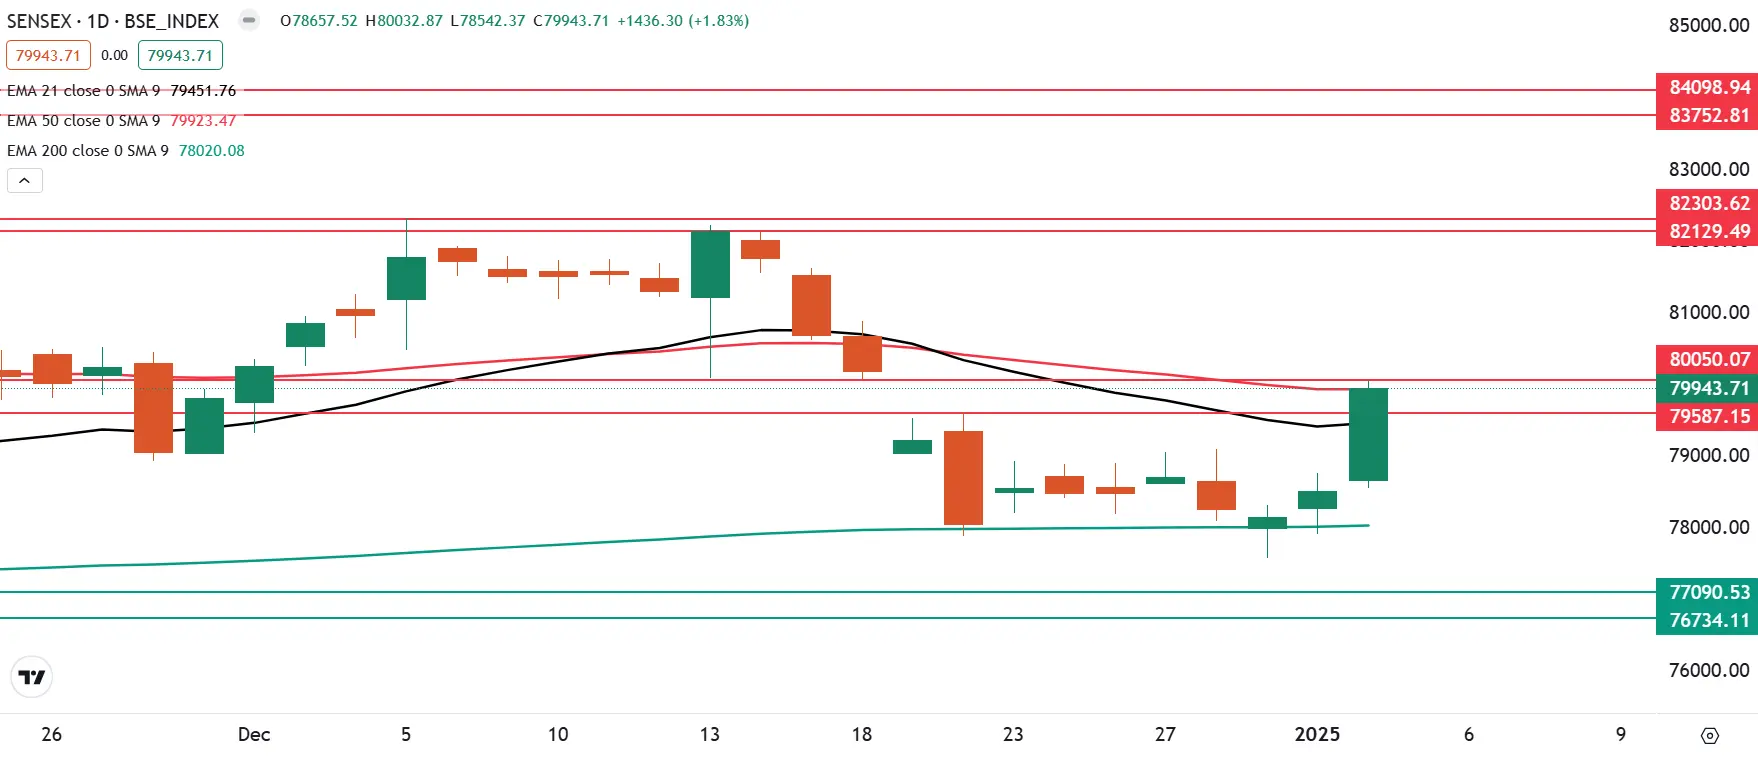
The SENSEX began the day on a positive note, reclaiming both its 21 and 50 EMA on the daily chart, thus extending its bullish momentum for a second consecutive day. Moreover, the index broke out of its seven-day consolidation phase and surpassed the high from December 20, further signaling strong bullish momentum.
On the daily chart, the index has converted the 79,500 resistance zone into immediate support. As long as the index remains above this level, the bullish trend is likely to persist. However, if the index falls below the 79,500 mark, the trend could shift to a range-bound phase.
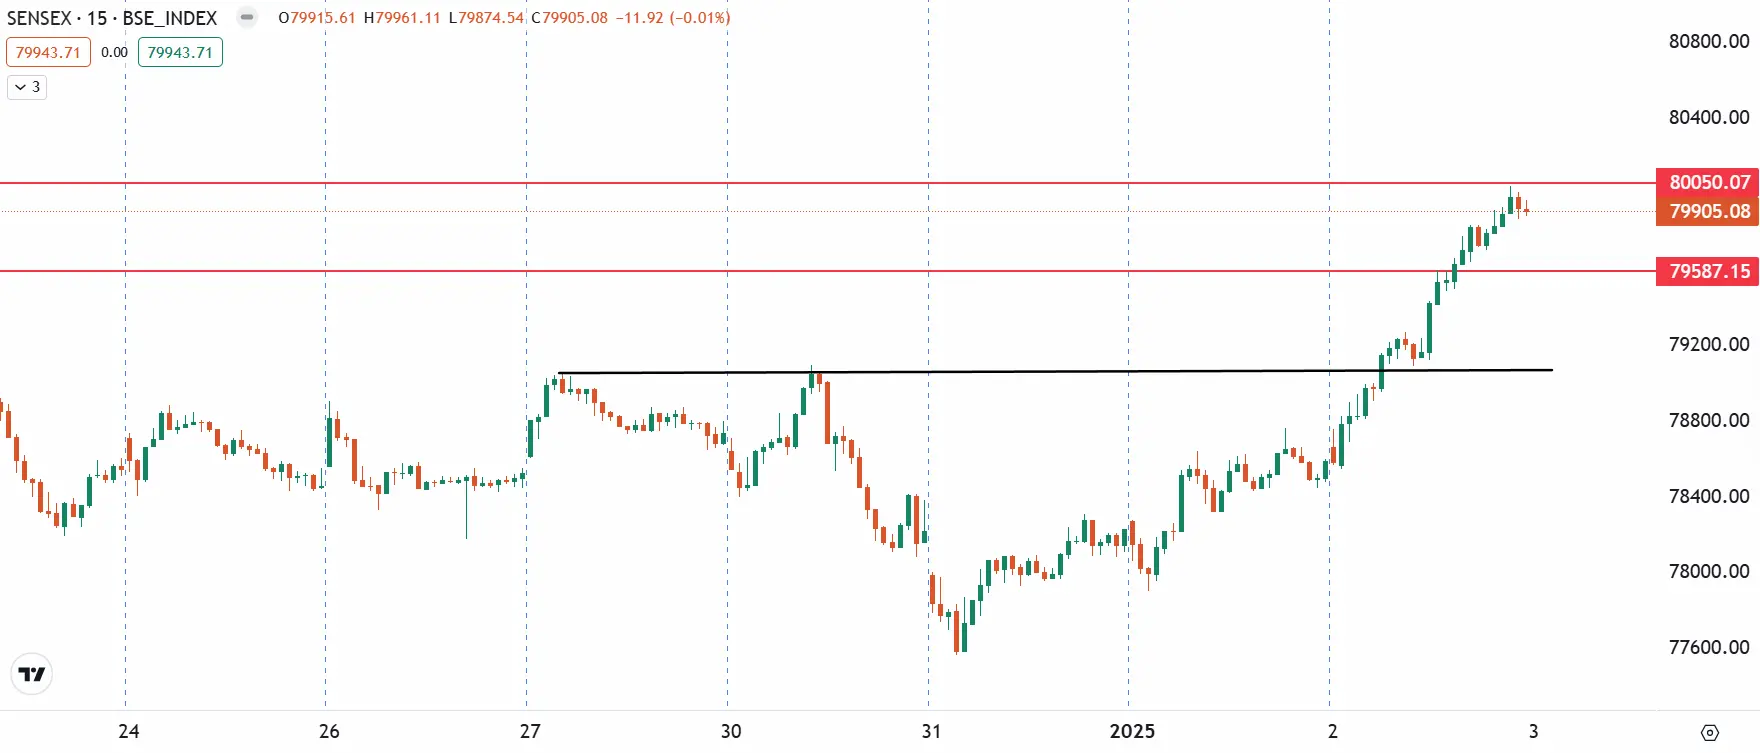
According to the 15-minute chart, following a sharp upward move, the index is currently testing the immediate resistance at 80,000. A breakout above this level with a strong candle could trigger further gains. Conversely, if the index falls below the immediate support at 79,500, the trend may shift to a range-bound phase.
The open interest data for today’s expiry saw a significant call base at 80,000 strike, suggesting resistance for the index around this zone. On the flip side, the put base shifted to 79,000 strike, making this as immediate support for the index.
FII-DII activity
Stock scanner
- Long build-up: Eicher Motors, Bajaj Finserv, Maruti Suzuki, Oil India, Titan and Infosys
- Short build-up: Petronet LNG and Adani Total Gas
- Under F&O ban: Manappuram Finance and RBL Bank
- Added under F&O ban: RBL Bank
In Futures and Options or F&O, long build-up means an increase in Open Interest (OI) along with an increase in price, and short build-up means an increase in Open Interest(OI) along with a decrease in price.
Source: Upstox and NSE.
Disclaimer: Derivatives trading must be done only by traders who fully understand the risks associated with them and strictly apply risk mechanisms like stop-losses. The information is only for consumption by the client and such material should not be redistributed. We do not recommend any particular stock, securities and strategies for trading. The securities quoted are exemplary and are not recommendatory. The stock names mentioned in this article are purely for showing how to do analysis. Take your own decision before investing.
About The Author
Next Story

