Market News
Trade setup for Jan 23: NIFTY50 tests 23,000 support with inside candle pattern
.png)
5 min read | Updated on January 23, 2025, 07:17 IST
SUMMARY
The NIFTY50 index failed to provide the follow-through of the bearish engulfing pattern formed on 21 January. The index formed an inside candlestick pattern on the daily chart and a break above the high or low on closing basis of the inside candle will provide further clues.
Stock list

The NIFTY50 index recovered slightly after a sharp correction the previous day, forming a bullish harami candlestick pattern on the daily chart, resembling an inside candle.
Asian markets @ 7 am
- GIFT NIFTY: 23,136.50 (-0.17%)
- Nikkei 225: 39,874.42 (+0.58%)
- Hang Seng: 19,881.32 (+0.52%)
U.S. market update
- Dow Jones: 44,156 (▲0.3%)
- S&P 500: 6,086 (▲0.6%)
- Nasdaq Composite: 20,009 (▲1.2%)
U.S. indices extended the winning momentum for the third day in a row amid a rally in technology stocks. Shares of Oracle and Nvidia jumped in the range of 4 to 6% on the as the U.S. President announced a joint venture with OpenAI, Oracle and Softbank to invest $500 billion in AI infrastructure.
Meanwhile, shares of Netflix jumped over 9% after the company surpassed street estimates and surpassed 300 million paid memberships. The streamer’s performance received a boost from popular content, including the hit series Squid Game and live sporting events like the Jake Paul vs. Mike Tyson boxing match.
NIFTY50
- January Futures: 23,198 (▲0.4%)
- Open interest: 5,63,413 (▼3.3%)
The NIFTY50 index recovered slightly after a sharp correction the previous day, forming a bullish harami candlestick pattern on the daily chart, resembling an inside candle. It maintained the crucial 23,000 level at closing for the second consecutive day, failing to confirm the bearish engulfing pattern formed on January 21.
A bullish harami consists of a small bullish candle that is completely within the previous larger bearish candle, indicating a slowdown in selling pressure and possible buying interest. However, the pattern gets confirmed if the close of the subsequent candle is above the high of the harami candle.
Meanwhile, the broader trend of the index still remains bearish with immediate resistance around 23,600 zone. Unless the index reclaims this level, which aligns with its 200-day exponential moving average, the trend may remains weak. A close above this zone will signal change in the momentum.
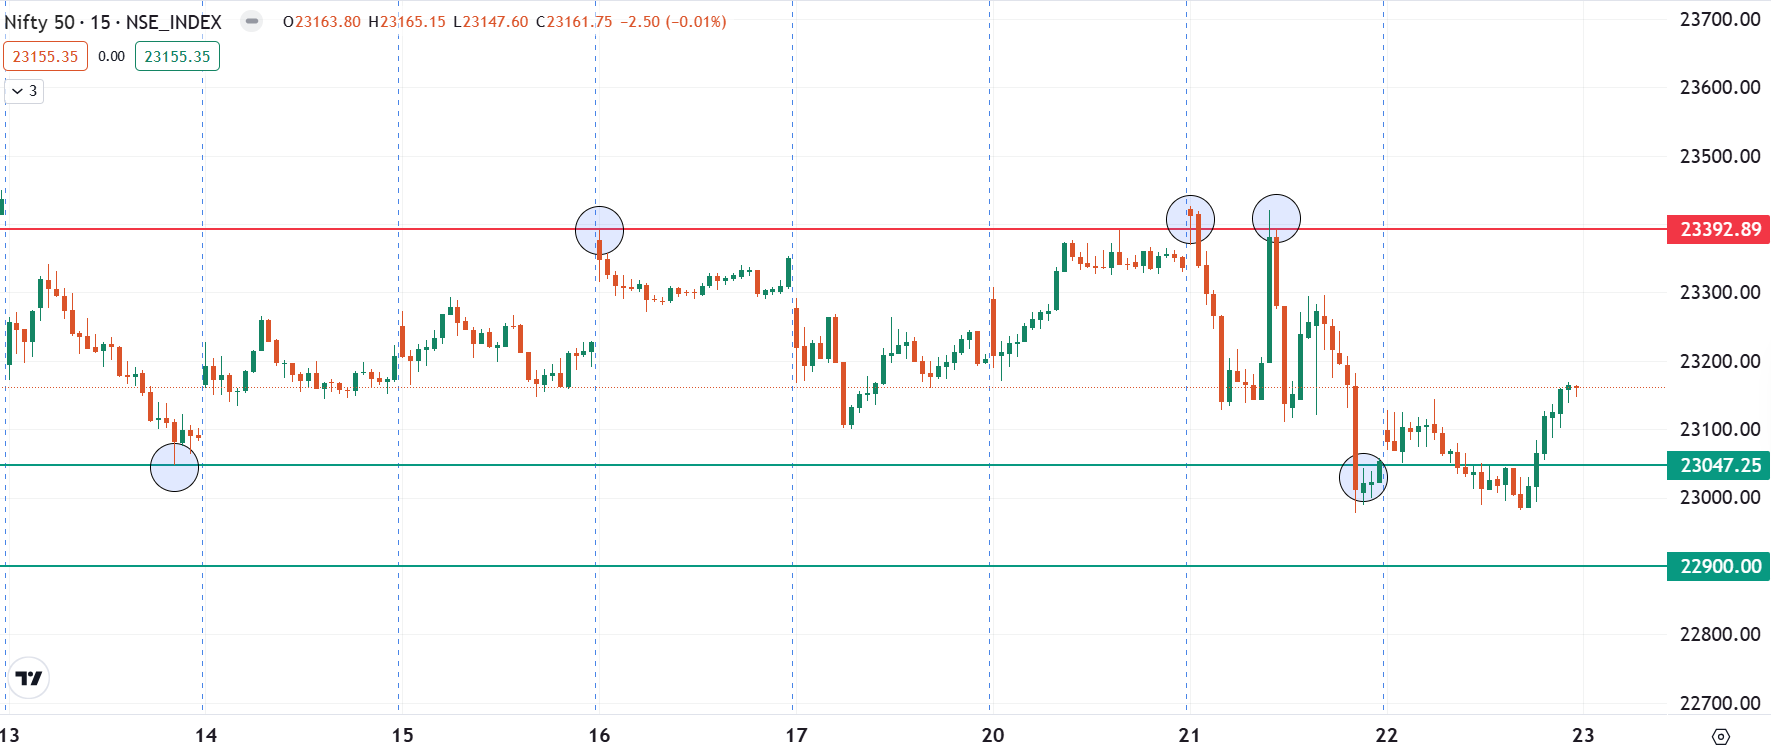
For today’s expiry, traders can monitor the range of 23,400 and 22,900 on the 15-minute chart. As shown on the chat below, the index has taken multiple resistance around the 23,400 zone. On the flip side, the immediate support for the index is around 22,900 area. Unless the index breaks this range with a strong candle, it may osciallate within this range.
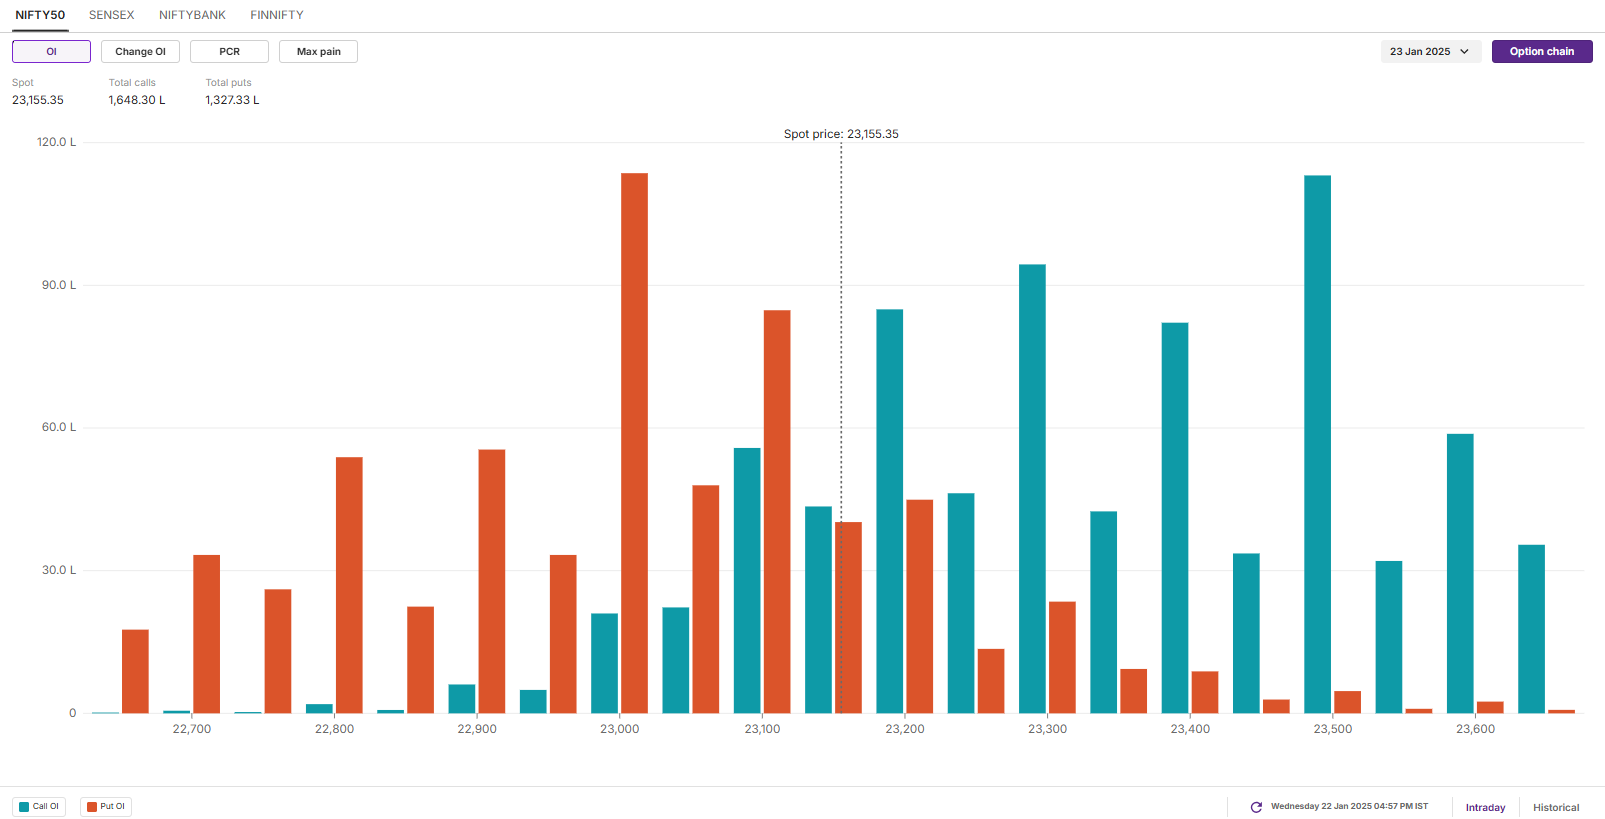
The open interest data for today’s expiry saw significant build-up of put options at the 23,000 strike, suggesting emergence of fresh buyers around this strike. On the flip side, the call base remained at 23,500 strike, indicating resistance around this level.
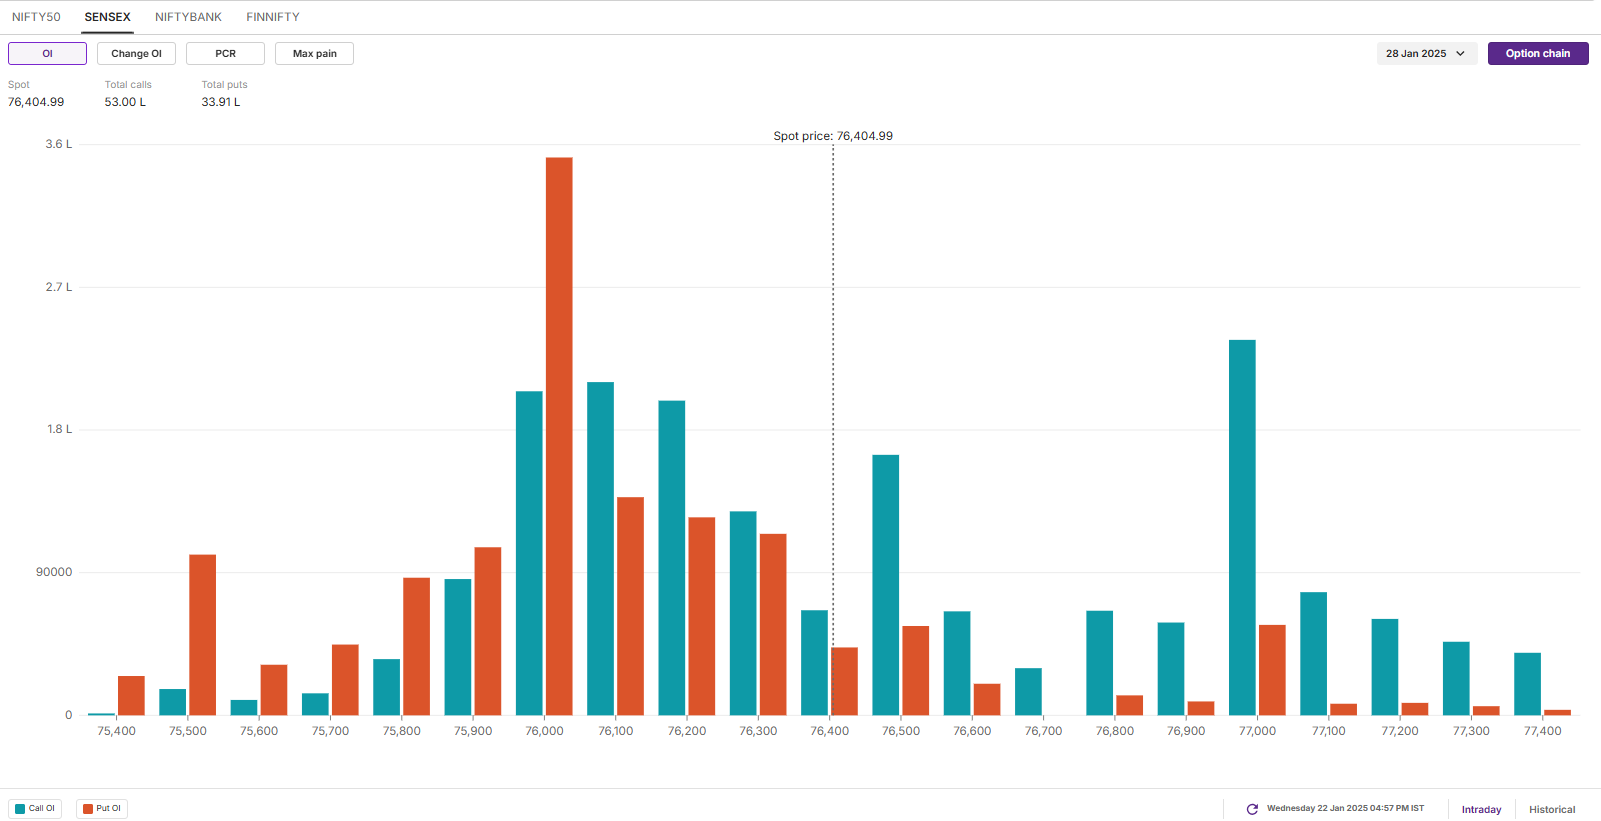
SENSEX
- Max call OI: 78,000
- Max put OI: 76,000
- (Expiry: 28 Jan)
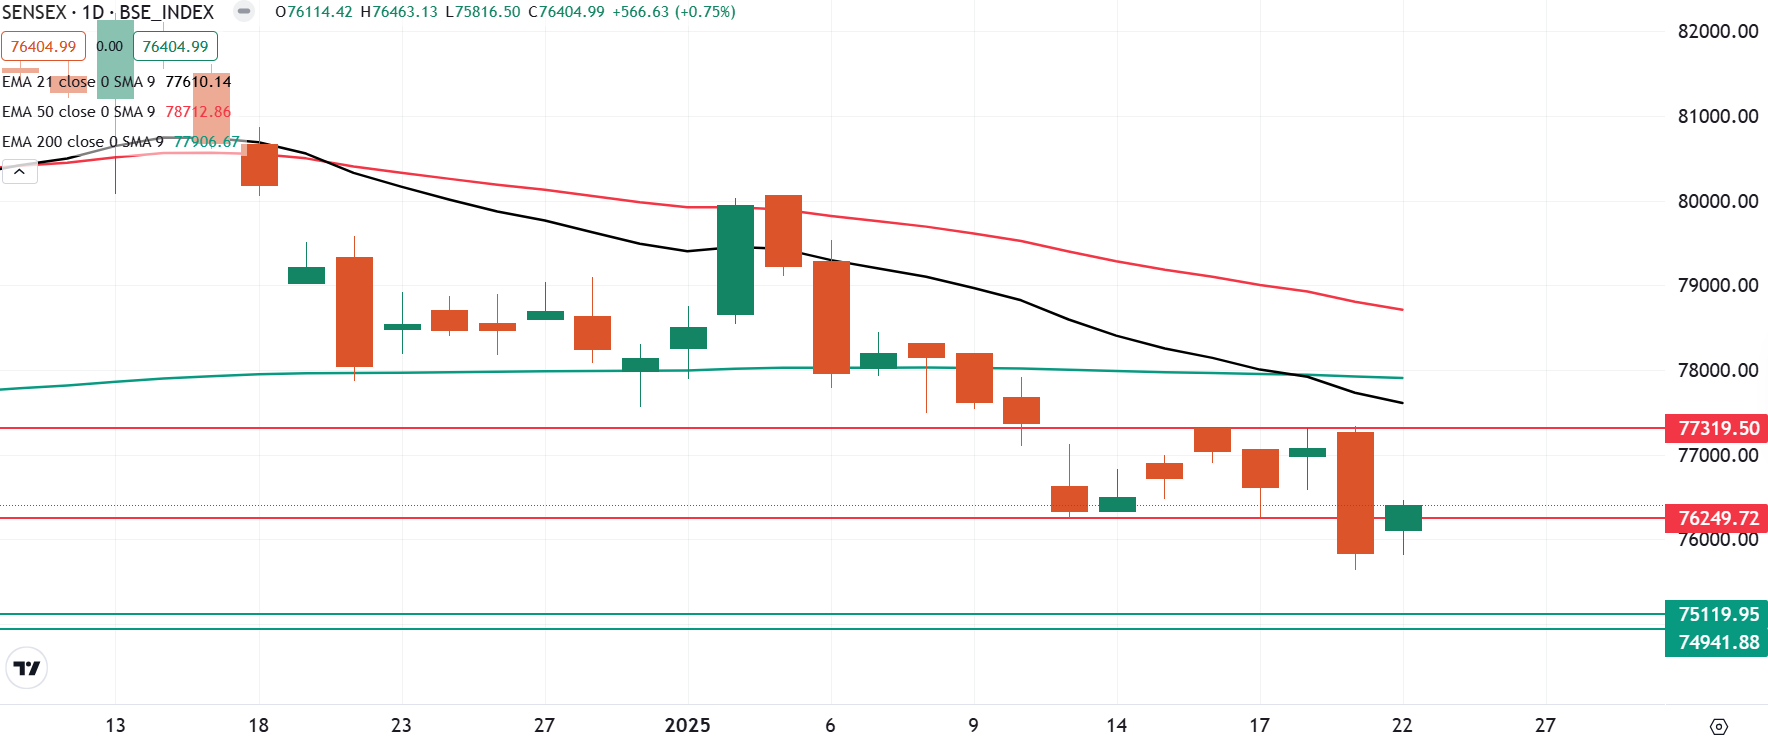
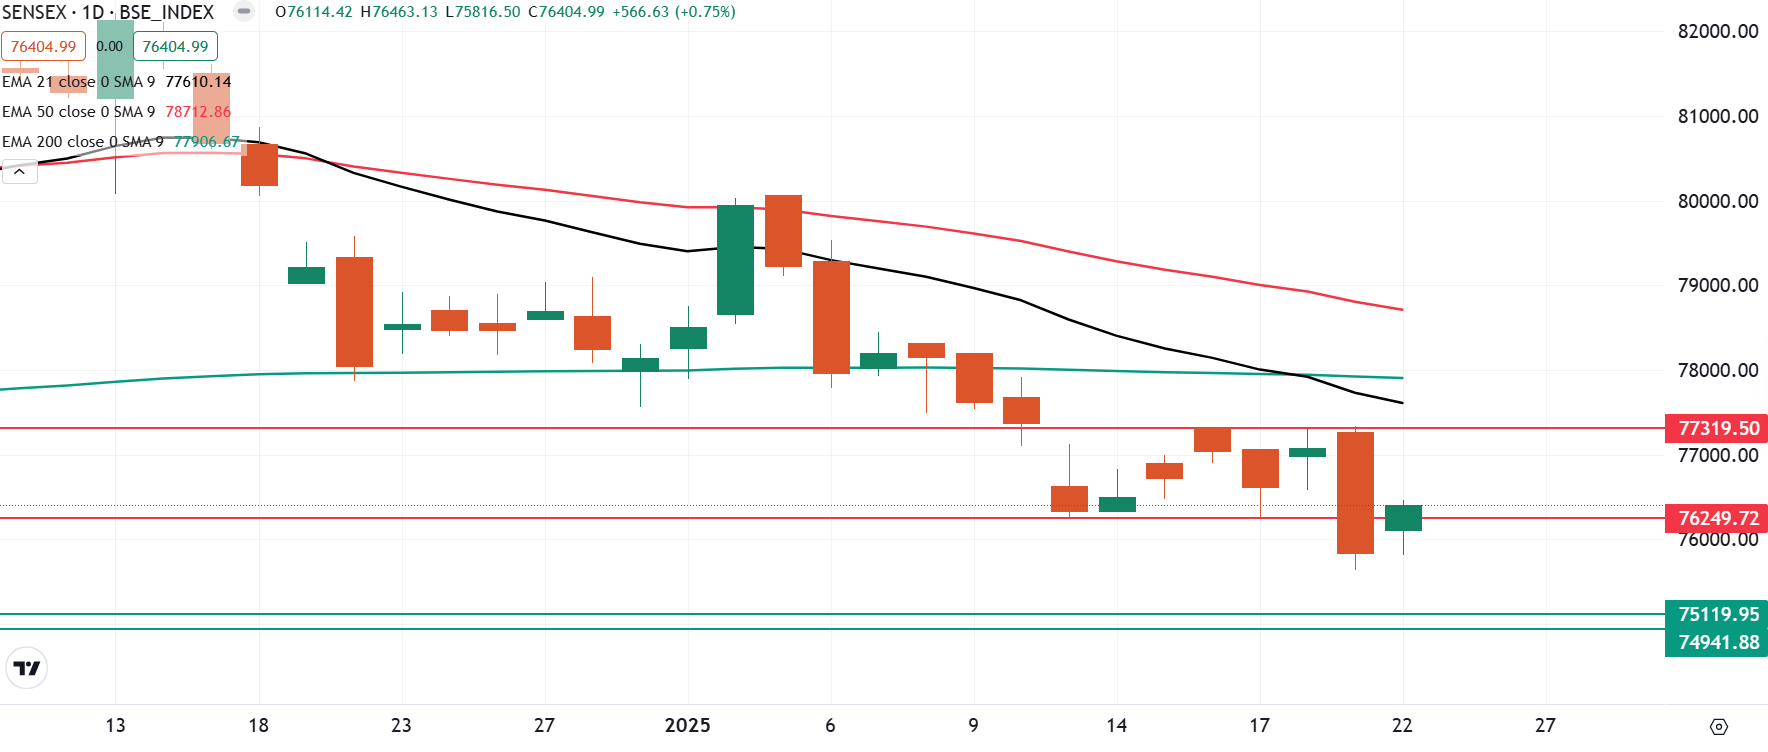
The SENSEX also started the Wednesday’s session on a positive note and sustained its gains throughout the day. The index also formed the bullish harami pattern on the daily chart, resembling the inside candle.
From the technical standpoint, the broader trend of the SENSEX remains bearish with index currently trading below all the key daily exponential moving averages like 21,50 and 200. Additionally, for short-term clues traders can monitor the range of 72,300 and 76,200. A close above or below this range will provide further directional clues.
The open interest data for the 28 January expiry saw significant put base at 76,000 strike, indicating support for the index around this zone. On the other hand, the significant call base was seen at 77,000 strike, pointing at resistance for the index around this area.
FII-DII activity
Stock scanner
- Long build-up: Wipro, KEI Industries and Dalmia Bharat
- Short build-up: Polycab, Macrotech Developers, Prestige Estates, IndiaMART InterMESH and CG Power
- Under F&O ban: Aditya Birla Fashion and Retail, Angel One, Bandhan Bank, Kalyan Jewellers, Can Fin Homes, Dixon Technologies, Manappuram Finance, L&T Finance, Mahanagar Gas and RBL Bank
- Out of F&O ban: NIL
In Futures and Options or F&O, long build-up means an increase in Open Interest (OI) along with an increase in price, and short build-up means an increase in Open Interest(OI) along with a decrease in price.
Source: Upstox and NSE.
Disclaimer: Derivatives trading must be done only by traders who fully understand the risks associated with them and strictly apply risk mechanisms like stop-losses. The information is only for consumption by the client and such material should not be redistributed. We do not recommend any particular stock, securities and strategies for trading. The securities quoted are exemplary and are not recommendatory. The stock names mentioned in this article are purely for showing how to do analysis. Take your own decision before investing.
About The Author
Next Story

