Market News
Trade setup for Feb 3: NIFTY50 forms doji on budget day, faces 200 EMA resistance
.png)
4 min read | Updated on February 03, 2025, 02:37 IST


SUMMARY
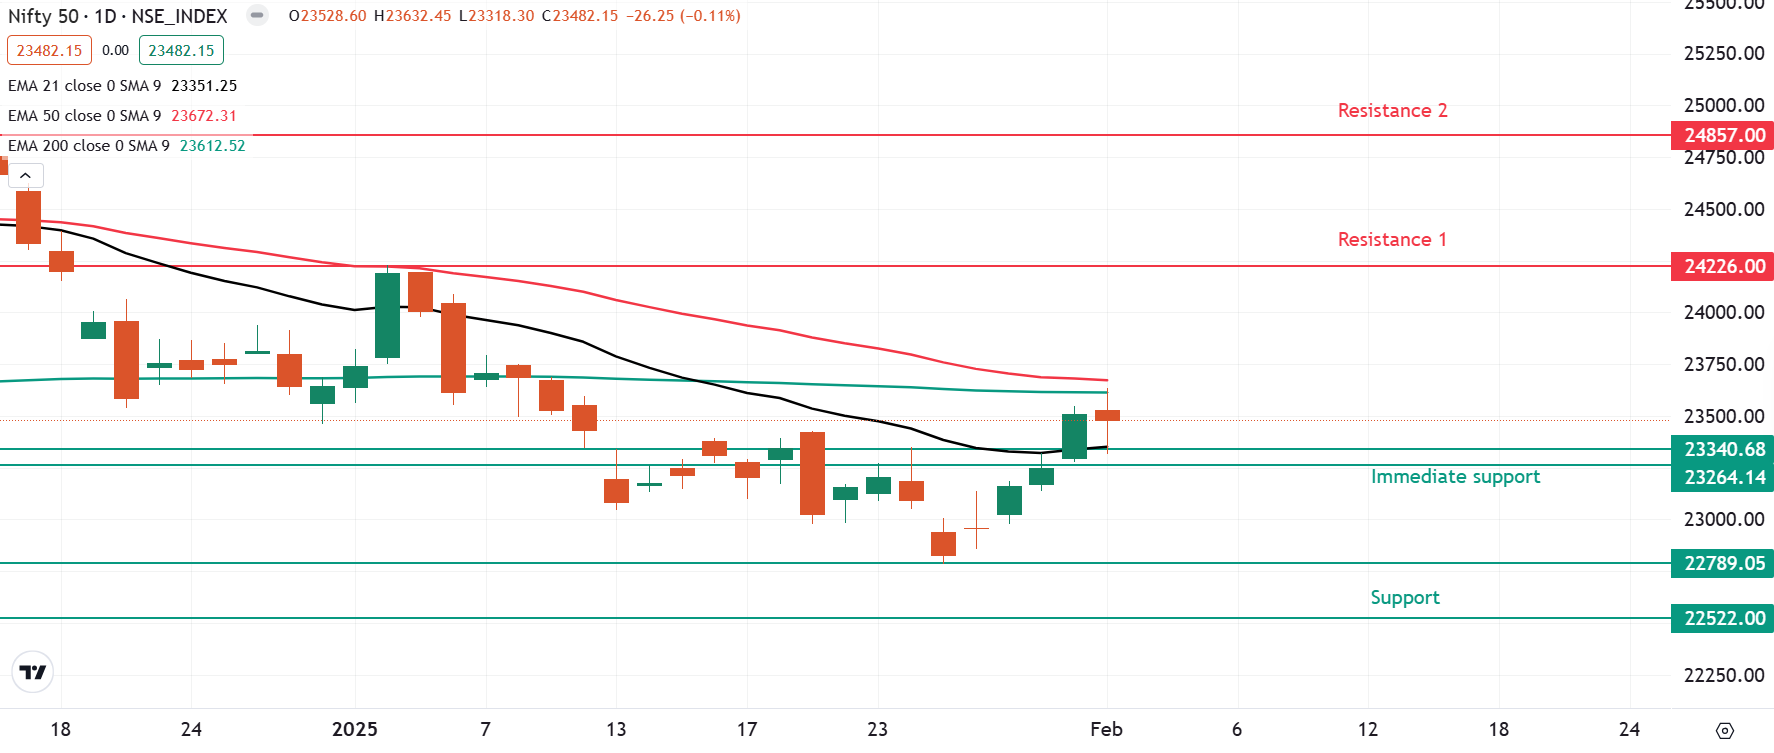
On the daily chart, the NIFTY50 encountered resistance near its 200-day EMA, forming a doji candlestick pattern. This suggests market indecision following the Union Budget announcement. Traders should monitor the 23,600-23,300 range in the coming sessions; a decisive break above or below this range will offer clearer directional signals.
Stock list
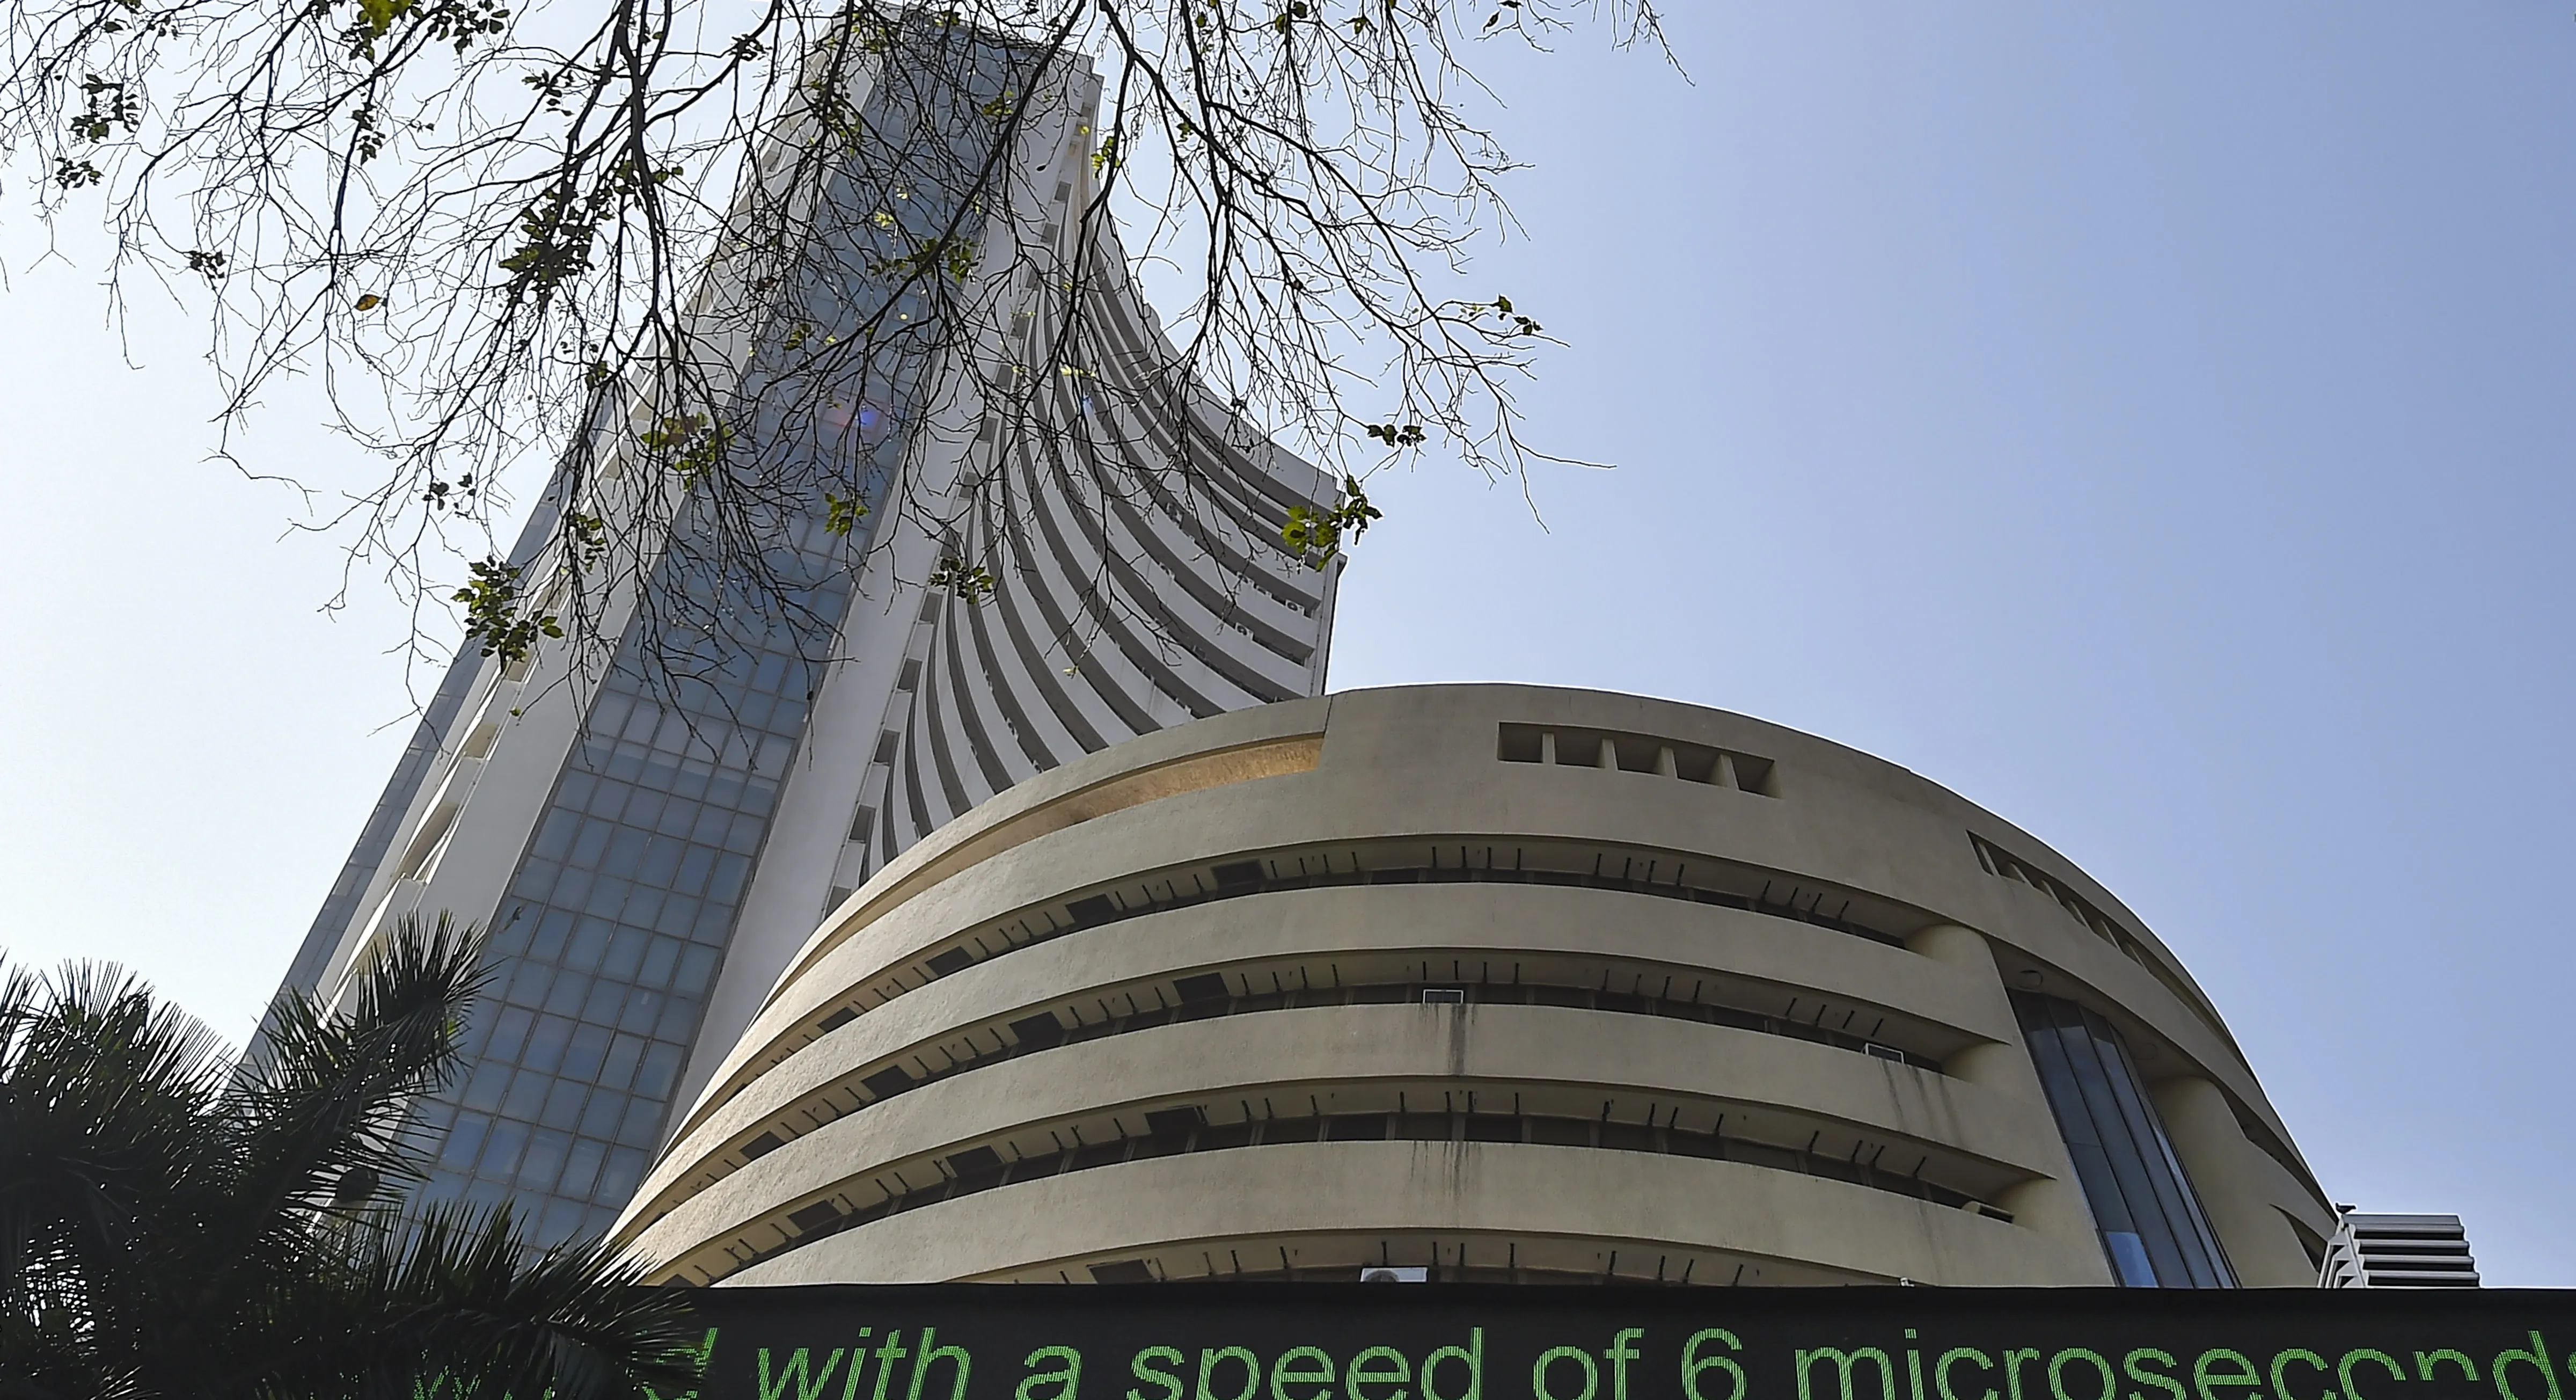
The SENSEX ended the Budget session on a negative note, snapping a four-day winning streak. | Image: PTI
Asian markets @ 7 am
- GIFT NIFTY: 23,395 (-0.73%)
- Nikkei 225: 38,762 (-2%)
- Hang Seng: 20,048 (-0.87%)
NIFTY50
- February Futures: 23,555 (▼0.2%)
- Open interest: 2,31,897 (▼2.1%)
The NIFTY50 index snapped its four-day winning streak, closing marginally lower on February 1 in a volatile trading session following Finance Minister Nirmala Sitharaman’s budget presentation. The index faced resistance around its 200-day expoential moving average (23,620) in the morning, fueled by optimism for a better-than-expected budget. However, as the budget aligned with market expectations, the index failed to sustain these gains and retreated.
As per the daily chart, the NIFTY50 index faces immediate resistance around the 200-EMA. If the index sustains above 23,700, the 24,000 mark will be the next key level to watch. However, if it remains below this threshold, consolidation may continue, with support around 23,300.
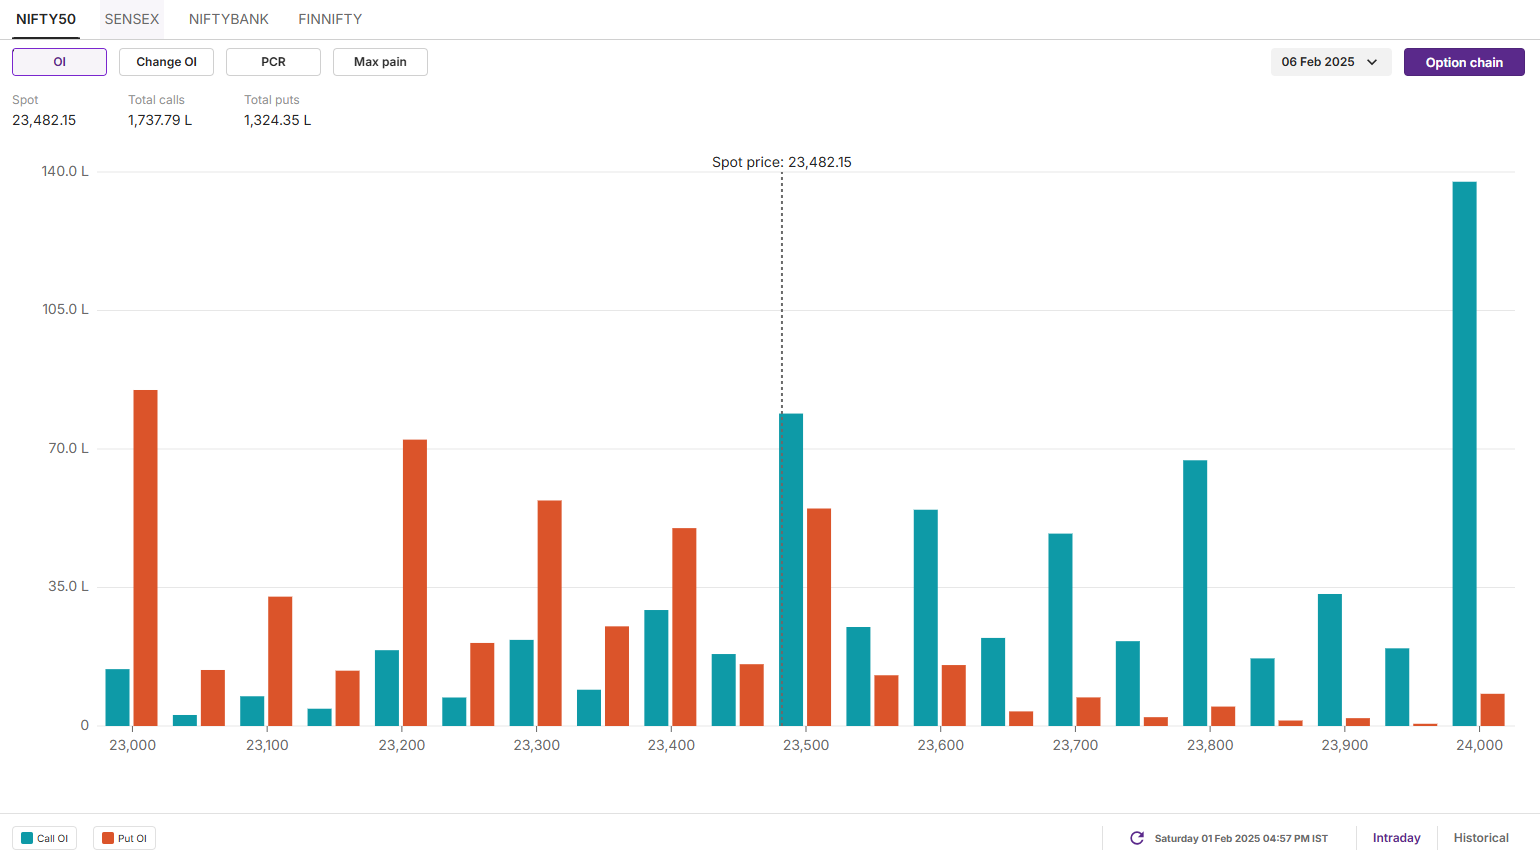
The open interest (OI) data for the 6 February expiry saw significant call OI at the 24,000 strike, indicating resistance for the index around this level. On the flip side, the put base was seen at 23,000 strike with relatively low volume.
SENSEX:
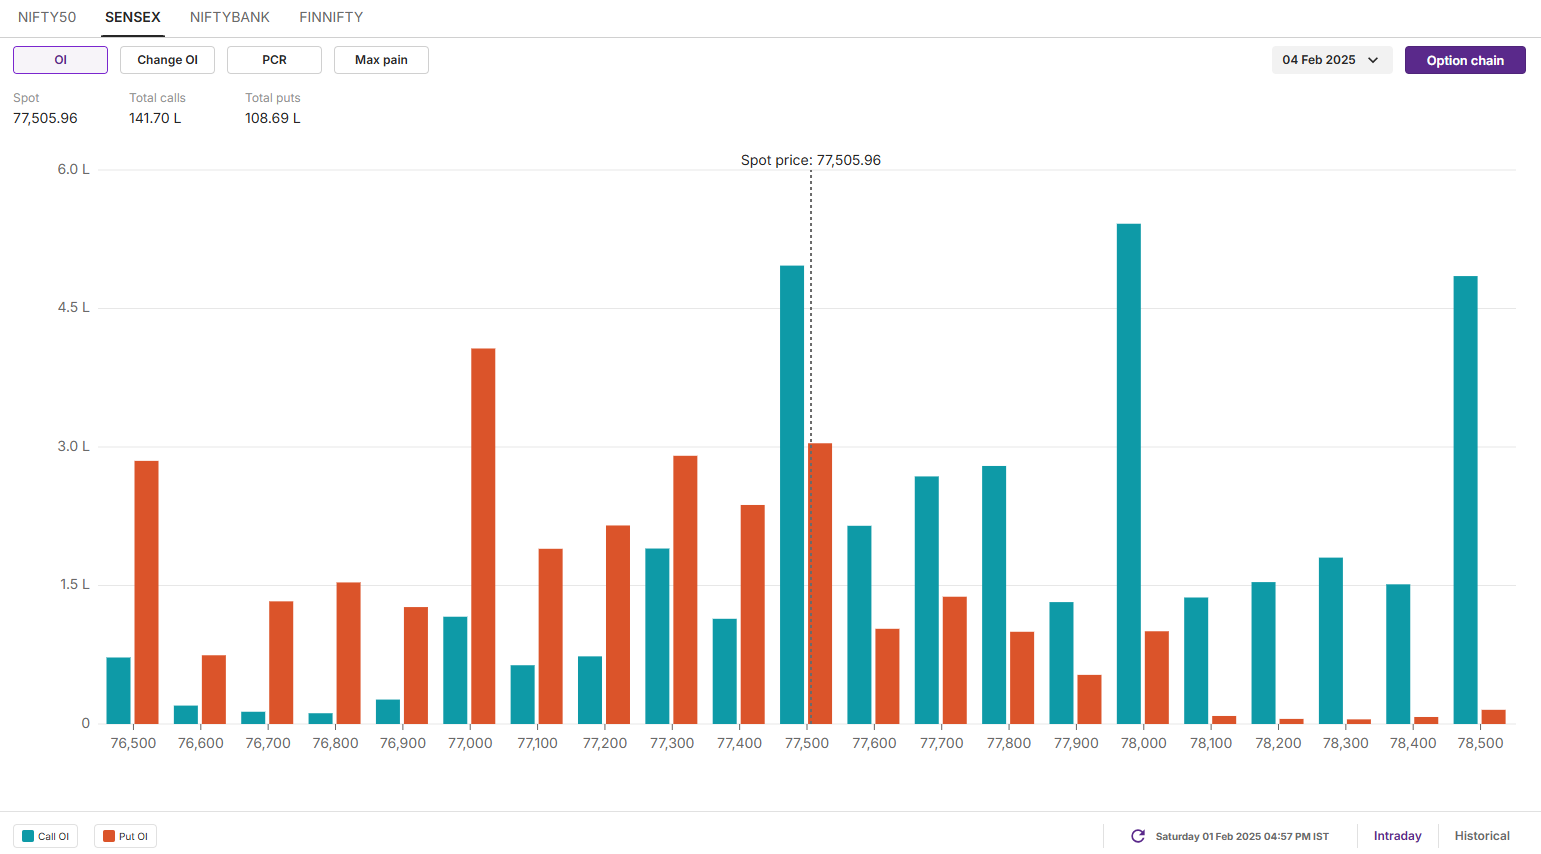
- Max call OI: 78,000
- Max put OI: 77,000
- (20 Strikes from ATM, Expiry: 28 Jan)
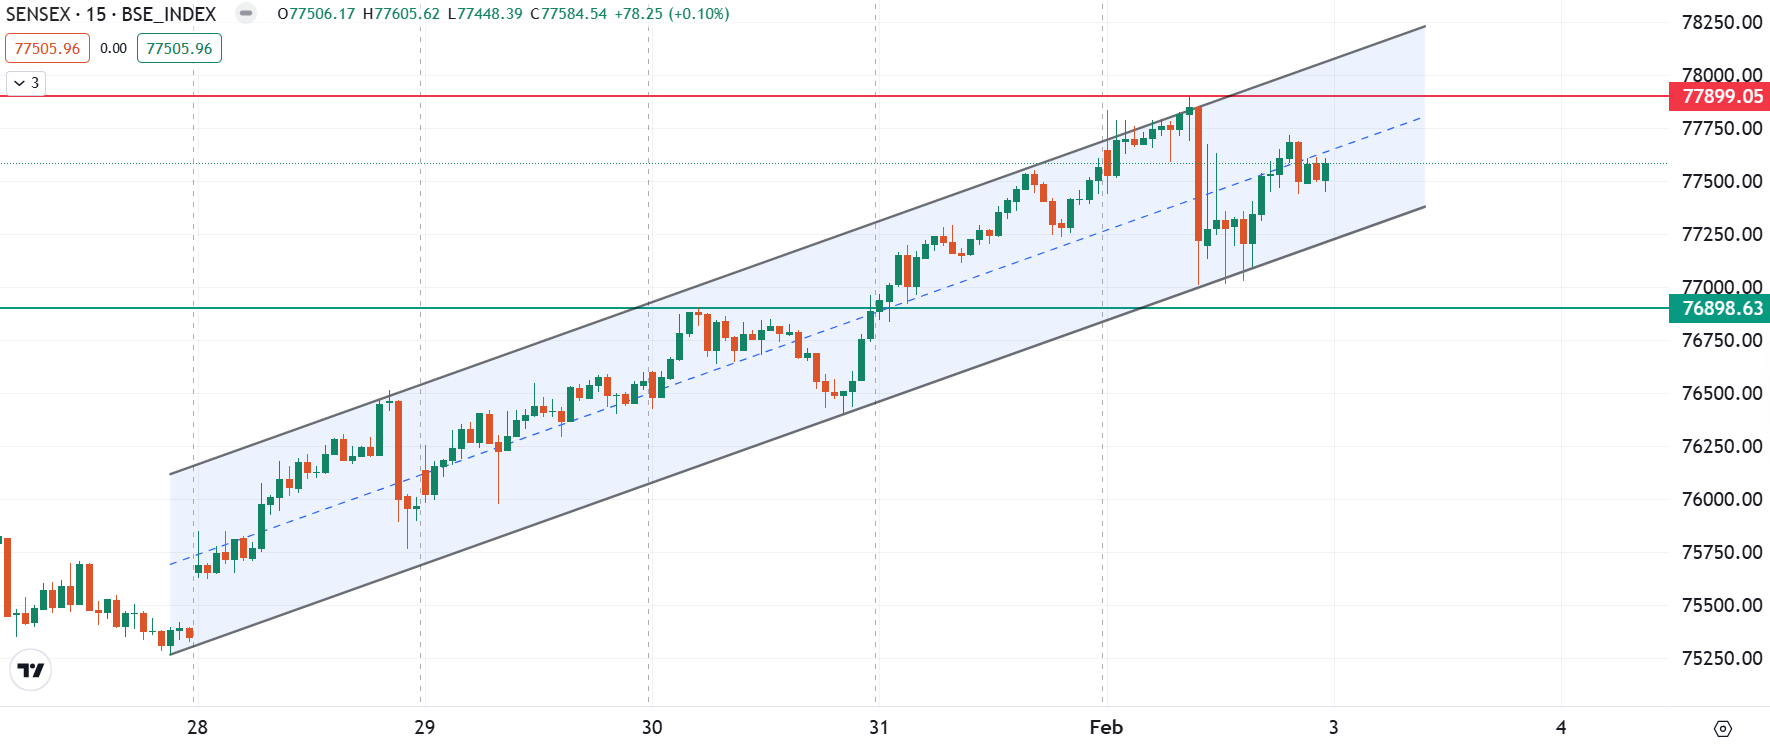
The SENSEX ended the Budget session on a negative note, snapping a four-day winning streak. The decline resulted in the formation of a doji candlestick pattern, signalling indecision among market participants. A decisive move above or below the high or low of the doji will provide further insight into the potential direction of the market.
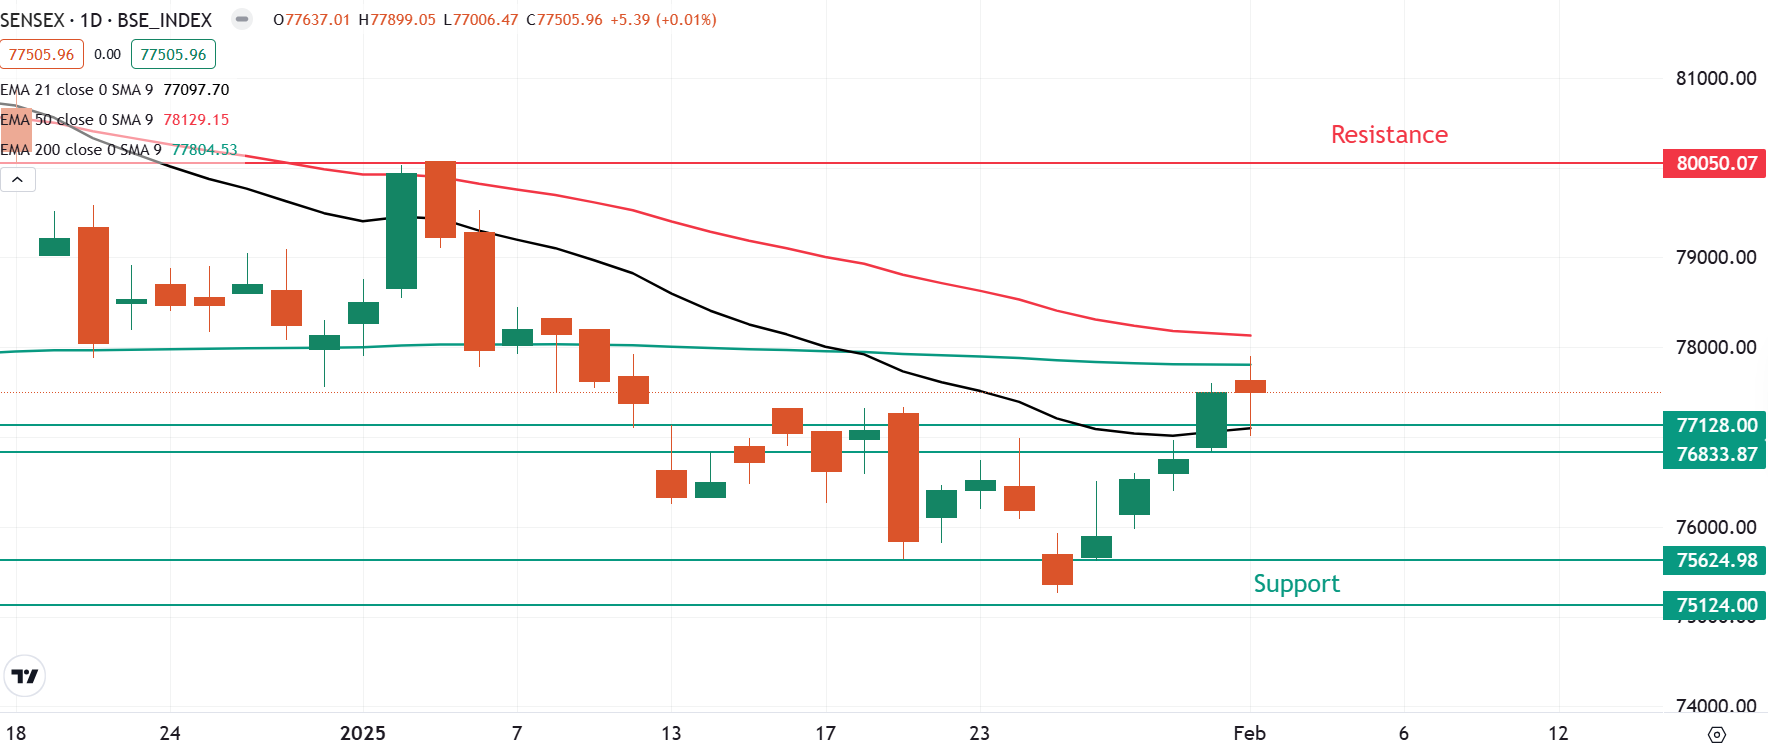
The technical structure of the index as per the 15 minute chart is oscillating within a rising channel, suggesting an ongoing short-term uptrend. However, the doji's uncertainty could signal a potential trend reversal or consolidation. A decisive break above the channel's resistance or below its support will provide directional cues.
The open interest (OI) data for the 4 February expiry saw significant call build-up at 78,000 strike, pointing at resistance for the index around this zone. Conversely, the put base was observed at 77,000 strike with lower volume, indicating support for the index around this area.
FII-DII activity
Stock scanner
- Long build-up: Avenue Supermarts (DMART), HFCL, Crompton Greaves and SBI Cards
- Short build-up: NCC, IRFC, JSW Energy, ABB and Supreme Industries
- Under F&O ban: Nil
In Futures and Options or F&O, long build-up means an increase in Open Interest (OI) along with an increase in price, and short build-up means an increase in Open Interest(OI) along with a decrease in price.
Source: Upstox and NSE.
Disclaimer: Derivatives trading must be done only by traders who fully understand the risks associated with them and strictly apply risk mechanisms like stop-losses. The information is only for consumption by the client and such material should not be redistributed. We do not recommend any particular stock, securities and strategies for trading. The securities quoted are exemplary and are not recommendatory. The stock names mentioned in this article are purely for showing how to do analysis. Take your own decision before investing.

About The Author
Next Story


