Market News
Trade setup for 24 July: Mixed signals on NIFTY50 and BANK NIFTY—Key levels to watch for today’s expiry
.png)
5 min read | Updated on July 24, 2024, 09:10 IST
SUMMARY
The NIFTY50 and BANK NIFTY has sent mixed signals on the daily chart post announcement of the Union Budget. The NIFTY50 has formed a bullish reversal hammer pattern, while the BANK NIFTY has formed a bearish engulfing pattern. Traders should watch today's close for confirmation of these patterns and plan their strategies based on the follow-through price action.
Stock list
After a flat start, the NIFTY50 index slipped over 500 points from the day’s high during Finance Minister Nirmala Sitharaman’s budget day speech.
Asian markets update at 7 am
The GIFT NIFTY slipped 0.2%, indicating a negative opening for the Indian equities today. In contrast, other Asian markets are showing mixed performance. Japan’s Nikkei 225 remains flat, whereas Hong Kong’s Hang Seng index has edged up by 0.1%.
U.S. market update
- Dow Jones: 40,358 (▼0.1%)
- S&P 500: 5,555 (▼0.1%)
- Nasdaq Composite: 17,997 (▼0.0%)
U.S. markets ended the choppy session lower, with indices fluctuating between gains and losses. After the market hours, Tesla shares fell on disappointing Q2 earnings and margins. In contrast, Alphabet (Google) reported strong results, beating Street estimates on both the top and bottom lines, with increased spending in its cloud and AI businesses.
NIFTY50
- July Futures: 24,463(▼0.2%)
- Open Interest: 4,65,124 (▼12.3%)
After a flat start, the NIFTY50 index slipped over 500 points from the day’s high during Finance Minister Nirmala Sitharaman’s budget day speech. The hike in short and long-term gains tax created intraday jitters, leading to a sharp decline.
However, the government’s containment of the fiscal deficit to 4.9% for FY25 alleviated intraday concerns. This targeted fiscal deficit for the FY25 is notably lower than the 5.1% projected in the interim budget.
On the daily chart, the index has formed a bullish hammer and has seen significant buying from the 24,000 level. The hammer is a bullish reversal pattern with a long wick. The pattern indicates that sellers pushed the price lower during the day, but buyers regained control and pushed the price closer to the opening level at the close.
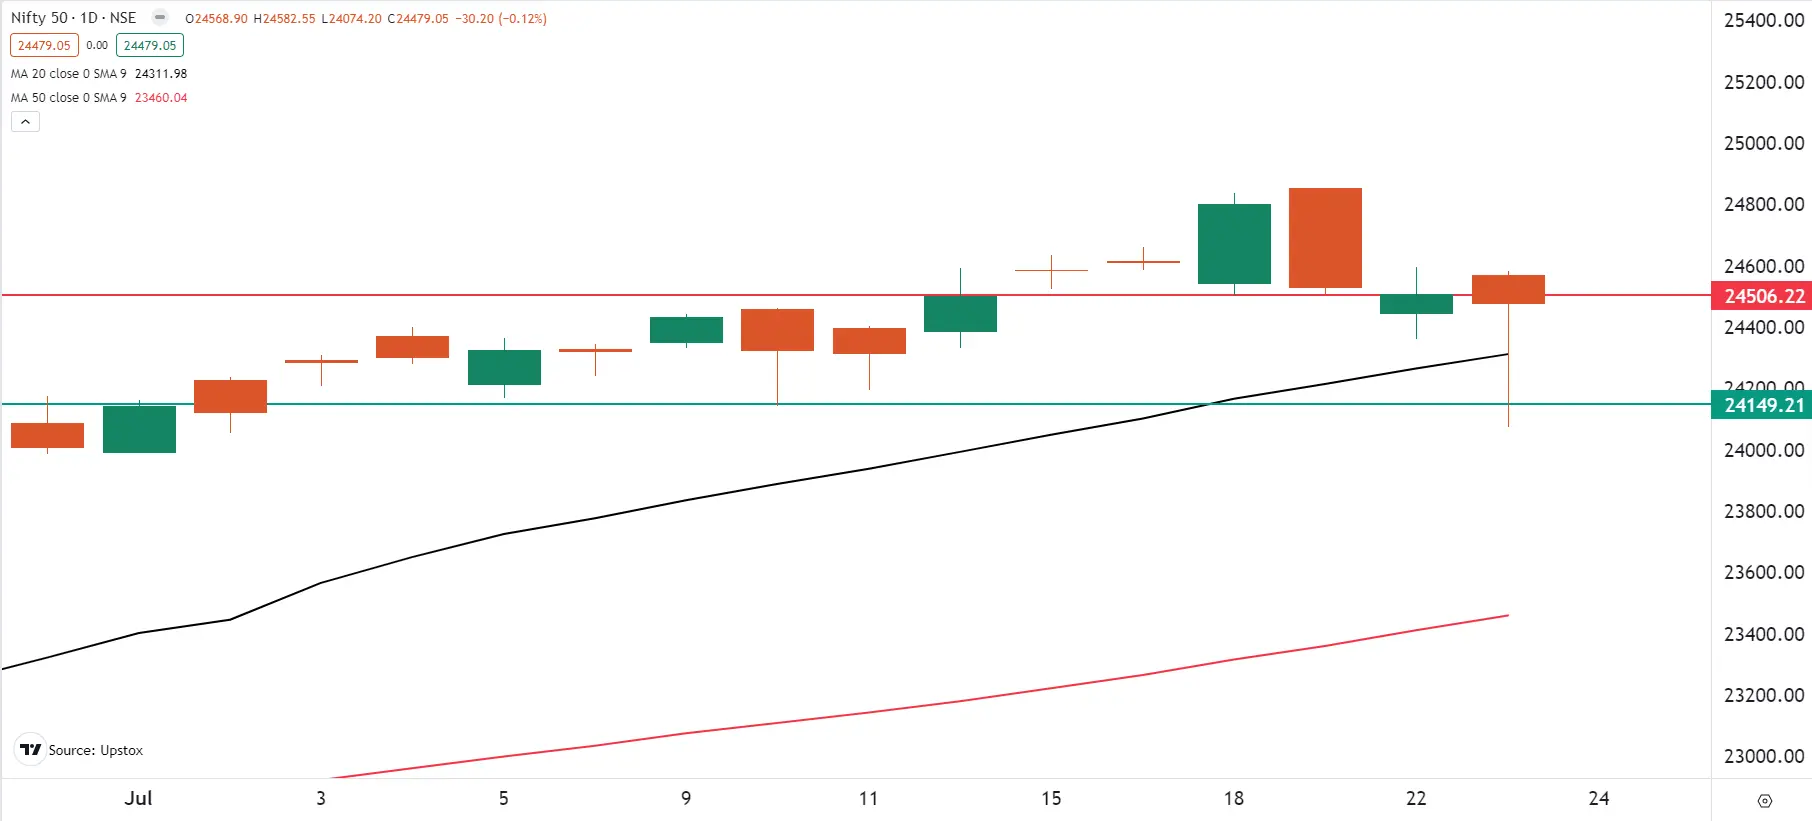
In the coming sessions, if the index closes above the bullish reversal pattern, it will confirm the hammer pattern and lead to further bullishness. However, a negative close will signal weakness and increased volatility for the index.
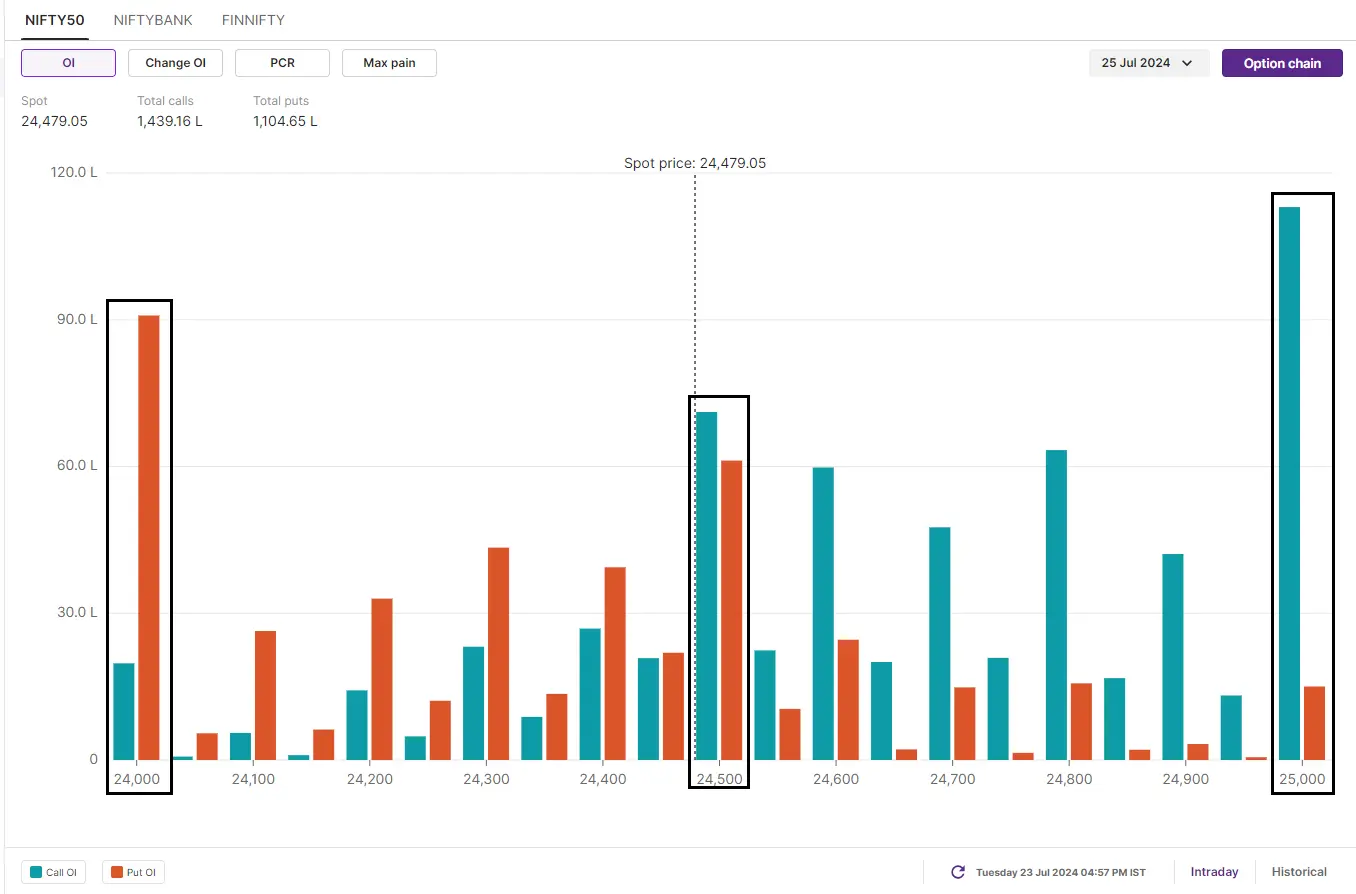
Open interest activity for the 25 July expiry has the highest call and put bases at 25,000 and 24,000 strikes. This suggests that the index could trade within this range during the monthly expiry. In addition, there has been significant placement of both call and put options at the 24,500 strike, suggesting consolidation around this level.
BANK NIFTY
- July Futures: 51,818 (▼1.0%)
- Open Interest: 1,07,498 (▼10.2%)
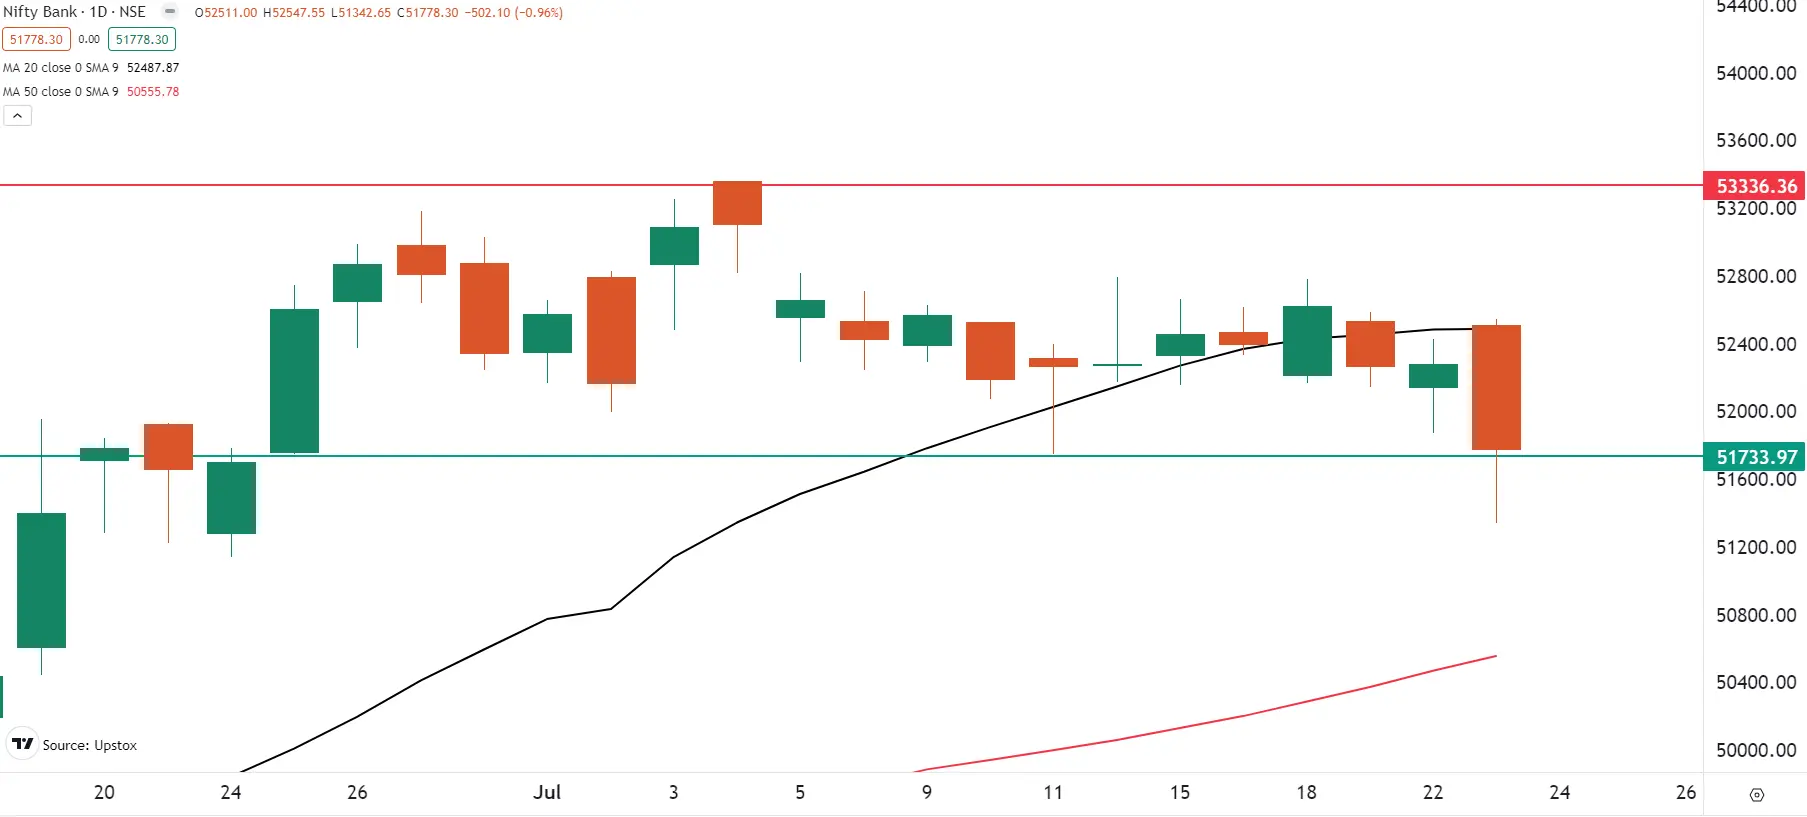
The BANK NIFTY index also witnessed significant volatility and slipped below the crucial support levels of 52,000 and 51,700 levels during the budget speech. The index closed below its crucial 20-day moving average (DMA) and formed the bearish engulfing pattern on the daily chart.
With the formation of bearish engulfing on the daily chart, the short-term trend of the index has turned weak as it closed below the psychologically crucial 52,000 mark. However, it is important to note that the bearish reversal pattern will be confirmed if the close of the subsequent candle is lower than the bearish pattern.
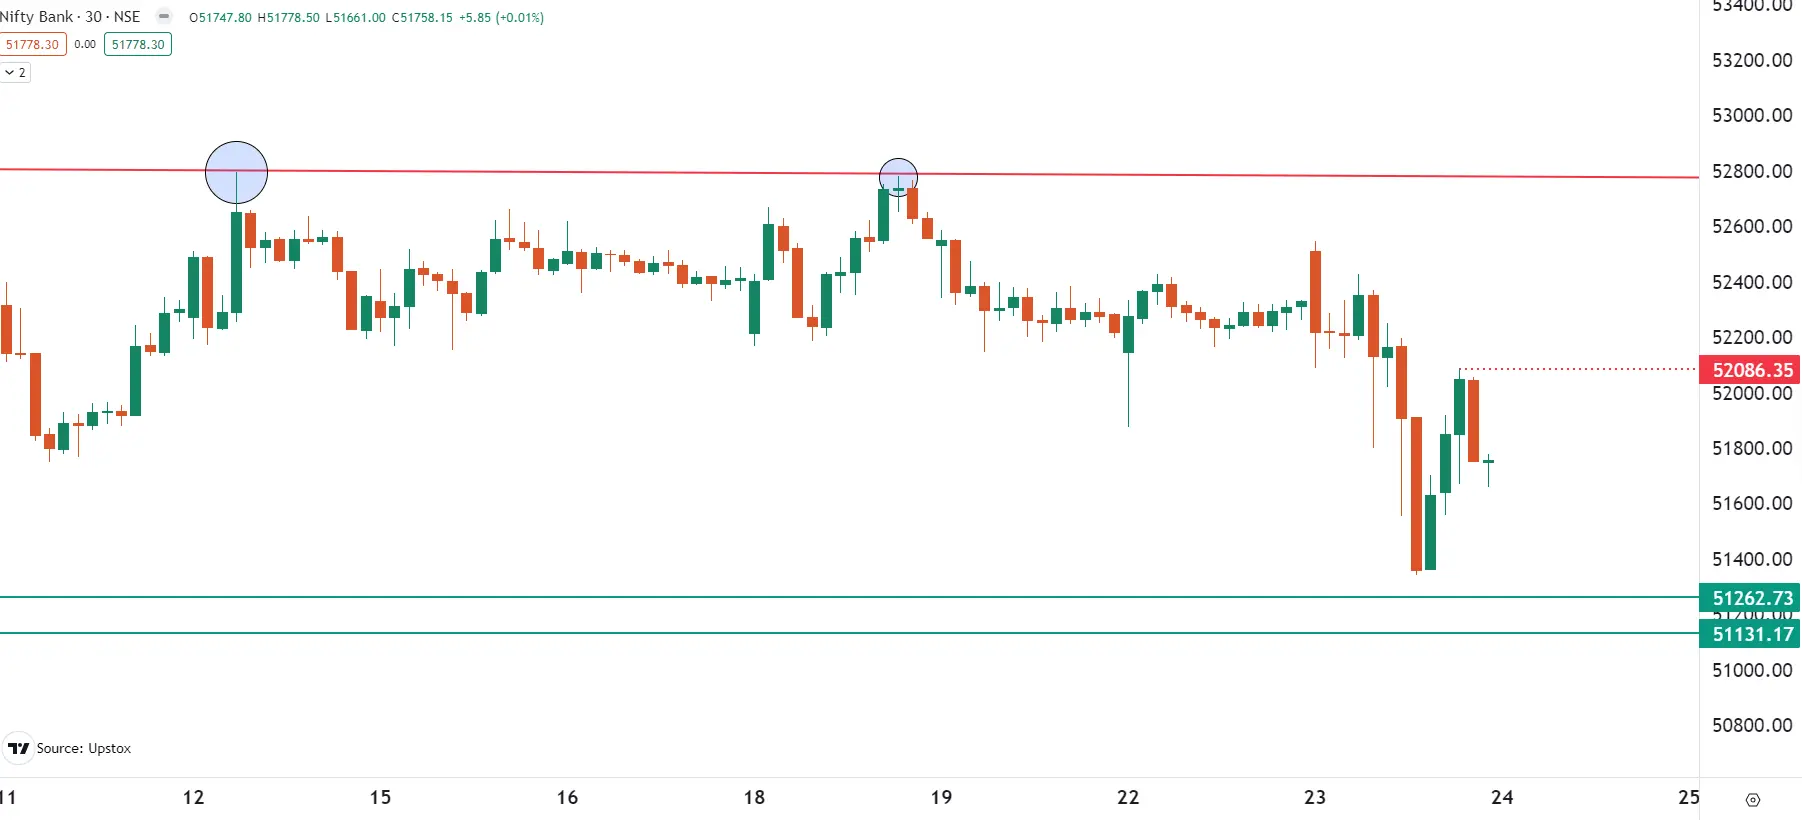
For today's expiry, we have highlighted important trading ranges and key levels on the 30-minute timeframe. As you can see on the chart below, the 52,800 area has repeatedly acted as resistance for the index. Meanwhile, key support for today's expiry is around the 51,000 level. Until the index breaks below this level, it may remain range-bound. On the other hand, if the BANK NIFTY breaches the 52,100 level, it may attempt to retest the 52,800 level.
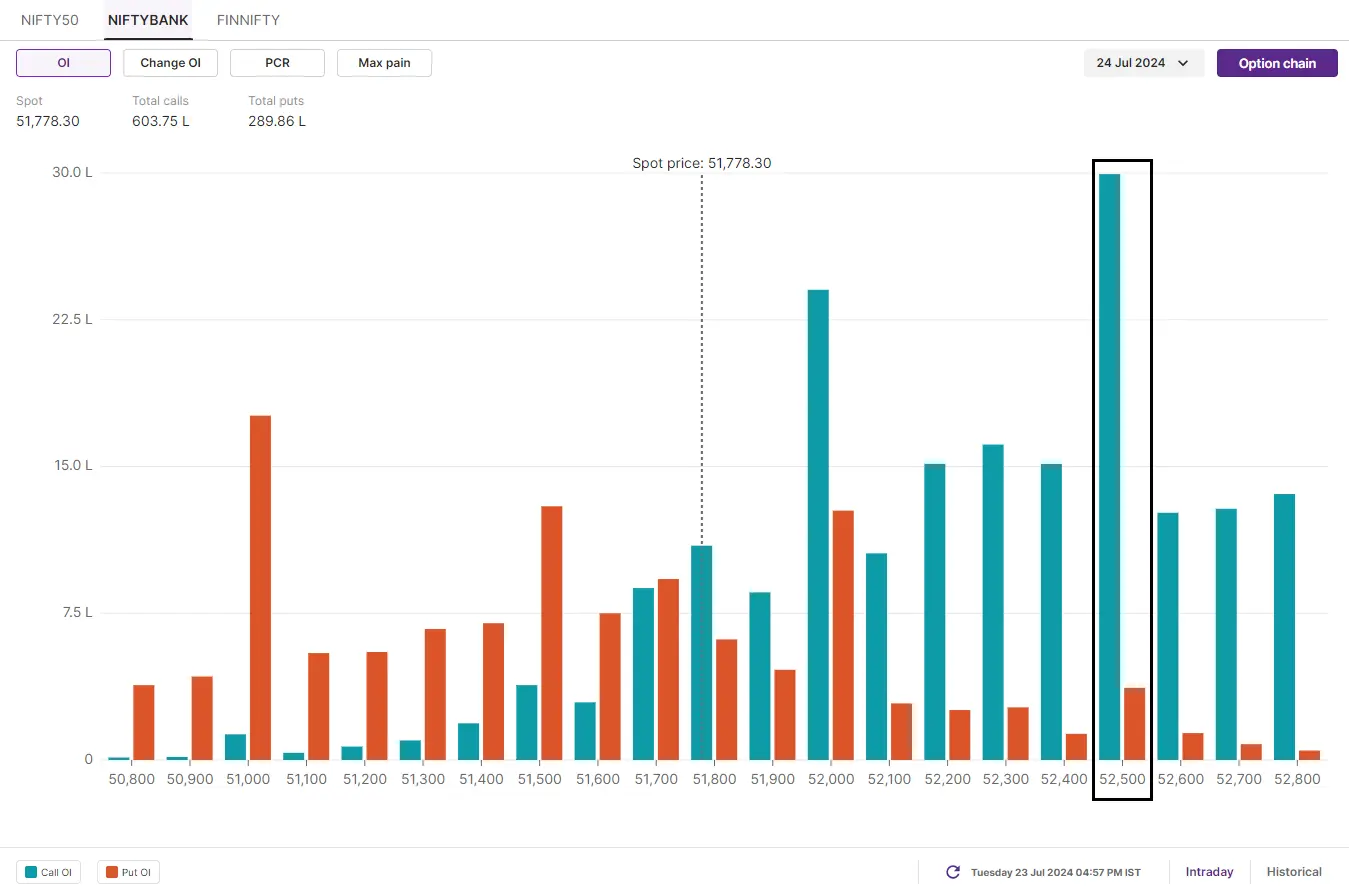
Open interest for today's expiry (24 July) has seen a significant increase in calls from 52,500 to 53,000 strikes. This suggests that the index may face resistance around these levels. On the other hand, the put base has accumulated 51,000 and 50,000 strikes, pointing support for the index around these zones.
FII-DII activity
Stock scanner
Under F&O ban: Gujarat Narmada Valley Fertilisers & Chemicals, India Cements and Steel Authority of India
In Futures and Options or F&O, long build-up means an increase in Open Interest (OI) along with an increase in price, and short build-up means an increase in Open Interest(OI) along with a decrease in price.
Source: Upstox and NSE.
Disclaimer: Derivatives trading must be done only by traders who fully understand the risks associated with them and strictly apply risk mechanisms like stop-losses. The information is only for consumption by the client and such material should not be redistributed. We do not recommend any particular stock, securities and strategies for trading. The securities quoted are exemplary and are not recommendatory. The stock names mentioned in this article are purely for showing how to do analysis. Take your own decision before investing.
About The Author
Next Story
