Market News
NIFTY50 rebounds after two-month decline: Market breadth analysis of NIFTY50, NIFTY Midcap 100 and NIFTY Small-Cap 100 constituents
.png)
4 min read | Updated on December 13, 2024, 15:41 IST
SUMMARY
Indian equity indices, including NIFTY50, exhibit improved market breadth as stocks trading above their important exponential moving averages (DEMA) increase. In December the market saw a recovery after two months of declines, driven by FIIs and strength in banking and IT stocks. NIFTY Mid-cap 100 and NIFTY Small-cap 100 indices also show a positive trend with rising breadth indicators

NIFTY50 rebounds after two-month decline: Market breadth analysis of NIFTY50, NIFTY Midcap 100 and NIFTY Small-Cap 100 constituents
Indian equity market recovered from the level of 23,300 after the landslide victory of the BJP-led Mahayuti alliance in Maharashtra state elections. This provided a sense of relief among the market participants after a mismatch in the Lok Sabha election outcome and exit polls. Recently, a jump in IT stocks was seen amid recession fears in the U.S. economy have subsidized after the job market staged a rebound in November. An improved U.S. economy is supportive of Indian IT companies as they earn a significant share of revenue from the U.S.
Currently, NIFTY50 is trading near the 24,600 mark, above all important exponential moving averages. Considering the NIFTY50 index is back on the bullish trajectory after the longest correction occurred in October after March 2023. Let’s understand, from the lens of a popular breadth indicator, how the constituents are placed.
Market Breadth Analysis (NIFTY50)
The number or percentage of stocks trading above their exponential moving averages (DEMA) is a widely used breadth analysis. It is to determine whether the underlying sector/index is bullish or bearish.
Below is the chart of the NIFTY50 index, along with a chart in the lower pane that shows the number of stocks trading above 20, 50 and 200-DEMA.

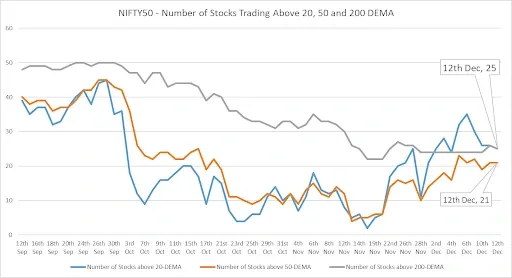
Number of stocks trading above 20, 50 and 200-day EMA (NIFTY50),
Among the 50 constituents of the NIFTY50, 50% or 25 stocks are trading above their respective 200-DEMA as of December 12, 2024.
As of Thursday, 25 stocks are trading above the 20-day exponential moving average, 21 stocks are trading above a 50-day exponential moving average, and 25 stocks are trading above the 200-day exponential moving average amongst constituents of NIFTY50.
As shown in the chart above, the market breadth seems to be strengthening since the bottom of November. The market breadth of NIFTY50 is recovering as the number of stocks above 20 and 50 DEMA is rising.
Market Breadth Analysis (NIFTY Mid-cap 100)
As of Thursday, December 12, 2024, in the NIFTY Mid-cap 100 index, 72 stocks are trading above their 20-day exponential moving average, 62 stocks are above their 50-day exponential moving average, and 61 stocks are above their 200-day exponential moving average. These figures highlight the performance trends among the constituents of the NIFTY Mid-cap 100.
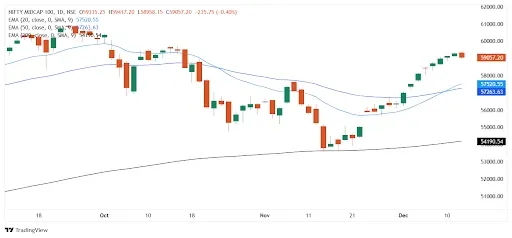
As shown in the chart below, the market breadth of the NIFTY Midcap index has also gained strength, with 61 stocks (61%) trading above their respective 200-DEMA. On November 21, the NIFTY Mid-cap 100 marked its lowest breadth, with 43 stocks trading above 200-DEMA, registering the first instance in the last one year. Stocks recovered strongly changing the course in December crossing 20 and 50 DEMA as clearly visible on the chart below.
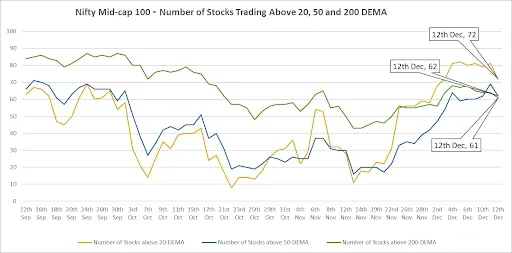
Mid Cap 100 - Number of Stocks Trading above 20, 50 and 200 DEMA
Market Breadth Analysis (NIFTY Small-cap 100)
As of Thursday, December 12, 2024, in the NIFTY Small-cap 100 index, 81 stocks are trading above their 20-day exponential moving average, 73 stocks are above their 50-day exponential moving average, and 68 stocks are trading above their 200-day exponential moving average. These figures reflect the performance trends among the constituents of the NIFTY Small-cap 100 index.
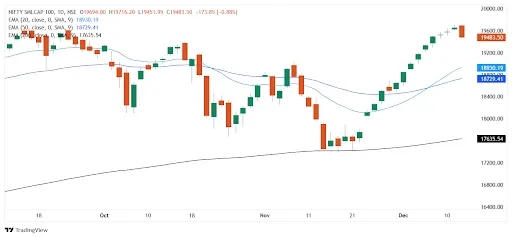
As shown in the chart below, the market breadth of the NIFTY Small-cap 100 index has also gained strength, with 68 stocks (68%) trading above their respective 200-DEMA. On November 21, the NIFTY Small-cap 100 marked its lowest breadth, with 36 stocks trading above 200-DEMA, registering the first instance in the last one year. Stocks recovered strongly changing the course in December crossing 20 and 50 DEMA as clearly visible on the chart below.
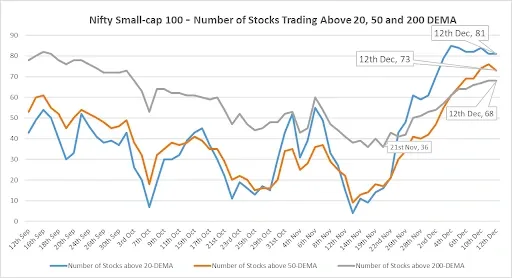
NIFTY Small-cap 100 - Number of Stocks Trading above 20, 50 and 200 DEMA
Following two months of declines, the NIFTY50 has increased by 1.85% in December, signalling a revival in market activity and gained 13% to date this year. After hitting a low of 23,263.15 level, it has bounced back by 5.85%.
At present, NIFTY appears to be consolidating with a slightly upward bias. The return of foreign institutional investors (FIIs) has strengthened large-cap stocks in the banking and IT sectors, enhancing the overall market sentiment. Retail investors, who have been cautious following a 10% drop, are starting to regain their confidence. Testament to this is the NIFTY Small-cap 100 index hitting a fresh all-time high. With FIIs acting as net buyers, the market breadth seems to be improving.
About The Author
Next Story

