Market News
Comparison of Tata Motors and Maruti Suzuki and their future outlook
.png)
5 min read | Updated on December 05, 2024, 15:05 IST
SUMMARY
India’s PV market grew a meagre 0.5% in H1FY25, the festive demand and rural sentiment indicate strong H2 growth, reflected in November’s auto sales number with Maruti’s total sales unit growing 10.39%. Here’s a financial comparison between Maruti Suzuki and Tata Motors who will steer the sector ahead.

India's auto king: Comparison of Tata Motors and Maruti Suzuki and their future outlook
The Indian passenger vehicle (PV) market saw subdued growth in H1FY25, with a growth of merely 0.5%, according to the Society of Indian Automobile Manufacturers (SIAM).
Maruti Suzuki India Ltd
As India’s largest passenger vehicle manufacturer the company is engaged in manufacturing and selling PVs and CVs.The company has a market capitalisation of ₹3,55,124 crore. Maruti Suzuki has a dominant market share of 41.33% in the PV segment as of October 2024. It also holds a 5.38% market share in the CV segment.
Tata Motors Ltd
Tata Motors is the oldest and leading manufacturer of automobiles offering a wide range of smart and e-mobility solutions. It leads the CV market with 31.37% share and ranks third in the PV market share with 13.46% as of October 2024. Tata Motors trades with a market capitalisation of ₹2,92,013 crore and is a key player in the global automotive industry with brands like Jaguar Land Rover.
Q2FY25 Highlights
During this period, Maruti Suzuki reported a marginal revenue increase of 0.29% YoY to ₹37,449 crore. The net profit stood at ₹3,102 crore, down 18% YoY. The net profit margin was 8.28 %, lower than 10.14% in September 2023.
Tata Motors saw a 3.5% YoY revenue drop to ₹1,01,450 crore and a 9.97% YoY decline in net profit to ₹3,450 crore. The net profit margin also decreased to 3.40%.
Maruti Suzuki India vs Tata Motors - Revenue and Profit (2020-2024)
| Revenue (₹ crore) | 2020 | 2021 | 2022 | 2023 | 2024 |
|---|---|---|---|---|---|
| Maruti Suzuki India | 75,660 | 70,372 | 88,330 | 1,18,410 | 1,41,858 |
| YOY Growth | -6.99% | 25.52% | 34.05% | 19.80% | |
| Tata Motors | 261,068 | 249,795 | 2,78,454 | 3,45,967 | 4,37,928 |
| YOY Growth | - | -4.32% | 11.47% | 24.25% | 26.58% |
Source: Screener.in
Maruti Suzuki and Tata Motors have rapidly grown their businesses over the last five years, with Maruti’s revenue doubling since FY21, while Tata Motor's grew 75% in three years. Both witnessed a dip in H1FY25 but these companies will grow in H2 due to the festive and wedding season, improved rural demand and sales promotional efforts.
| Profit After Tax (₹ crore) | 2020 | 2021 | 2022 | 2023 | 2024 |
|---|---|---|---|---|---|
| Maruti Suzuki India | 5,678 | 4,389 | 3,880 | 8,264 | 13,488 |
| Tata Motors | -11,975 | -13,395 | -11,309 | 2,690 | 31,807 |
Maruti’s operating margin improved to 13% in FY24, benefiting net profit margins to 9.51%, which was also supported by higher other income. Tata Motors also improved its operating margin to 13%, leading to a 7.26% net profit margin, aided by reduced taxation.
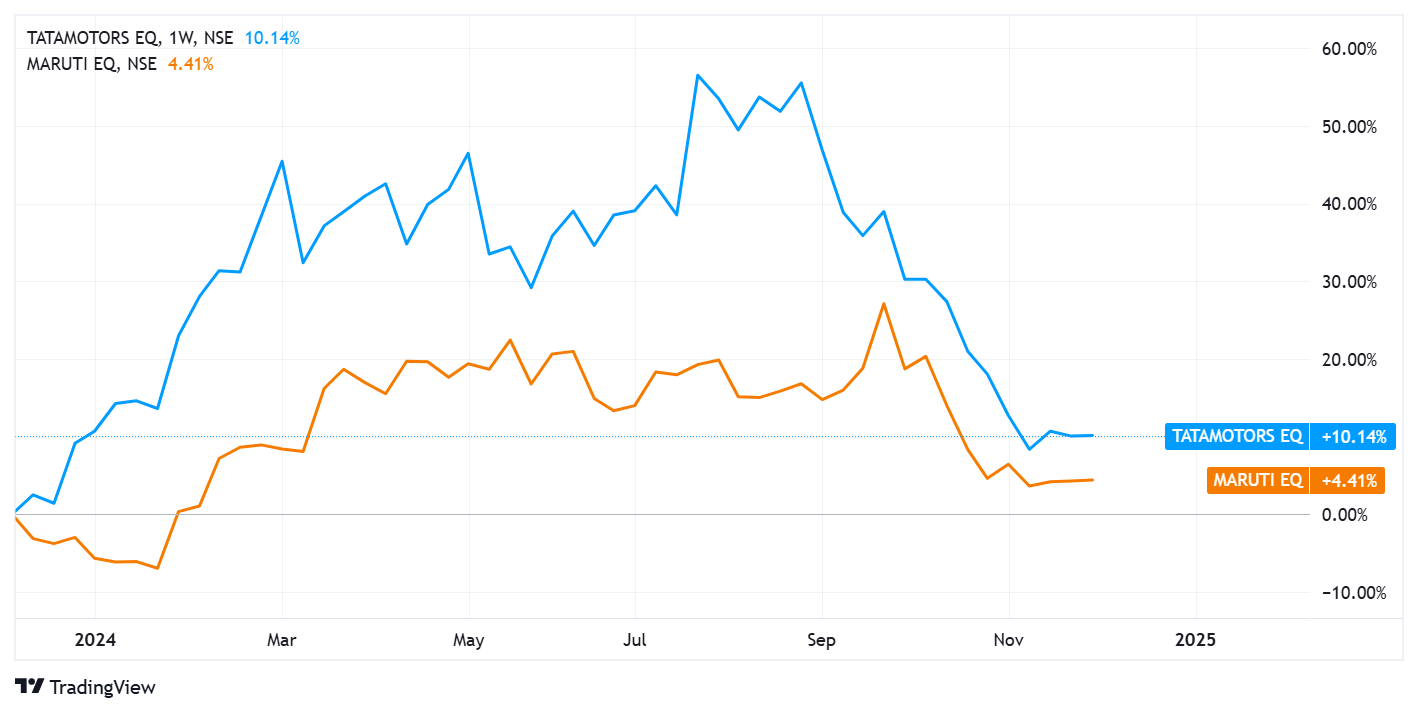
Stock Price Performance
 Source: Upstox Pro, Data as of December 05, 2024
Maruti Suzuki has gained 4.1% in a year and 48% in three years but recently corrected 8%. Tata Motors, after a 29% recent correction, delivered 11.5% in a year and 69.33% in three years.
Profitability and Efficiency (ROE and ROCE)
| Parameters | Maruti Suzuki India | Tata Motors |
|---|---|---|
| Return on equity (%) | 16.8% | 49.4% |
| Return on capital employed (in %) | 21.8% | 20.1% |
Both Maruti and Tata Motors are operating efficiently as reflected through the return on capital employed. Tata Motors has a substantially higher return on equity due to the financial leverage (higher Debt to Equity ratio) it has but it also increases its financial risk.
Debt to Equity Ratio
Maruti Suzuki is almost debt-free except for lease liability. Tata Motors has a debt-to-equity ratio of 1.05x, indicating a significant debt which it has reduced over the period with the company's borrowing at ₹1,06,549 crore for the period ended September 2024.
Valuations (P/E, EV/EBITDA and PEG)
Maruti Suzuki - P/E = 25x, EV/EBITDA - 14.1x, PEG Ratio - 1.41x
Tata Motors - P/E = 8.61x, EV/EBITDA - 5.47x, PEG Ratio - 0.09x
The industry PE is at 20x.
Maruti’s strong market position justifies its premium valuation. Tata Motors despite recent improvement, remains trades will lower the P/E multiple, offering an opportunity to invest in its turnaround efforts and growth potential.
Outlook
The festive and wedding season along with new launches are perceived to drive retail demand for Maruti and Tata Motors. Maruti expects inventory levels to normalise and an uptick in demand in the coming period. Tata Motors anticipates the easing of supply constraints, robust commercial vehicle demand, and improved Jaguar Land Rover performance. Tata Motors will also aim for net-debt free by FY25 end.
Conclusion
Maruti maintains its leadership in PV with a dominant market share, but Tata Motors is growing fast with a focus on SUVs and EVs. In recent quarters both companies have witnessed profit dips, but long-term growth prospects remain intact. Maruti’s strong position reflects a higher valuation, but Tata Motor offers an attractive valuation amid its turnaround efforts and growth prospects.
About The Author
Next Story

