Market News
Q3 earnings strategy: Will TCS end its seven-day consolidation streak post December quarter results?
.png)
4 min read | Updated on January 09, 2025, 08:20 IST
SUMMARY
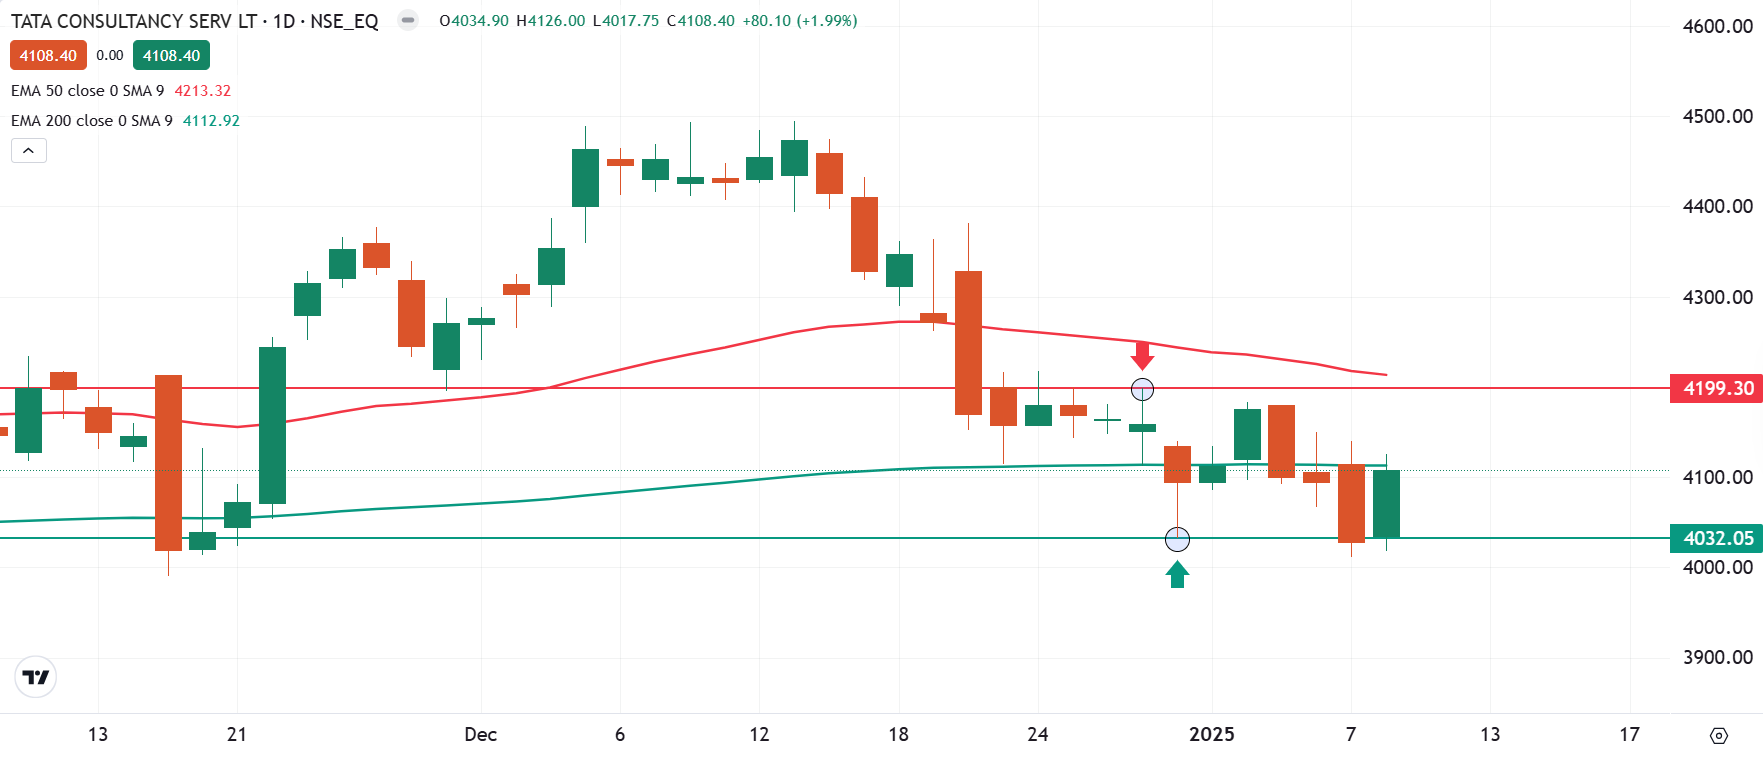
The technical structure of the TCS has remained range-bound for the last seven trading sessions. TCS is hovering between ₹4,199 and ₹4,032, and a break of this range will provide further directional clues.
Stock list

Investors will closely watch TCS’s new deal wins and management’s commentary on the business outlook during the third quarter results.
TCS is likely to report a flat to 1% QoQ drop in its revenue from operations during the December quarter. The revenue is expected to remain between ₹64,150 to ₹64,250 crore. Revenue could take a hit due to higher furloughs during the Christmas and New Year, coupled with subdued momentum in new deal wins.
Despite a marginal revenue fall, the IT major may report a 3-4% rise in net profit sequentially. Net profit could remain in the range of ₹12,280 to ₹12,350 crore. According to experts, net profit growth will be aided by higher EBIT margins due to the rupee's depreciation compared to the U.S. dollar, improved operational efficiencies and the absence of additional costs as the company already took wage hikes in Q1FY25.
Investors will closely watch TCS’s new deal wins and management’s commentary on the business outlook during the third quarter results. Another key monitorable will be the impact on business and clients' spending post-Fed rate cut in the previous quarter.
Ahead of the Q3 result announcement, TCS shares closed 1.9% higher at ₹4,108 per share on Wednesday, January 8. So far this month, TCS shares are trading flat, while they rose 7.95% in the calendar year 2024.
Technical view
The technical structure of the Tata Consultancy Services (TCS) as per the daily chart looks weak. It is trading below its 50-day exponential moving average (EMA) along with its 200 EMA, which is considered as the psychologically crucial support zone.
Positional traders can monitor the range of ₹4,199 and ₹4,032. TCS has been consolidating in this range for the past seven trading sessions. A breakout from this zone will prvoide further directional clues.

Options build-up
The open interest data for the 30th January expiry saw significant call concentration around 4,200 and 4,300 strikes, suggesting resistance for TCS around this zone. Conversely, the put base was seen at 4,000 and 3,800, indicating support in these zones.
Meanwhile, TCS’s 30 January ATM strike is at 4,100, with both call and put options priced at ₹215. This indicates that the traders are expecting a price movement of ±5%. However, let's take a look at TCS’s historical price behaviour during past earnings announcements in order to make more informed trading decisions.

Options strategy for TCS
With the options market projecting a potential price movement of ±5% for TCS by 30th January, traders have an opportunity to leverage this anticipated volatility. Depending on your market outlook, you can consider either a long straddle or a short straddle strategy to align with your expectations.
For a deeper dive into Straddles, explore our UpLearn educational content for comprehensive insights. Interested in historical earnings price data? Join our community and connect with us—we’d be delighted to share it with you!
About The Author
Next Story

