Market News
HDFC Bank Q4 results: Check earnings preview and technical structure ahead of Q4FY25 results
.png)
4 min read | Updated on April 18, 2025, 15:22 IST


SUMMARY
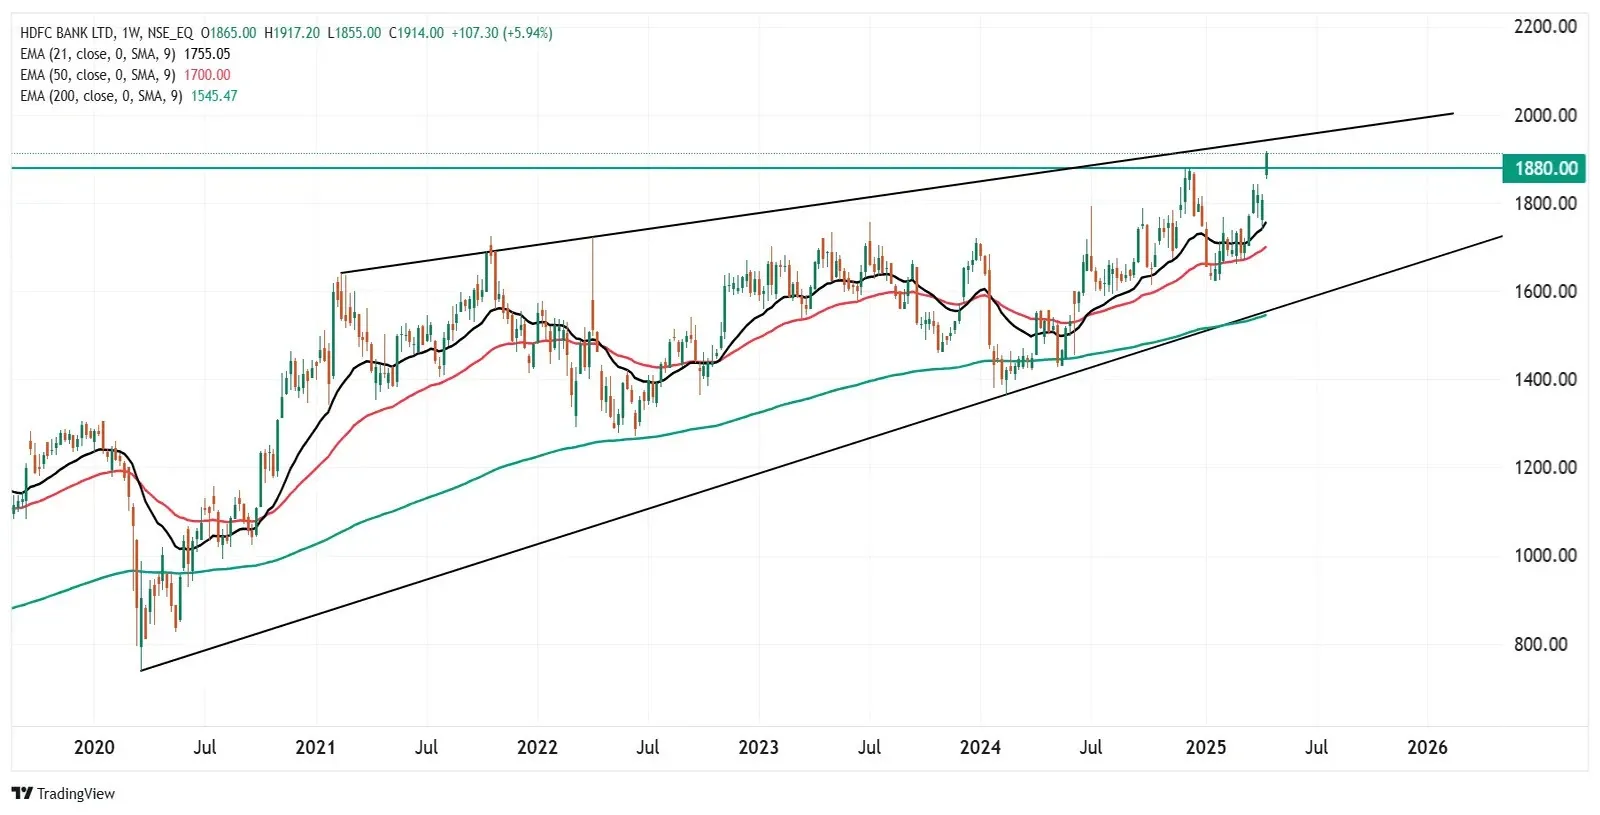
HDFC Bank’s price action is forming a rising wedge pattern, with the upper trendline acting as resistance and the lower as support. A breakout above the wedge backed by strong volume could signal further upside. However, if the stock fails to hold above ₹1,880 and forms a bearish candlestick, it may indicate a potential reversal.
Stock list
HDFC Bank recently hit a fresh all-time high after four months and is now trading above the crucial ₹1,880 resistance zone.
Q4 FY25 Business update
HDFC Bank reported a 5.4% year-on-year (YoY) increase in gross advances to ₹26.43 lakh crore during the fourth quarter. Deposits grew by 14.1% YoY to ₹27.14 lakh crore. Current account-savings account (CASA) deposits rose 3.9% YoY to ₹9.4 lakh crore.
According to analysts, HDFC Bank is expected to post a 1–4% YoY increase in net profit, in the range of ₹16,930 to ₹17,150 crore. On a sequential basis, net profit is likely to remain flat. Meanwhile, the Net interest income (NII) is projected to rise 5–6% YoY, while remaining flat quarter-on-quarter.
Investors will watch for management commentary on credit and deposit growth and closely track key performance indicators such as net interest margin and gross and net non-performing assets (NPAs).
Ahead of the Q4 results, HDFC Bank shares closed 1.5% higher at ₹1,906 per share on Thursday, April 17. Year-to-date, the stock is up 7.18%.
Technical view
HDFC Bank’s technical setup remains bullish on the weekly chart, with the stock trading above key support levels — the 21- and 50-week exponential moving averages (EMAs). It recently hit a fresh all-time high after four months and is now trading above the crucial ₹1,880 resistance zone. A weekly close above this level could trigger further upside momentum. However, if the stock fails to hold above ₹1,880 and forms a bearish candlestick pattern, it may signal a slowdown in the current rally.
It is important to note that the HDFC Bank is trading within the rising wedge pattern, defined by two upward-sloping trendlines. The upper trendline acts as resistance, while the lower one offers support. A breakout above the wedge with strong volume could confirm bullish momentum and open the door for further upside. However, rising wedges can also signal potential reversals—if the price fails to sustain above resistance and forms a bearish candle, a pullback toward the lower trendline is likely.
Options outlook
As of 1:51 PM on April 17, the options market is pricing in a ±2.5% move for HDFC Bank, based on the at-the-money (ATM) strike of ₹1,920. With implied volatility factored in, traders can consider strategies like long or short straddles, depending on their outlook for price movement and volatility.
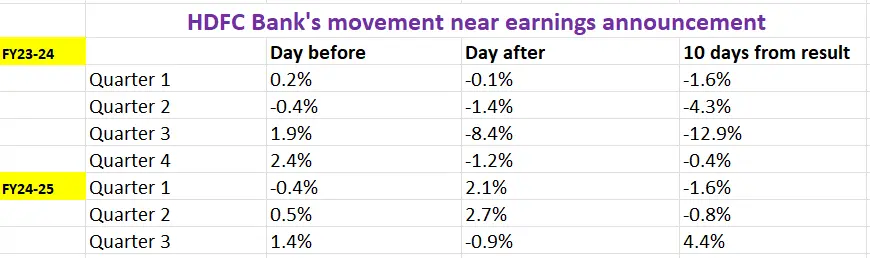
Before exploring strategy ideas, it’s worth reviewing how HDFC Bank's stock has reacted to earnings announcements over the past seven quarters.
With the options market pricing in a ±2.5% move for HDFC Bank ahead of the April 24 expiry, traders can explore straddle strategies to play this expected volatility.
Meanwhile, traders seeking directional approach to bullish or bearish options trading can explore directional spreads, which provide a refined alternative to simple option buying. If
-
For a bullish outlook and a close above the wedge pattern, traders can consider bull call spread. It involves buying a call option while simultaneously selling a higher strike call with the same expiration, reducing cost while capping potential gains.
-
Conversely, if you expect HDFC Bank to face resistance from the trendline of rising wedge pattern, you can consider a bear put spread strategy. It consists of buying a put option and selling a lower strike put, balancing risk and reward.
Disclaimer
Derivatives trading must be done only by traders who fully understand the risks associated with them and strictly apply risk mechanisms like stop-losses. The information is only for educational purposes. We do not recommend any particular stock, securities and strategies for trading. The stock names mentioned in this article are purely for showing how to do analysis. Take your own decision before investing.
About The Author
Next Story


