Stock market trends: Types of trends, factors how to spot strong trends and use them in trading
Written by Mariyam Sara
Published on October 01, 2025 | 3 min read


Change is the only constant, and the stock market is the best example of it. Every day, hour, and minute, the stock prices are constantly changing. And who is responsible for these price movements? The market participants, also known as the bulls and the bears.
In this blog, you will understand how share prices move in a stock chart, how to spot trends. and read the stock charts.
What is a trend in the stock market?
A trend is the direction a price moves from its past position. Every second, the buyers and sellers are constantly buying or selling shares, causing the price to rise and fall. This ebb and flow of the price creates a trend that helps in analysing market sentiment and stock performance. As sellers and buyers trade in the stock market, prices move in upward or downward directions.
Types of trends
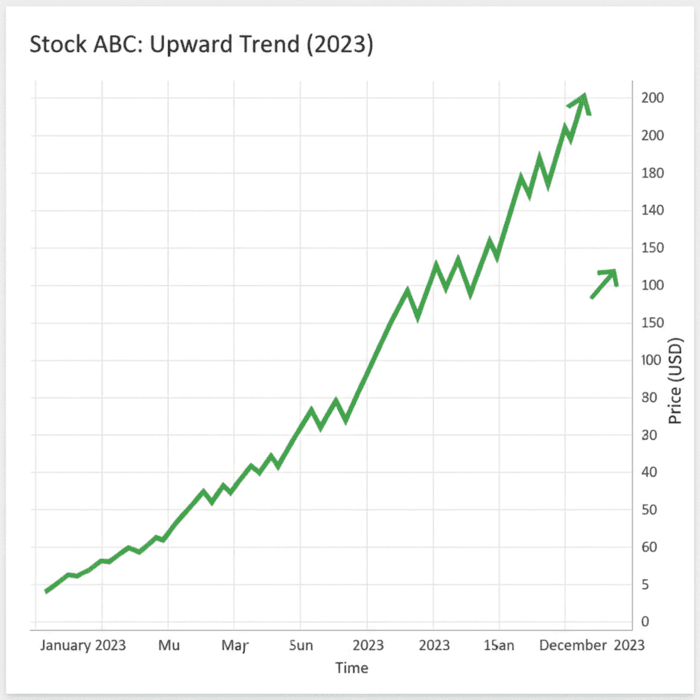
Uptrend
Let's understand what an uptrend looks like using a candlestick chart. When a green candlestick is formed, it shows that the share closed at a higher price than the previous day/hour.
This doesn’t mean that every candle has to be green to signal an uptrend. When you see a majority of green candles, that’s how you identify an uptrend. An uptrend means the bulls i.e, the buyers, are buying the share, causing the price to rise.
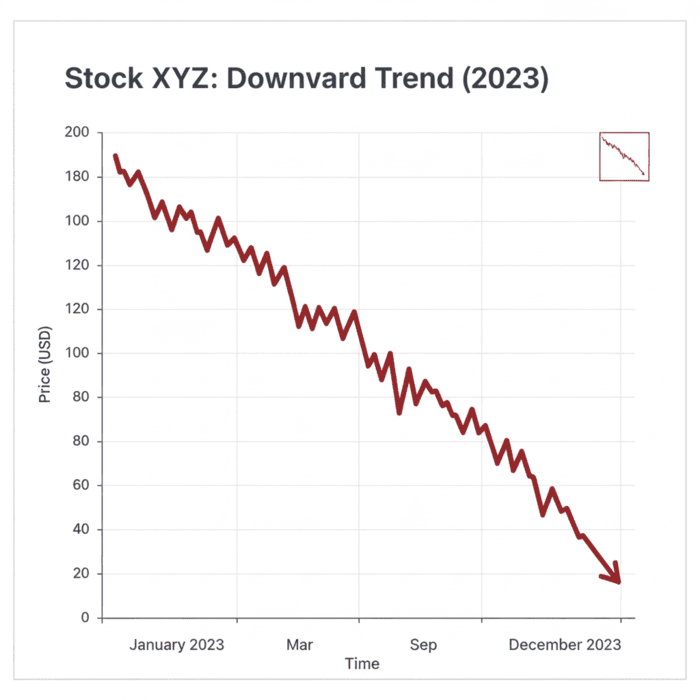
Downtrend
When the share price falls, you will observe the majority of red candlesticks forming, signaling a downtrend. This is observed due to the bears, i.e, the sellers selling their shares and pushing down the share price.
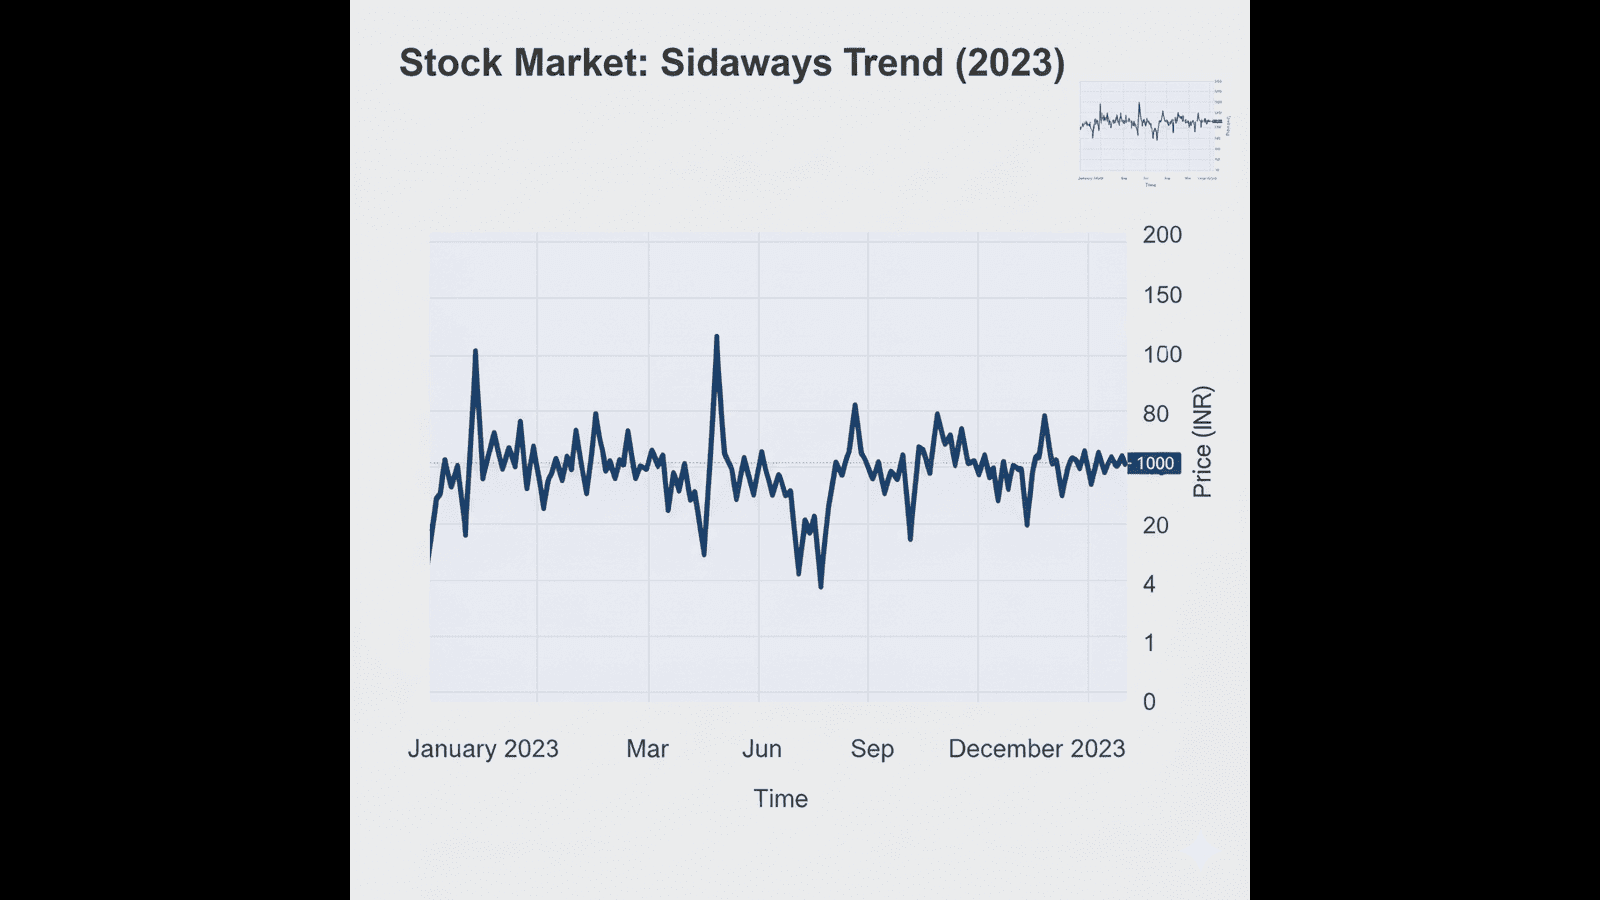
Sideway trend
As the name suggests, in sideways trends, the price moves sideways on a stock chart. In a sideways trend, the share price moves in a range of prices. When the price breaks out of a certain price range, it forms either an uptrend or a downtrend.
How to identify strong vs weak trends
Whenever you are following the price movement of a stock on a stock chart, simultaneously observe the trading volume.
Trading volume shows how many shares are exchanged in the stock market. When you open a stock chart, insert a trading volume feature. Analysing trading volume along with price will help you identify strong and weak trends.
Let’s understand it this way: when the share price falls, it means bears are selling, causing the fall, but to identify where there is a strong or weak trend, look at the trading volume. If the price is falling and with high trading volume, that is a strong downtrend.
Similarly, if the stock price is rising with increased trading volume, it means many traders are buying the share, marking a strong uptrend.
Factors impacting market trends
Other than the daily push and pull between the traders, there are other factors that influence market trends.
Government policies
Microeconomic factors like interest rate cuts by the RBI or changes in government tax policies can cause the stock market to move in an uptrend or downtrend.
Economic indicators
Economic indicators like unemployment rate, inflation, interest rate, and GDP (gross domestic product) impact market trends.
Global events
Global events like COVID-19 greatly affected the stock market, causing a downward market trend.
Political event
You must have noticed outcomes of major elections substantially impact the market trends, signifying the sentiments of the general public.
Geopolitics
Whenever geopolitical tensions rise, the stock market usually takes a hit. The recent India-Pakistan war led to a steep fall in Indian shares, causing a loss of $83 billion in just two days.

Identifying trends can help you spot favorable entry and exit points. Practise spotting strong and weak trends in the Nifty50 stock chart by signing up on TVUpstox Today!
About Author
Mariyam Sara
Sub-Editor
holds an MBA in Finance and is a true Finance Fanatic. She writes extensively on all things finance whether it’s stock trading, personal finance, or insurance, chances are she’s covered it. When she’s not writing, she’s busy pursuing NISM certifications, experimenting with new baking recipes.
Read more from Mariyam


Upstox is a leading Indian financial services company that offers online trading and investment services in stocks, commodities, currencies, mutual funds, and more. Founded in 2009 and headquartered in Mumbai, Upstox is backed by prominent investors including Ratan Tata, Tiger Global, and Kalaari Capital. It operates under RKSV Securities and is registered with SEBI, NSE, BSE, and other regulatory bodies, ensuring secure and compliant trading experiences.
Related articles

Share Market
How the RBI Defends the Indian Rupee through Strategic Forex Intervention13 min read | Written by Bidita Sen

Share Market
Impact of Rupee Depreciation on the Stock Market3 min read | Written by Subhasish Mandal

Share Market
India's LPG Crisis Is the Wake-Up Call. Renewables Are the Answer6 min read | Written by Pradnya Surana


Share Market
What is the Difference Between Small Gain & Capital Gain?4 min read | Written by Dev Sethia

Share Market
Types of Stocks: Large Cap, Mid Cap, Small Cap Explained5 min read | Written by Pradnya Surana