The Significance of the Cup and Handle Pattern
Written by Pradnya Surana
Published on December 04, 2025 | 5 min read

Everyone wants to invest in stocks which can multiply their money quickly. While there is no guarantee of profit-making in stock markets, there are systematic and research-backed methods to identify stocks with growth potential and their buying points. These methods, though not foolproof, can still be a guiding light.
Traders often use price charts and the patterns they make and the market data to predict future stock price movements. This entire study of stock prices and the systematic approach to predicting future prices is known as ‘technical analysis’.
The Cup and Handle Pattern
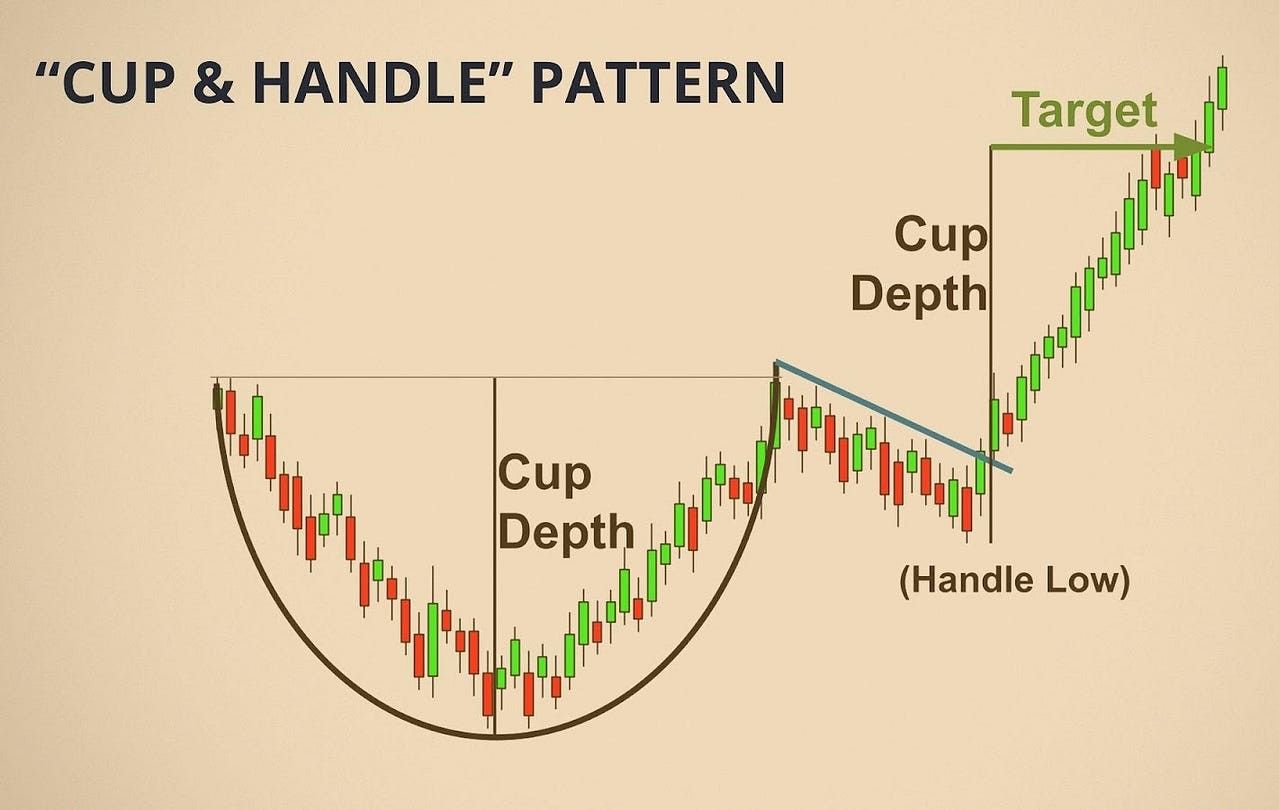
One of the important patterns that stock prices make and indicate a bullish trend is the ‘Cup and Handle’ pattern. As the name suggests, the price chart looks like a teacup and handle. This pattern is popular amongst traders because it indicates that stock prices are about to make a good upward movement.
Understanding Cup and Handle
The cup is formed when the price moves in a ‘U’ shape. Let's say the stock is priced at ₹500. It then drops down to ₹400, stays in this price range for some time and bounces back again to ₹500. This is the formation of a ‘cup’.
After this, the handle is formed. The stock price, instead of breaking higher immediately, consolidates a bit and the price comes down a little lower than ₹500. Even if it does not consolidate, it hovers around the price range of ₹500, creating a straight line. The handle is much smaller and shorter than the cup. Once the handle gets completed, the stock takes a bullish momentum and rises higher and higher.
Why This Pattern Makes Sense
This pattern makes sense when one understands psychology. A downward movement in cup formation, a lot of panic selling happens, which pushes the prices down further. Then, when the prices hover around a low point, it indicates that selling pressure has subsided. It's when buyers step in and when buying happens, the share prices again come back to where they had started falling.
The stock price doesn’t break out of it. Again, some hesitation steps in. Investors who bought at the lowest point, a few of them sell again, creating a handle. Once the stock breaks this handle’s price point, investors who were once on the sidelines since the stock price is moving upwards and they gain confidence and strong buying happens. This makes the prices spiral upwards, a breakout point that traders always look for.
As the logic behind this pattern is universal, traders use this pattern while trading crypto, forex and commodities.
Time Duration of Cup and Handle Pattern
The cup in this pattern takes a few weeks to a few months to form. The handle is usually formed in one to four weeks. In simple words, the cup forms gradually as the market regains confidence and the handle is a brief pause before the breakout.
It is important to note that there is no fixed or guaranteed timeline. Different markets, timeframes and conditions create different time frames. This pattern can be useful in both short and long time frames.
How to Spot a Genuine Cup and Handle
Amongst the several patterns price charts make, identifying a genuine cup and handle requires attention to detail. You can look for,
A perfect U shape and not a V shape recovery. A gradual consolidation at the bottom of the cup is considered healthy. On the other hand, V shape recoveries are generally not sustainable.
The handle of the cup should be shorter and shouldn’t be too deep. The handle’s height shouldn’t drop more than one-third of the cup’s height. Too much depth of the handle suggests selling pressure.
Volume is important. During cup formation, volume should decrease as prices fall and increase significantly in the rally back up.
Trading With the Pattern
Once you have identified a cup and handle, the traditional entry point is when the price reaches above the highest point of the handle with strong volume. Some traders wait for the price to close above this level to confirm the breakout isn't a false move.
For risk management, traders usually place a stop-loss below the lowest point of the handle. This protects you if the pattern fails and the price moves against you.
Important Things to Remember
The cup and handle pattern isn't foolproof. Like all technical patterns, it fails sometimes. Market conditions matter tremendously, this pattern works best in bull markets when overall sentiment is positive.
Also, never rely on a single pattern alone. Use the cup and handle alongside other technical indicators, fundamental analysis and an understanding of overall market conditions.

Final thoughts
The cup and handle pattern remains popular because it's relatively easy to spot and has a decent success rate when properly identified. It’s a combination of pictorial simplicity and market psychology. It is helpful both for beginners and experienced traders.
About Author
Pradnya Surana
Sub-Editor
is an engineering and management graduate with 12 years of experience in India’s leading banks. With a natural flair for writing and a passion for all things finance, she reinvented herself as a financial writer. Her work reflects her ability to view the industry from both sides of the table, the financial service provider and the consumer. Experience in fast paced consumer facing roles adds depth, clarity and relevance to her writing.
Read more from Pradnya


Upstox is a leading Indian financial services company that offers online trading and investment services in stocks, commodities, currencies, mutual funds, and more. Founded in 2009 and headquartered in Mumbai, Upstox is backed by prominent investors including Ratan Tata, Tiger Global, and Kalaari Capital. It operates under RKSV Securities and is registered with SEBI, NSE, BSE, and other regulatory bodies, ensuring secure and compliant trading experiences.
Related articles


Share Market
What is the Difference Between Small Gain & Capital Gain?4 min read | Written by Dev Sethia

Share Market
Types of Stocks: Large Cap, Mid Cap, Small Cap Explained5 min read | Written by Pradnya Surana


Share Market
How Dividends Help You Earn Passive Income From the Stock Market3 min read | Written by Pradnya Surana

Share Market
Growth Stocks in India – Their Meaning, How to Find & Examples4 min read | Written by Pradnya Surana